Highlights:
Energy and power densities quantitation of Li-ion cells (NMC NCA) from -20 to 55°C. Investigation and validation of an efficient model only based on datasheet at 25°C. Extension of this electro-thermal model to wider temperature and power ranges. Proposition of a non-isothermal Ragone plot to select the most suitable Li-ion cells. POSTPRINT VERSION. The final version is published here:
Zhang, Y. C., Briat, O., Boulon, L., Deletage, J. Y., Martin, C., Coccetti, F., & Vinassa, J. M. (2019). Non-isothermal Ragone plots of Li-ion cells from datasheet and galvanostatic discharge tests. Applied Energy, 247, 703-715. http://dx.doi.org/https://doi.org/10.1016/j.apenergy.2019.04.027 CC BY-NC-ND 4.0
1 2 3 4 5 6 7 8 9 10 11 12 13 14 15 16 17 18 19 20 21 22 23 24 25 26 27 28 29 30 31 32 33 34 35 36 37 38 39 40 41 42 43 44 45 46 47 48 49 50 51 52 53 54 55 56 57 58 59 60
Non-isothermal Ragone plots of Li-ion cells from datasheet
and galvanostatic discharge tests
Yuan Ci Zhang
1,2, Olivier Briat
1, Loïc Boulon
3, Jean-Yves Deletage
1, Cyril Martin
1,
Nicolas Chadourne
2, Jean-Michel Vinassa
11Univ. Bordeaux, CNRS, Bordeaux INP, IMS UMR 5218, F-33400 Talence, France 2IRT Saint-Exupéry, 3 rue Tarfaya, F-31400 Toulouse, France
3Univ. du Québec à Trois-Rivières, QC-G8Z2E9 Québec, Canada
*E-mail: [email protected]
Abstract
Ragone plot is a conventional tool to compare different energy storage systems in terms of energy and power densities. The selection of the most suitable Li-ion technology for a given application is usually based on the specific energy and power extracted from datasheets at ambient temperatures (25°C). However, these values are highly temperature-dependent. This study investigates experimentally and via numerical simulations a quantification of the energy and power densities for two different Li-ion chemistry cells in a wide operating temperature range. The experimental results reveal that these values determined from constant current discharge are approximately 15% higher than those determined for a constant power discharge. Therefore, a simple and efficient coupled electrical thermal model based on an equivalent circuit model (ECM) is proposed, which is able to estimate the voltage, temperature, and available discharged energy of 18650 Li-ion cells with a good accuracy. Moreover, all parameters in the model can be directly identified with
datasheets at 25°C. Then, the proposed Ragone plot model can be extended to wider temperature and power ranges. The relative error of the simulated energy density is below 2% for both technologies for all operating conditions from 20°C to 55 °C. Thus, a non-isothermal Ragone plot is established by considering the thermal effect for the first time. The proposed method could be employed as a conception aid tool for the selection of Li-ion cells in a system design process.
1 2 3 4 5 6 7 8 9 10 11 12 13 14 15 16 17 18 19 20 21 22 23 24 25 26 27 28 29 30 31 32 33 34 35 36 37 38 39 40 41 42 43 44 45 46 47 48 49 50 51 52 53 54 55 56 57 58 59 60
Keyword: Lithium batteries, Constant power discharge, Specific energy, Specific power, Temperature range, Technology comparison
1. Introduction
Li-ion batteries are used in various fields including portable devices, electric vehicles, aviation, and grid energy storage applications owing to their outstanding performance in terms of energy and power densities [1]. The market offers a large choice of Li-ion technologies. Users select the most suitable technology to meet the needs of applications based on different criterions such as the cell voltage, energy and power densities, life cycle, operating temperature range, lifetime, and cost [2]. Among them, the energy and power densities are the two most common criterions for the selection of the electrochemical energy storage element [3] [4].
In general, the specific energy and power densities are provided in the manufacture datasheet for cell scaling. However, the operating conditions applied to determine these values are not provided, and the energy and power densities are highly temperature-dependent. Therefore, it is essential to quantify the performance of Li-ion cells by considering the operating conditions. The Ragone plot is one of the most conventional tools and presents the energy density versus the power density of different energy storage systems (ESSs) [4] [5] [6]. Regarding batteries [7] and electrochemical capacitors [8], the available discharged energy in the Ragone plot is usually obtained under a constant power discharge. However, tests under a constant power discharge are rarely available. Constant current discharge under different currents is more common; e.g. in the vehicle IEC standards 62660 and aircraft standards DO-311 for rechargeable Li-ion batteries.
Over the last decades, many researchers have focused on constructing Ragone plots based on experimental tests or mathematical models to quantify and compare the performance of various Li-ion cells. Pell et al. [9] considered the Ohmic resistance and Tafel polarisation for batteries and electrochemical capacitors to correct the theoretical Ragone plot. Further, Christen et al. [10] built a general Ragone plot for all energy storage devices (e.g. batteries, capacitors, flywheels) based on a solution of an ordinary differential equation. Their model can place different ESSs into the same Ragone plot plan. However, in both mentioned studies, the internal resistance has been considered as
1 2 3 4 5 6 7 8 9 10 11 12 13 14 15 16 17 18 19 20 21 22 23 24 25 26 27 28 29 30 31 32 33 34 35 36 37 38 39 40 41 42 43 44 45 46 47 48 49 50 51 52 53 54 55 56 57 58 59 60
constant. In reality, the resistance of Li-ion cells depends on the temperature and state of charge (SOC).
Lately, research on Ragone plots has focused on the effect of the operating temperature. Verburgge et al. [11] investigated a model based on an equivalent circuit to plot the energy versus the power for Li-ion cells for the temperature range of -30 °C 45 °C. Kim et al. [12] proposed a model to simulate the discharge behaviour of Li-ion cells for environmental temperatures of 15 °C 45 °C. Both models can predict the available energy under various constant power loads and a large operating temperature range. However, their mathematical models lack certain physics and need a huge material propriety database.
Recently, Fuller [13] investigated a battery model for constant power discharge including the effect of the current level. Krieger and Arnold [6] investigated an equivalent circuit model (ECM) to predict not only the charging and discharging energy but also the energy efficiency at a given power. Nevertheless, their models are only valid at 25 °C. Sarpal et al. [14] underlined that the performance quantification of Li-ion cells depended on the operating conditions during a constant power discharge. To prove this, a Ragone diagram was created based on many experimental tests under varying operating conditions. According to their results, the voltage range, current level, and temperature range must be considered in the performance quantification of Li-ion cells.
Capasso et al. [15] investigated large experimental tests based on the charge and discharge at constant current and power in order to evaluate the available energy, the charging efficiency and the performance under mission profile of two different lithium storage technologies (LFP, NMC) module and one lead acid battery module used for full electric and hybrid vehicles. However, the battery module choice requires heavy experiments with a realist powertrain. At the early stage of a design process, the engineering team faces dozen of cell references and a first selection tool is requested.
This work proposes a common and generic tool - for the
technology selection at cell level before integration in a module and then in a system application. This paper investigates electrical thermal model to estimate the energy and power densities of different
1 2 3 4 5 6 7 8 9 10 11 12 13 14 15 16 17 18 19 20 21 22 23 24 25 26 27 28 29 30 31 32 33 34 35 36 37 38 39 40 41 42 43 44 45 46 47 48 49 50 51 52 53 54 55 56 57 58 59 60
ion cells for wide operating temperature and power ranges. A simple and efficient process to plot Ragone diagrams from datasheets or most common experimental galvanostatic test results (under constant current discharges) is proposed.
The remainder of this paper is organised as follows: Section 2 introduces the manufacture datasheet of the Li-ion cells and the experimental setup. Section 3 presents the experimental Ragone plots for a variety of operating conditions. These plots are produced from constant power discharge tests and will be used for validation purposes in subsequent studies. The choice of the ECM and parameter identification is explained in section 4. In section 5, the proposed Ragone plot model is validated, and the predicted energies for several constant power discharges and large operating temperature range are presented and compared in an enhanced non-isothermal Ragone plot. Finally, section 6 presents the conclusions.
2. Tested cell and experimental setup
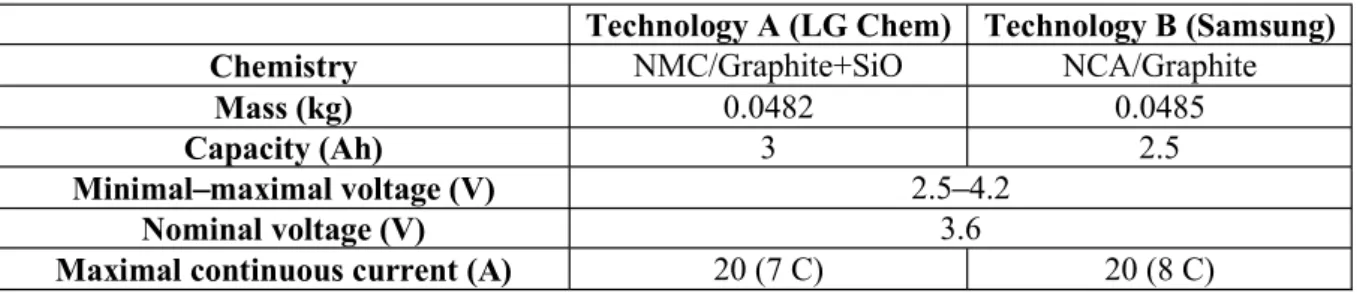
This study was designed to be as generic as possible and two different Li-ion chemistry cells were selected (Table 1). The first technology is from LG Chem Ltd. It has a capacity of 3 Ah and is based on an Li[NiMnCo]O2 (NMC) cathode and graphite with an SiO anode. The second battery is from Samsung Electronics Co., Ltd. It has a 2.5 Ah capacity and is based on an Li[NiCoAl]O2 (NCA) cathode and a graphite anode. Both batteries have the 18650 format. In this study, the NMC Li-ion cell is categorised as the energy cell, whereas the NCA cell from Samsung is considered the power cell. Both technologies can be discharged from 4.2V to 2.5V, they can work between -20 °C and 55 °C. In addition, the maximal current level is the same (20A). They were selected thanks to their high energy and high power densities. Figure (1) presents the constant current discharge curves at 25 °C for multiple current levels.
Table 1 Characteristics of investigated Li -ion batteries
Technology A (LG Chem) Technology B (Samsung)
Chemistry NMC/Graphite+SiO NCA/Graphite
Mass (kg) 0.0482 0.0485
Capacity (Ah) 3 2.5
Minimal maximal voltage (V) 2.5 4.2
Nominal voltage (V) 3.6
1 2 3 4 5 6 7 8 9 10 11 12 13 14 15 16 17 18 19 20 21 22 23 24 25 26 27 28 29 30 31 32 33 34 35 36 37 38 39 40 41 42 43 44 45 46 47 48 49 50 51 52 53 54 55 56 57 58 59 60
Operating discharge temperature (°C) -20 55
Maximal discharge temperature (°C) 75
Maximal energy density (Wh/kg) 228 181
Maximal power density (W/kg) 1701 1647
Galvanostatic curves based on constant current discharge provided by technical datasheet
Fig. 1 Constant current discharge curves at 25 °C for multiple C rates of Technology A (left) [16] and B (right) [17]
The equipment of the CACYSSEE platform allows to perform different test types combining electrical and thermal conditions. Bio-Logic BCS-815 is a multi-channel battery tester that can provide constant power and constant current discharges. Each channel can produce a maximal power of 30 W or maximal current of 15A.
To test cylindrical cells as 18650 format (18mm diameter, 65mm height), the most convenient way is to use a battery holder that does not require additional tabs welded on the cell. In this battery holder, the direct electrical connections with cell terminals is based on four-terminal sensing thanks to dedicated spring probes with Kelvin contact, which ensure an accurate measurement of voltage without contact resistance influence.
The climatic chambers TM385 of Climats Co. can provide stable and constant ambient temperatures that cover the temperature range of our study (-20 °C 55 °C). The temperature at the surface of the cell is measured via a K-type thermocouple. Figure (2) illustrates the typical experimental setups for the 18650 Li-ion cells. All analyses and parameter identifications are executed via Matlab® and the Simulink® software
1 2 3 4 5 6 7 8 9 10 11 12 13 14 15 16 17 18 19 20 21 22 23 24 25 26 27 28 29 30 31 32 33 34 35 36 37 38 39 40 41 42 43 44 45 46 47 48 49 50 51 52 53 54 55 56 57 58 59 60
Experimental mounting for 18650 Li-ion cells tests
Fig. 2 Experimental setups of Li-ion cells (a) Battery cycler, (b) Battery holder in the climatic chamber, (c)
3. Performance quantification with experimental approach 3.1. Experimental Ragone plot
Before developing a generic methodology to obtain Ragone plots without dedicated experiments, regular experimental Ragone plots are established for further comparison purposes for both technologies at 55 °C, 25 °C, 0 °C, and -20 °C under low (3 W), medium (15 W), and high (30 W) constant discharge power levels. A standard CC CV charging method at 1 C is employed for both technologies until the cut-off current reaches C/20. Next, multiple constant power discharges are investigated for a specific temperature after three hours of thermal stabilisation in the climatic chamber, respectively. Figure (3) illustrates the experimental procedure of the constant power discharge under three power levels for Technology B at 25 °C. In the constant power discharge, the high power leads to a high current. Therefore, the duration of the constant power discharge decreases under high power levels.
1 2 3 4 5 6 7 8 9 10 11 12 13 14 15 16 17 18 19 20 21 22 23 24 25 26 27 28 29 30 31 32 33 34 35 36 37 38 39 40 41 42 43 44 45 46 47 48 49 50 51 52 53 54 55 56 57 58 59 60
Constant power discharge profile
Fig. 3 Experimental constant power discharge procedure for Technology B at 25 °C; power, cell voltage, current, and temperature versus time, respectively
Regarding the Ragone plot, the power density is determined with Equation (1), where P is the constant power applied to the cell. The energy density Edis is defined via Equation (2); U(t) is the cell voltage and I(t) the cell current during the constant power discharge; ti and tf correspond to the beginning and end of the discharge, respectively; m is the cell mass. In a conventional Ragone plot, the performance quantification of the electrochemical ESSs is performed at the beginning of the life cycle; the cells are in a fresh state.
(1) (2)
Figure (4) illustrates the experimental Ragone plot for a constant power discharge. The discharged energy densities are plotted versus the power density based on Equations (1) and (2). The dotted lines correspond to the time needed to perform a complete constant power discharge. Firstly, for both technologies, it can be observed that the available energy increases with increasing temperature under
1 2 3 4 5 6 7 8 9 10 11 12 13 14 15 16 17 18 19 20 21 22 23 24 25 26 27 28 29 30 31 32 33 34 35 36 37 38 39 40 41 42 43 44 45 46 47 48 49 50 51 52 53 54 55 56 57 58 59 60
equal discharged power levels. The energy density increases by approximately 20% for the investigated temperature range (-20 °C 55 °C). Hence, the available energy is limited by the cold environment. Secondly, at all operating temperatures, Technology A exhibits higher energy densities than Technology B. It seems that Technology A has a better performance. This point will be further discussed in the following section.
Fig. 4 Experimental Ragone plot for Technology A and Technology B at 55 °C, 25 °C, 0 °C, and -20 °C
3.2. Comparison for constant current discharge
Inspired by the paper of Veneri et al. [18], the constant current discharge were also performed on the investigated Li-ion cells in order to quantify their energy and power densities. For this, both cells are charged with the classical CC-CV method at 25 °C. Next, a continuous discharge with a constant current at 1 C, 3 C, and 5 C is applied at -20 °C, 0 °C, 25 °C, and 55 °C after three hours of thermal stabilisation, respectively. All currents of the constant current discharge are in accordance with the recommended current ranges of the datasheet.
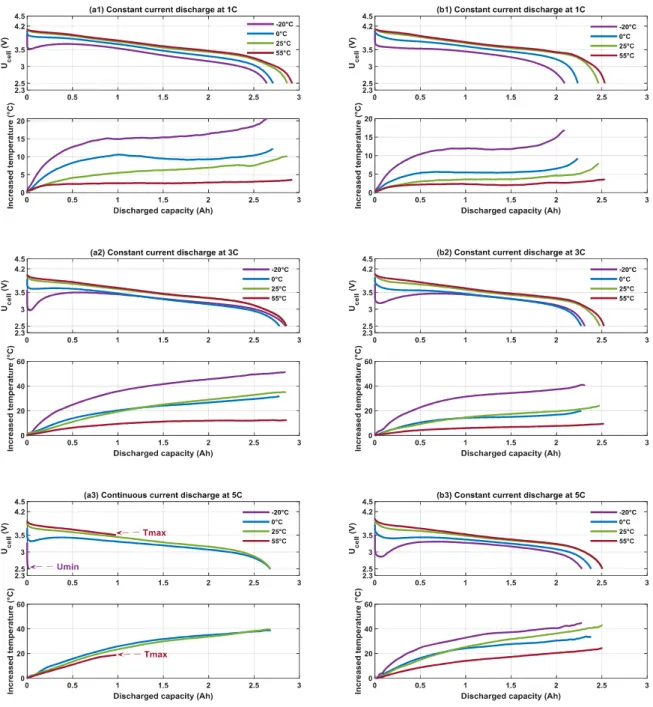
Figure (5) presents the cell voltage and increased temperature at the cell surface versus the discharged capacity during the constant current discharge. The discharged capacity depends on the temperature and current in both technologies. It increases with the temperature at all current rates in Technology A and B. However, the constant current discharge for Technology B at 55 °C and -20 °C is incomplete owing to the limits of safe operating conditions. As illustrated in Figure (5 a3), during a
1 2 3 4 5 6 7 8 9 10 11 12 13 14 15 16 17 18 19 20 21 22 23 24 25 26 27 28 29 30 31 32 33 34 35 36 37 38 39 40 41 42 43 44 45 46 47 48 49 50 51 52 53 54 55 56 57 58 59 60
constant current discharge at 55 °C, the temperature at the cell surface exceeds 75 °C. This is the maximal operating temperature and the constant current discharge is therefore interrupted to avoid a thermal runway [19]. At -20 °C, the cell voltage reaches 2.5 V, which is the minimal voltage. This behaviour is owing to the high internal resistance at low temperatures [20].
Fig. 5 Ucell and increased temperature versus discharged capacity at -20 °C, 0 °C, 25 °C, 55 °C during constant
1 2 3 4 5 6 7 8 9 10 11 12 13 14 15 16 17 18 19 20 21 22 23 24 25 26 27 28 29 30 31 32 33 34 35 36 37 38 39 40 41 42 43 44 45 46 47 48 49 50 51 52 53 54 55 56 57 58 59 60
For a continuous discharge current at 1 C and 3 C, the increased temperature at -20 °C is approximately four times higher than that at 55 °C. For 5 C, this difference decreases, which indicates that the high current has an important contribution to the cell self-heating during the discharge [21].
The energy density for a continuous discharge can be determined with Equation (2). The power density is the product of cell voltage and cell current during a complete discharge. Because the discharge test procedure is changed, it is assumed that the values of energy and power densities might be different. However, only few papers mention this difference [22].
Fig. 6 Energy density versus power density at 55 °C, 25 °C, 0 °C, and -20 °C determined for constant current discharge (1 C, 3 C, 5 C) and constant power discharge (3 W, 15 W, 20 W) for Technology A (left) and B (right)
Figure (6) compares the energy and power densities determined via the two test procedures. Regarding Technology A, the energy and power densities measure more than 15% under constant current discharge compared with the values for the constant power discharge. This difference is more significant for Technology B. The energy densities determined for a constant current discharge measure more than 25% at 55 °C and -20 °C with respect to the values for a constant power discharge. Our results are in a good agreement with those reported by Sarpal et al. [14].
The most common test procedures employ a constant current discharge to characterise Li-ion cell performances. However, the energy and power densities based on a constant current discharge are higher than the values determined for a constant power discharge. To determine the optimal Li-ion
Constant current discharge (LG NMC) Constant current discharge (Samsung NCA) Constant power discharge (LG NMC) Constant power discharge (Samsung NCA)
1 2 3 4 5 6 7 8 9 10 11 12 13 14 15 16 17 18 19 20 21 22 23 24 25 26 27 28 29 30 31 32 33 34 35 36 37 38 39 40 41 42 43 44 45 46 47 48 49 50 51 52 53 54 55 56 57 58 59 60
technology for a given application, the next part investigates the parameterisation of a model based on constant current tests in order to simulate constant power discharges and obtain Ragone plots. In addition, because the constant current discharge curves are often provided by the manufacturer, the accuracy of the process can be directly evaluated with the datasheets.
4. Performance quantification with Ragone plot model
The Ragone plot model must be able to predict the voltage, current, discharge duration, and discharged energy of the Li-ion cell for a constant power discharge. Moreover, because the proposed model must be validated for different operating temperatures, a thermal model must be included. In a conventional Ragone plot, the performance quantification of electrochemical ESSs is performed at the beginning of a life cycle. Hence, the batteries are in a fresh state and the ageing model is not considered.
4.1. Electrical model
Equivalent circuit models (ECMs) are selected to simulate the performance of various devices, e.g. batteries [23] and supercapacitors [24], thanks to their simple implantation into a Battery Management System (BMS ) and sufficient accuracy [25]. Different ECMs have been proposed and compared in [23] [26].
In this study, the Rint model is selected. Because the model must be able to validate different chemistries of Li-ion cells, the fewer identified parameters users have, the fewer experimental tests and identifications are required. Most importantly, a good accuracy must be ensured. Barreras et al. [27] used the Rint model based on the manufacture datasheet to simulate a constant current discharge under various currents. A good accuracy was achieved. In the conventional Ragone plot, the available discharged energy is always calculated for a constant power discharge from maximal to minimal voltage [7], which is considered as quasi-static behaviour of the Li-ion cell [28]. Therefore, the dynamic behaviour is not considered in the proposed Ragone plot model.
Regarding the Rint model, two parameters (Uoc, Rint) must be identified; Uoc is the voltage of the Li-ion cell in the open-circuit state and depends on the SOC and temperature. The other parameter is the
1 2 3 4 5 6 7 8 9 10 11 12 13 14 15 16 17 18 19 20 21 22 23 24 25 26 27 28 29 30 31 32 33 34 35 36 37 38 39 40 41 42 43 44 45 46 47 48 49 50 51 52 53 54 55 56 57 58 59 60
total internal resistance Rint of the Li-ion cell. It depends on the SOC and temperature of the cell. The SOC of the battery is defined in Equation (3), where SOCi is the initial SOC, Ci the initial capacity of the cell, and I(t) the discharge current.
(3)
4.1.1. Uoc identification
In contrast to the identification of the UOC via a pulse discharge characterisation test [26] [29], the pseudo-Open Circuit Voltage (OCV) test is used in the Rint model. The duration of relaxation to obtain a static OCV after a pulse discharge at -20 °C and 0 °C is approximately six times higher than that for an OCV measured at 25 °C and 55 °C for an Li-ion cell [30]. Moreover, this duration depends on the SOC, discharge current, and chemistry of the cell [30]. To conduct the same test procedure for both technologies, a standard CC CV charge at 0.5 C is employed until the cut-off current is reached at C/20 in both technologies. Then, a continuous discharge with a low current at C/20 is carried out at -20 °C, 0 °C, 25 °C, and 55 °C after three hours of thermal stabilisation in a climatic chamber.
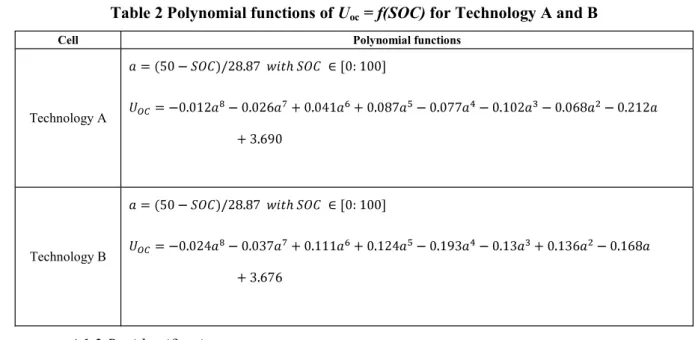
Figure (7) illustrates the pseudo-OCV at different temperatures and the corresponding polynomial functions in Table 2 for Technology A and Technology B. The temperature has an impact on UOC for extreme SOCs [31]. However, for both technologies, besides the pseudo-OCV at -20 °C, the other curves of UOC = f (SOC) are approximately superimposed. Therefore, one fitting curve can be obtained by applying the average over all curves. Next, the pseudo-OCV versus the SOC is fitted with a polynomial function using the Matlab® curve fitting tool.
1 2 3 4 5 6 7 8 9 10 11 12 13 14 15 16 17 18 19 20 21 22 23 24 25 26 27 28 29 30 31 32 33 34 35 36 37 38 39 40 41 42 43 44 45 46 47 48 49 50 51 52 53 54 55 56 57 58 59 60
Fig. 7 Pseudo-OCV at -20 °C, 0 °C, 25 °C, and 55 °C for (a) Technology A and (b) Technology B
Table 2 Polynomial functions of Uoc = f(SOC) for Technology A and B
Cell Polynomial functions
Technology A
Technology B
4.1.2. Rint identification
The internal resistance can be calculated according to Equation (4), where Ucell is the cell voltage during the constant current discharge and depends on the SOC, which is the available ampere hour in relation to the total maximal discharged capacity for each operating condition, temperature (T), and current (I); UOC can be determined with the polynomial function in Table 2. The internal resistance is determined from two quasi-static regimes, which also correspond to the regime of a constant power discharge.
(4)
As the internal resistance depends on three variables, a multiple linear regression based on a stepwise method can be applied. Mathieu et al. [32] used this method to investigate the dependency between the degradation rate of the Li-ion batteries and ageing factors (temperature, current, and SOC) to predict the capacity fade. A good accuracy was achieved. Multiple linear regression based on the stepwise method is designed to use a minimal set of independent variables of a regression model while maximising the adjusted determination coefficient and minimising the mean squared deviation from the regression model. This method involves, in its first step, the construction of a model containing all potentially dependent variables. These are gradually eliminated to obtain a model with maximal determination coefficients and maintain significance of the parameters [33].
1 2 3 4 5 6 7 8 9 10 11 12 13 14 15 16 17 18 19 20 21 22 23 24 25 26 27 28 29 30 31 32 33 34 35 36 37 38 39 40 41 42 43 44 45 46 47 48 49 50 51 52 53 54 55 56 57 58 59 60
In our case, the dependent variable is the internal resistance. The independent variables are SOC, temperature, and current. Several studies [28] [34] have shown that the logarithmic internal resistance has a linear dependency of 1/T (T in Kelvin). Thus, a transformation of the internal resistance and temperature term is conducted. The proposed multiple linear regression function is described in Equation (5). It includes all first-order terms, second-order interactions, and quadratic terms for the three variables. The stepwise method is executed with the Matlab® function stepwiselm of the Statistics and Machine Learning Toolbox. Table 3 lists all coefficients obtained for each term in the multiple regression and the corresponding coefficients of determination for Technology A and Technology B.
Certain coefficients like and are too small. Hence, the corresponding variable has a weak impact on the internal resistance. Further, there is no second-order interaction for the SOC current for Technology A. Technology B has a weak second-order interaction for the SOC current. In addition, both technologies have a weak quadratic coefficient in front of SOC2.
(5)
Table 3 Coefficients of multiple linear regression for Technology A and B
Technology A R² = 0.83 Technology B R² = 0.81 0.87 , , , , , , , ,
In Figure (8), the black circles represent the experimental internal resistance versus the temperature and SOC according to Equation (4). The 3D mapping is constructed with the proposed multiple linear regression determined via Equation (5) for Technology A and B at 1 C, 3 C, and 5 C, respectively. For both technologies, the experimental data are located at the surface of the 3D map. It can be observed that the internal resistance increases with decreasing temperature and SOC. Further, the internal resistance decreases with increasing current. These tendencies correspond to the internal resistance
1 2 3 4 5 6 7 8 9 10 11 12 13 14 15 16 17 18 19 20 21 22 23 24 25 26 27 28 29 30 31 32 33 34 35 36 37 38 39 40 41 42 43 44 45 46 47 48 49 50 51 52 53 54 55 56 57 58 59 60
behaviour of Li-ion batteries [35]. Moreover, a good coefficient of determination (R²) (Table 3) is found for both technologies.
Fig. 8 Experimental internal resistance and 3D mapping of Rint = f(SOC, T) at 1 C, 3 C, 5 C for Technology A
(left) and Technology B (right) according to stepwise regression. The coloured axis represents the value of Rint
1 2 3 4 5 6 7 8 9 10 11 12 13 14 15 16 17 18 19 20 21 22 23 24 25 26 27 28 29 30 31 32 33 34 35 36 37 38 39 40 41 42 43 44 45 46 47 48 49 50 51 52 53 54 55 56 57 58 59 60
To simulate the temperature at the surface of Li-ion battery, Cicconi et al. [36] demonstrated that different heat sources appeared in Li-ion cell during charge or discharge, which included the Joule heat, reversible heat, the mixing process heat, the thermal conduction heat and the convection heat. In our study, the thermal model is simplified with some hypothesis [37]. Firstly, the tested Li-ion cell is assumed to be an isotropic and homogenous element that has uniform physical properties in the whole volume [26]. Secondly, the calorific capacity of cell is considered as a constant value that is independent of the temperature [38]. Thirdly, the mixing process heat is neglected because this heat source is due to the concentration gradient in the Li-ion cell, which is more important for the dynamic behavior than for the quasi-static one. Therefore, only the irreversible heat, reversible heat and convection heat appear in the thermal model [26]. The proposed thermal model is established by the thermal energy balance expressed in equation (6), where m (kg) is the masse of cell; Cp (J.kg-1.K-1) is the cell calorific capacity; T (K) is the cell temperature; t (s) is the time of constant power discharge; Qirr, Qrev and Qconv correspond the irreversible heat, reversible heat and convection heat respectively. Balaya et al. [39] measured the calorific capacity of 18650 NCA/graphite Li-ion cell thanks to the experimental tests in an accelerated rate calorimeter (ARC). The same tests were performed by Eddahech et al. [40] for a NMC Li-ion cell. These calorific capacity values are used in our thermal model, which are listed in Table 4 for the corresponding technology.
(6) (7) (8) (9)
Table 4 Caloric capacity values used for the thermal model [39] [40]
Cell Cp (J.kg-1.K-1)
Technology A (NMC) 1070 [40]
Technology B (NCA) 939 [39]
1 2 3 4 5 6 7 8 9 10 11 12 13 14 15 16 17 18 19 20 21 22 23 24 25 26 27 28 29 30 31 32 33 34 35 36 37 38 39 40 41 42 43 44 45 46 47 48 49 50 51 52 53 54 55 56 57 58 59 60
The irreversible heat is described in Equation (7). This heat source is determined by the cell operating current and overpotential. The overpotential is the voltage drop owing to the internal resistance, which is also called Joule heat. This internal resistance is found in the electrical model that depends on SOC, temperature, and current, as presented in 3.1.2. Therefore, the thermal model is associated with the electrical model.
4.1.4. Reversible heat
As determined via Equation (8), the reversible heat is a derivative term of OCV with respect to the temperature. This heat source represents the entropy variation in a charge or discharge process in the Li-ion cell. It is strongly influenced by the SOC and chemistry. Liu et al. [41] reported a significant contribution of reversible heat during the operation of an Li-ion cell at a low current and high temperature. The reversible heat represented 50% of the total heat for a cell discharged at 45 °C with 1 C. By contrast, Huang et al. [42] found out that the reversible heat was more significant for a high discharge rate of an Li-ion cell. Thus, the contribution of the reversible heat source are still not clarified. Nevertheless, the reversible heat cannot be ignored in a thermal model for constant power discharge at different operating temperatures.
As shown in Equation (8), the reversible heat depends on the current, temperature of cell and
entropic coefficient ( ). Thus, only the entropic coefficient is needed to be determined.
Manikandan et al. [39] determined the entropic coefficient for 35 °C 55 °C. Eddahech et al. [40] measured the entropic coefficient for 15 °C 55 °C, and Marcicki et al. [43] obtained this value with experimental tests at 0 °C 55 °C. These studies found a constant entropic coefficient at different SOCs. However, this parameter was always determined for a positive temperature range. Recently, Zilberman et al. [44] found out a non-constant entropic coefficient for different Li-ion cells. Overall, the impact of the temperature on the entropic potential is still unclarified. Furthermore, the temperature range used to determine this value is always above 0°C.
Another problem is the duration of the waiting time for the OCV acquisition. If the waiting time is too long, the self-discharge of the Li-ion cell will occur particularly at high temperatures [41] and
1 2 3 4 5 6 7 8 9 10 11 12 13 14 15 16 17 18 19 20 21 22 23 24 25 26 27 28 29 30 31 32 33 34 35 36 37 38 39 40 41 42 43 44 45 46 47 48 49 50 51 52 53 54 55 56 57 58 59 60
SOCs [45]. If the waiting time is too short, the cell voltage relaxation can cause an error in the entropic potential measurement [45]. To minimise these impacts, Forgez et al. [45] proposed an OCV method based on a linear regression as a function of temperature and time. This method allows to extract the OCV change based only on the variation in the temperature.
Because much uncertainty still exists regarding the negative temperature range impact on the OCV variation, the entropic potential is determined for a temperature range of -15 °C 25 °C with OCV correction in our proposed model. The potentiometric method is used to determine the entropic potential. The experimental test process is similar as in the paper [40], which consists of monitoring the OCV of Li-ion cell at different SOCs (100%, 80%, 60%, 40%, 20% and 0% SOCs) at different temperatures (25 °C, 15 °C, 5 °C, -5 °C, and -15 °C) successively. The 18650 Li-ion cells were charged with classical CC-CV method at C/2, they were discharged with a constant current (C/2) to reset the cells for the targeted SOCs at 25°C. After 3 hours relaxation, the climatic chamber were programmed to hold on the targeted temperatures. Each temperature step lasted 6 hours for OCV measurement in order to reach the thermodynamic equilibrium [40]. This protocol was repeated for each technology at each SOC. One example of Technology B at 60% SOC is presented in Figure (9). The temperature and OCV versus time are presented in Figure (9 a, b) respectively. It can be observed that the OCV is corrected. A simple linear function is used to remove the self-discharge impact on the OCV variation. Regarding Figure (9 c), a clear linear dependency is observed between the average corrected OCV and temperature. The slope of the linear regression represents the entropic coefficient.
1 2 3 4 5 6 7 8 9 10 11 12 13 14 15 16 17 18 19 20 21 22 23 24 25 26 27 28 29 30 31 32 33 34 35 36 37 38 39 40 41 42 43 44 45 46 47 48 49 50 51 52 53 54 55 56 57 58 59 60
Fig. 9 Potentiometric test results for Technology B at 60% SOC. (a) Temperature versus time, (b) OCV versus time, (c) OCV versus temperature
Based on the same method, the entropic potentials at different SOCs for both technologies (NMC and NCA) are presented in Figure (10). The entropic potential is negative at low SOCs and positive at high SOCs for both Li-ion technology chemistries. The sign of the entropic potential indicates the thermodynamic behaviour: endothermic and exothermic reactions coexist during the complete discharge process [44].
1 2 3 4 5 6 7 8 9 10 11 12 13 14 15 16 17 18 19 20 21 22 23 24 25 26 27 28 29 30 31 32 33 34 35 36 37 38 39 40 41 42 43 44 45 46 47 48 49 50 51 52 53 54 55 56 57 58 59 60 4.1.5. Convection heat
As the proposed thermal model must be able to predict the cell temperature for a large range of operating temperatures, the convection heat must be considered. Equation (9) describes the convection heat, where h (W.m-2.K-1) is the heat transfer coefficient, A (m²) the exchange surface, T
air (K) the environmental fluid temperature that is imposed by the climatic chamber, and T (K) the temperature at the centre of the surface of the 18650 cell. The convection heat depends on the object geometry. The exchange surface in this study is the total surface of the 18650 cell (Table 5).
The heat transfer coefficients used in the investigated thermal model are based on several papers. Each value is listed in Table 5 with the corresponding operation conditions for 18650 Li-ion cell. It can be observed that these values depends on the temperature and current [26]. Nakayama et al. [46] established a relationship between the heat transfer coefficient and the temperature of cell from 20 °C to 80 °C for a commercial 18650-type Li-ion cell. Thus, the heat transfer coefficient can be identified according to this relationship for the investigated cells discharged above 25°C [46]. In addition, these values are similar as the heat transfer coefficient determined by Wu et al. according to the experimental tests for 18650 Li-ion cell [47] and by Wang et al. [48]. Concerning the cells discharged below 0 °C, the determination of heat transfer coefficient is based on the paper of Li et al. [21] for the cell discharged under 1C and 3C at 0°C and -20°C, a method based on the cooling time was proposed to determine the heat transfer coefficient for 18650 Li-ion cell. The rest heat transfer coefficient values are referred by our previous work [26]. Otherwise, it is assumed that the heat transfer coefficient stays constant during the operating conditions in this study.
Table 5 Surface and convective coefficients in thermal model [21] [26] [46] [47] [48]
Cell
Surface A (m²)
Discharged current C rate (A)
Heat transfer coefficient h (W.m-2.K-1) T = 55 °C T = 25 °C T = 0 °C T = -20 °C 18650 cell 0.0042 C/3 10.5 [46] 11 [46] [47] [48] 12 [26] 15.47 [26] 1 C 11.5 [46] 13.48 [46] 20 [26] 28.4 [21] 3 C 14 [46] 28.4 [21] 28.4 [21] 30 [26]
1 2 3 4 5 6 7 8 9 10 11 12 13 14 15 16 17 18 19 20 21 22 23 24 25 26 27 28 29 30 31 32 33 34 35 36 37 38 39 40 41 42 43 44 45 46 47 48 49 50 51 52 53 54 55 56 57 58 59 60
5. Validation of Ragone plot model
In this section, the proposed Ragone plot model is first validated at 25 °C with a constant current discharge. In addition, we found out that the prediction of the energy and power densities is possible by directly using the discharge curves provided by the manufacturer. The Ragone plot model can be extended to 55 °C, 0 °C, and -20 °C to construct a non-isothermal Ragone plot.
5.1. Ragone plot model for 25 °C
Figure (11) illustrates the voltage and temperature of the cell under 3 W, 15 W, and 30 W for constant power discharges at 25 °C. The experimental data of the cell voltage and cell temperature are in a good agreement with the simulated results based on the galvanostatic curves for both technologies. Because these discharge curves are provided by the manufacturer (Figure (1)), it is possible to directly establish a model with the technical datasheet. For this, the cell voltage (Ucell) for multiple currents at different SOCs can be recorded. After data acquisition, the same modelling and simulation process is used. For the internal resistance (Rint) simulation blocks, the 2-D lookup table is replaced by the multiple linear regression function.
Moreover, Figure (11) presents the datasheet-based discharge curves for cell voltage and temperature during a constant power discharge at 25 °C. The datasheet-based curves are all superimposed on the experimental curves. However, regarding Technology A, the simulated temperature for 30 W exceeds the experimental temperature at the end of the discharge. This behaviour might be owing to the internal resistance. The internal resistance in the 2-D lookup table is independent of the temperature, which increases much under a high power discharge. Consequently, the cell voltage, cell temperature, and available energy and power can be predicted directly by using the technical datasheet for both Li-ion cell chemistries.
1 2 3 4 5 6 7 8 9 10 11 12 13 14 15 16 17 18 19 20 21 22 23 24 25 26 27 28 29 30 31 32 33 34 35 36 37 38 39 40 41 42 43 44 45 46 47 48 49 50 51 52 53 54 55 56 57 58 59 60
Fig. 11 Simulation versus experimental data of cell voltage and temperature for Technology A (a) and B (b) under constant power discharge (3 W, 15 W, 30 W) at 25 °C
Fig. 12 Comparison of simulated energy density versus power density; galvanostatic-based, datasheet-based and experimental results for Technology A (left) and B (right)*
1 2 3 4 5 6 7 8 9 10 11 12 13 14 15 16 17 18 19 20 21 22 23 24 25 26 27 28 29 30 31 32 33 34 35 36 37 38 39 40 41 42 43 44 45 46 47 48 49 50 51 52 53 54 55 56 57 58 59 60
Figure (12) presents the Ragone plots of the experimental and simulated galvanostatic-based and datasheet-based results at 25 °C. The simulated and experimental results are in a good agreement. Thus, the proposed electrical thermal model is able to predict the cell voltage, cell temperature, and available discharged energy with galvanostatic curves under a low, medium, and high constant power discharge at 25 °C for two 18650 Li-ion cell chemistries.
5.2. Extending Ragone plot model for large operating temperature range
The Ragone plot model based on galvanostatic curves is extend onto a large operating temperature range. Figure (13) compares examples of simulated curves to experimental curves for the cell voltage and temperature of Technology A at 55 °C (Figure (13 a)) and Technology B at -20 °C (Figure (13 b)). The experimental results of the cell voltage and cell temperature at 0 °C are in a good agreement with the simulated results for both technologies.
Technology A (NMC, LG) Technology B (NCA, Samsung)
Fig. 13 Simulation versus experimental data for Technology A (left) and B (right) under constant power discharge at 3 W, 15 W, and 30 W at (a) 55 °C (b) : -20 °C
1 2 3 4 5 6 7 8 9 10 11 12 13 14 15 16 17 18 19 20 21 22 23 24 25 26 27 28 29 30 31 32 33 34 35 36 37 38 39 40 41 42 43 44 45 46 47 48 49 50 51 52 53 54 55 56 57 58 59 60
At 55 °C (Figure (13 a)), the cells reach the maximal operating temperature (75 °C) at 30 W for a constant power discharge. A small discrepancy is observed between the simulated and experimental curves regarding the cell temperature at 3 W. This behavior may be due to the determination of entropic coefficient. Since as presented in the section 4.2.2, the entropic coefficient is determined between -15°C and 25°C, 55°C is out of this temperature range, moreover, Liu et al. [41] demonstrated that the contribution of reversible heat was important at low current and high temperature, therefore the difference between estimated and experimental temperature is more obvious under low power level. However, this slight temperature deviation (1 °C) has the same magnitude as the thermocouple precision.
As illustrated in Figure (13 b), the difference between simulation and experimental data is obvious at -20 °C for Technology B. This difference is not only owing to the internal resistance but also owing to the heat transfer coefficient (h). Li et al. [21] showed that the performance of an Li-ion cell is more sensitive to h at -20 °C with a high current. However, in our proposed thermal model, this parameter is constant during a constant power discharge. Therefore, the temperature gap is more significant at 15 W and 30 W.
Finally, the discharged energy can be predicted by integrating the power value for each operating condition. The relative error (Errrel) is determined via Equation (10), where Esim is the simulated energy and Eexp is the experimental data.
(10)
Table 6 Eexp, Esim, and Errrel at 55 °C, 0 °C, and -20 °C for both technologies
Temperature 55 °C 0 °C -20 °C Parameters P (W/kg) Eexp (Wh/kg) Esim (Wh/kg) Errrel (%) Eexp (Wh/kg) Esim (Wh/kg) Errrel (%) Eexp (Wh/kg) Esim (Wh/kg) Errrel (%) Technology A 62.2 210 212 0.9 200 201 0.5 172 175 1.7 311 205 204 0.5 190 189 0.5 153 152 0.7 622 200 197 1.5 186 185 0.5 161 163 1.2 Technology B 61.9 185 187 1.1 167 166 0.6 139 140 0.8 309 182 183 0.5 156 158 1.3 133 132 0.8
1 2 3 4 5 6 7 8 9 10 11 12 13 14 15 16 17 18 19 20 21 22 23 24 25 26 27 28 29 30 31 32 33 34 35 36 37 38 39 40 41 42 43 44 45 46 47 48 49 50 51 52 53 54 55 56 57 58 59 60 619 174 171 1.7 166 165 0 125 126 0.8
Table 6 lists the experimental and simulated energy densities with the corresponding relative errors for 3 W, 15 W, and 30 W. It can be observed that the energy density decreases with increasing power level. All relative errors are below 2% for both technologies and all temperatures. In addition, the discharge energy decreases with decreasing operating temperature for the same power levels, which means that low temperatures limit the available energy. Surprisingly, at -20 °C, Technology A gains 5% in available energy at -20 °C under 30 W with respect to the value for 15 W. The same behaviour is observed for Technology B at 0 °C. In both cases, the increased temperature at the cell surface is significant. Discharging an Li-ion cell at low temperatures with a high current favours self-heating, which can increase the cell temperature and cause more available energy [21]. This interesting feature indicates that a high current can enhance the available energy of the Li-cell at low temperatures.
5.3. Enhanced non-isothermal Ragone plot
A non-isothermal Ragone plot can be established to compare the performances of Technology A and Technology B. In addition to the three power levels (3 W, 15 W, and 30 W), other constant powers are applied to build the Ragone plot via a simulation: 5 W, 9 W, 10 W, 18 W, 20 W, 25 W, 28 W, and 40 W 90 W with steps of 10 W.
Figure (14) presents the available discharged energy density versus the power density for a large temperature range. This plot can be used as a design aid tool to select the optimal cell for a given application. For all operating temperatures, Technology A has obviously higher energy densities than Technology B when the power density is below 1200 W/kg. Technology B has higher energy densities when the power density exceeds this value. Therefore, Technology A is suitable for energy applications, whereas Technology B is suitable for power application. This conclusion is also described by the manufacturer and is the opposite of the behaviour observed in the experimental Ragone plots. Although Technology A demonstrates a better performance at all temperatures under low power levels, the performance of Technology B is better at 0 °C and -20 °C under high power. This is consistent with the behaviour under constant current discharge and high currents at -20 °C. Surprisingly, the energy density has a sharp decline under high power levels and 55 °C in both
1 2 3 4 5 6 7 8 9 10 11 12 13 14 15 16 17 18 19 20 21 22 23 24 25 26 27 28 29 30 31 32 33 34 35 36 37 38 39 40 41 42 43 44 45 46 47 48 49 50 51 52 53 54 55 56 57 58 59 60
technologies. This behaviour is owing to the safety conditions regarding the maximal temperature (75 °C). The batteries could not be fully discharged, which limits the available energy.
Fig. 14 Performance comparison of Technology A and Technology B based on Ragone plot model for 55 °C, 25 °C, 0 °C, and -20 °C
6. Conclusion
In this study, a non-isothermal Ragone plot is constructed based on experiments and simulations for a large operating temperature range (-20 °C, 0 °C, 25 °C, and 55 °C) under multiple power levels for two fresh Li-ion technologies with different chemistries (NMC/Graphite, NCA/Graphite). The experimental results indicate that the energy and power densities determined via a galvanostatic (constant current) discharge overestimate the performances of the Li-ion cell relative to the values in the conventional Ragone plot. However, based on the galvanostatic curves, the energy and power densities can be predicted based on a proposed electrical thermal model with a good accuracy. In this efficient and simple coupled model, the parameter identification can be directly performed by using the technical datasheets of both Li-ion chemistries. In a real ESS application, the power profile of the system can be predicted from the galvanostatic curves. Finally, a non-isothermal Ragone plot is constructed based on the proposed model. The simulation results exhibit that the operating conditions such as temperature, current or power level, and safety conditions strongly affect the performance of
1 2 3 4 5 6 7 8 9 10 11 12 13 14 15 16 17 18 19 20 21 22 23 24 25 26 27 28 29 30 31 32 33 34 35 36 37 38 39 40 41 42 43 44 45 46 47 48 49 50 51 52 53 54 55 56 57 58 59 60
Li-ion cells. Interestingly, the energy density can be enhanced at low temperatures under high power levels based on the significant self-heating of Li-ion cells.
Further studies need to focus on the experimental setup to apply a high-level constant power discharge to 18650 Li-ion cells to validate the simulated discharged energy. In addition, the determination of the heat transfer coefficient at low temperatures and high currents is an interesting point that could be explored in the future.
Acknowledgments
This study has been realized in the framework of the research project CELIA supported by the Institute of Technology Saint-Exupéry and funded by the French National Research Agency. The project partners are: Zodiac Aerospace, Safran Tech, Airbus, (industrial partners); and IMS-Bordeaux and LRCS-Amiens (academic laboratories). The authors would like to thank Matthieu Maures for providing the experimental data for the entropic potential determination.
1 2 3 4 5 6 7 8 9 10 11 12 13 14 15 16 17 18 19 20 21 22 23 24 25 26 27 28 29 30 31 32 33 34 35 36 37 38 39 40 41 42 43 44 45 46 47 48 49 50 51 52 53 54 55 56 57 58 59 60 References [1] Science, vol. 334, pp. 928 936, 2011.
[2] -ion battery based renewable energy solution for off-grid electricity: A
techno-Renewable and Sustainable Energy Reviews, vol. 72, no. February, pp. 922 934, 2017.
[3] A. Nikolian, J. Jaguemont, J. de Hoog, S. Goutam, N. Omar, P. Van Den Bossche, and J. Van Mierlo, -level lithium-ion electrical ECM model for different chemistries (NMC, LFP, LTO) and International Journal of Electrical Power and Energy Systems, vol. 98, pp. 133 146, 2018.
[4]
Applied Energy, vol. 137, pp. 511 536, 2015.
[5] Journal of
Physical Chemistry Letters, vol. 6, no. 18, pp. 3592 3593, 2015. [6]
battery charge storage Journal of Power Sources, vol. 210, pp. 286 291, 2012.
[7]
Lithium- Journal of the Electrochemical Society, vol. 165, no. 3, pp. 674 679, 2018.
[8]
Journal of Power Sources, vol. 168, no. 2, pp. 553 560, 2007.
[9]
Journal of Power Sources, vol. 63, no. 2, pp. 255 266, 1996.
[10] Journal of Power Sources, vol. 91, no. 2, pp.
210 216, 2000. [11]
Journal of The Electrochemical Society, vol. 154, no. 10, p. A949, 2007.
[12]
Behavior of a Lithium- Journal of The Electrochemical
1 2 3 4 5 6 7 8 9 10 11 12 13 14 15 16 17 18 19 20 21 22 23 24 25 26 27 28 29 30 31 32 33 34 35 36 37 38 39 40 41 42 43 44 45 46 47 48 49 50 51 52 53 54 55 56 57 58 59 60 [13] - Energy Conversion
and Management, vol. 88, pp. 199 205, 2014.
[14] I. S. Sarpal, A. Bensmann, J. Mähliß, D. Hennefeld, and R. Hanke- risation of
batteries with E
P-International Journal of Electrical Power and Energy Systems, vol. 99, no. January, pp. 722 732, 2018.
[15] al analysis on the performance of lithium based batteries for road
Applied Energy, vol. 136, pp. 921 930, 2014. [16] LG, Technical Information of LG 18650HG2 (3.0Ah), vol. 2. 2014.
[17] SAMSUNG, Introduction of INR18650 - 25R. 2013. [18]
Journal of Power Sources, vol. 196, no. 21, pp. 9081 9086, 2011.
[19] l issues about Li-ion batteries and recent progress in battery
Energy Conversion and Management, vol. 150, no. May, pp. 304 330, 2017.
[20] -ion batteries used in hybrid
Applied Energy, vol. 164, pp. 99 114, 2016.
[21] Y. Ji, Y. Zhang, and C.- - Journal of the
Electrochemical Society, vol. 160, no. 4, pp. A636 A649, 2013. [22] S. Günther, A. Bensmann, and R.
Hanke-Applied Energy, vol. 210, no. October 2017, pp. 127 137, 2018.
[23] parative study of equivalent circuit models for
Li-Journal of Power Sources, vol. 198, pp. 359 367, 2012.
[24] M. Ayadi, O. Briat, R. Lallemand, A. Eddahech, R. German, G. Coquery, and J. M. Vinassa, ce degradation rate during thermal cycling under constant Microelectronics Reliability, vol. 54, no. 9 10, pp. 1944 1948, 2014.
[25] -ion battery
mode Energy Conversion and Management,
vol. 180, no. October 2018, pp. 162 170, 2019.
[26] -thermal model of lithium-ion
batteries Proceeding of IEEE International Symposium on
Industrial Electronics (ISIE), Buzios (Brazil), 03-05 juin., 2015.
1 2 3 4 5 6 7 8 9 10 11 12 13 14 15 16 17 18 19 20 21 22 23 24 25 26 27 28 29 30 31 32 33 34 35 36 37 38 39 40 41 42 43 44 45 46 47 48 49 50 51 52 53 54 55 56 57 58 59 60
Proceedings of IEEE Vehicle Power and Propulsion Conference (VPPC), Seoul (Korea), 09-12 Oct., 2012.
[28] Y. Zhang, O. Briat, J. Deletage, C. Martin, G. Gager, and
J.-latest generation Li- Proceedings of the 43rd Annueal
Conference of the IEEE Industrial Electronics Society (IECON), Beijing (China), 29 Oct-01 Nov, 2017.
[29] -Electric-Vehicle
Lithium- IEEE Transactions on Vehicular Technology, vol. 65,
no. 1, pp. 1 14, 2016.
[30] -circuit voltage on temperature and
actual aging state of lithium- Journal of Power Sources, vol. 347, pp. 1 13, 2017.
[31] erature-compensated model for power Li-ion
batteries with dual-particle- Applied Energy, vol. 123, pp. 263 272,
2014.
[32] -optimal design of experiments applied
Energy, vol. 141, pp. 2108 2119, 2017. [33]
The British Psychological Society, pp. 265 282, 1992.
[34] -ion battery
Applied Energy, vol. 102, pp. 885 897, 2013.
[35] -speci fi c electrical characterization of high power batteries
Energy, vol. 112, pp. 294 306, 2016.
[36] W. B. - Journal of The
Electrochemical Society, vol. 147, no. 8, p. 2910, 2000.
[37] -ion battery pack for a
li Applied Energy, vol. 192, pp. 159 177, 2017.
[38] J. Jaguemont, N. Omar, M. Abdel- -charging
investigation on high-power and high-energy density pouch cells with 3D-thermal model d Applied Thermal Engineering, vol. 128, pp. 1282 1296, 2018.
[39]
-Journal of The Electrochemical Society, vol. 164, no. 12, pp. A2794 A2800, 2017.
1 2 3 4 5 6 7 8 9 10 11 12 13 14 15 16 17 18 19 20 21 22 23 24 25 26 27 28 29 30 31 32 33 34 35 36 37 38 39 40 41 42 43 44 45 46 47 48 49 50 51 52 53 54 55 56 57 58 59 60 [40] -power lithium-ion Energy, vol. 61, pp. 432 439, 2013. [41] -ion battery
Journal of Thermal Analysis and Calorimetry, vol. 116, no. 2, pp. 1001 1010, 2014.
[42] - Journal of
Power Sources, vol. 156, no. 2, pp. 541 546, 2006.
[43] -Based Estimation of Reversible Heat Generation in Lithium-Ion
Journal of the Electrochemical Society, vol. 161, no. 12, pp. A1794 A1800, 2014. [44]
voltage hysteresis in Li- Journal of Power Sources, vol. 395, no. February, pp. 179 184, 2018. [45]
cylindrical LiFePO4/graphite lithium- Journal of Power Sources, vol. 195, no. 9, pp. 2961
2968, 2010. [46]
Journal of Power Sources, vol. 157, no. 4, pp. 30 39, 2006. [47]
Temperature Rise Analysis for a Lithium-Ion Battery under the Conditions of Harbin City Bus Driving Energies, vol. 10, 2017.
[48] T. Wang, K. J. Tseng, J. -ion battery module with
different cell arrangement structures and forced air- Applied Energy, vol. 134, pp. 229 238, 2014.
![Fig. 1 Constant current discharge curves at 25 °C for multiple C rates of Technology A (left) [16] and B (right) [17]](https://thumb-eu.123doks.com/thumbv2/123doknet/14605365.731726/6.892.134.782.104.190/constant-current-discharge-curves-multiple-rates-technology-right.webp)