HAL Id: hal-01887065
https://hal.archives-ouvertes.fr/hal-01887065
Submitted on 3 Oct 2018
HAL is a multi-disciplinary open access
archive for the deposit and dissemination of
sci-entific research documents, whether they are
pub-lished or not. The documents may come from
teaching and research institutions in France or
abroad, or from public or private research centers.
L’archive ouverte pluridisciplinaire HAL, est
destinée au dépôt et à la diffusion de documents
scientifiques de niveau recherche, publiés ou non,
émanant des établissements d’enseignement et de
recherche français ou étrangers, des laboratoires
publics ou privés.
Software Greenability: A Case Study of Cloud-Based
Business Applications Provisioning
Hayri Acar, Hind Benfenatki, Jean-Patrick Gelas, Catarina Ferreira da Silva,
Gülfem Alptekin, Aïcha-Nabila Benharkat, Parisa Ghodous
To cite this version:
Hayri Acar, Hind Benfenatki, Jean-Patrick Gelas, Catarina Ferreira da Silva, Gülfem Alptekin, et al..
Software Greenability: A Case Study of Cloud-Based Business Applications Provisioning. CLOUD
2018 - IEEE 11th International Conference on Cloud Computing, Jul 2018, San Francisco, CA, United
States. pp.875-878, �10.1109/CLOUD.2018.00125�. �hal-01887065�
Software greenability: A case study of cloud-based
business applications provisioning
Hayri Acar
Univ Lyon, Université Claude Bernard Lyon 1 LIRIS UMR 5205 CNRS
69621 Villeurbanne Cedex, France [email protected]
Hind Benfenatki
University of Lyon, CNRS, INSA-Lyon LIRIS UMR5205 Lyon, France [email protected]
Jean-Patrick GELAS
ENS Lyon LIP, UMR 5668 69007 Lyon Cedex, France [email protected]Catarina Ferreira Da Silva
Univ Lyon, Université Claude Bernard Lyon 1 LIRIS UMR 5205 CNRS
69621 Villeurbanne Cedex, France
Gulfem I. ALPTEKIN
Galatasaray University Department of Computer EngineeringIstanbul, Turkey [email protected]
Aïcha-Nabila Benharkat
University of Lyon, CNRS, INSA-Lyon LIRIS UMR5205
Lyon, France
Parisa Ghodous
Univ Lyon, Université Claude Bernard Lyon 1 LIRIS UMR 5205 CNRS
69621 Villeurbanne Cedex, France [email protected]
Abstract—The emission of CO2 due to ICT (Information and Communication Technologies) is found as equivalent to aviation sector. Although the energy consumption in ICT is due both to hardware and software. In recent decade, the energy efficiency studies focus on the hardware part, especially with the development of cloud computing. Indeed, it is the software application that is responsible for executing tasks, that indirectly affects the hardware energy consumption. This work focus on software energy consumption. We introduce a methodology which evaluates and improves the software greenability by considering its energy consumption, performance and readability. Contrary to existing methodologies, we associate the effect of several components (CPU, memory, disk and network) when estimating software energy consumption instead of considering only the CPU as it is the case in literature. Moreover, the proposed framework can dynamically examine source code to integrate some measurement functionality. A Tool to Estimate Energy Consumption (TEEC) is implemented and its applicability is demonstrated on the case of cloud-based business application provisioning software, called MADONA. MADONA allows dy-namically generating service-oriented business applications by automatically composing business services and automatically deploying the generated applications on cloud environment.
Index Terms—Green IT, energy efficiency, cloud computing, use case, automatic business application provisioning
I. INTRODUCTION
Scientists have commonly stated that human activity is responsible for the increase of the earth's atmospheric tem-perature mainly due to the greenhouse gases generated by energy production. Consequently, the United Nations Climate Change Conference, COP 21 (Conference of the Parties), has
reasserted the aim of keeping the increase in temperature below 2◦C by the end of the century. Moving to cloud is said to be a way of preserving the environment, stated also by a study commissioned by Microsoft and conducted by Accenture and WSP Environment & Energy [1]. In fact, this allows reducing energy consumption and carbon emissions by 30% or more compared to running the same applications on their own infrastructure. For small organizations (up to 100 users), carbon emissions reduce by up to 90%. For large corporations, the reduction is about 30% or more. As an example, according to Microsoft, in a large consumer goods company, 32% of net carbon emissions could be avoided by moving 50,000 email users in North America and Europe to a cloud [1].
Cloud greenability is due to dynamic provisioning (i.e. better management of usage peak), multi-tenancy (i.e. shared infrastructure), server utilization (i.e. workload optimization) and datacenter efficiency (i.e. to minimize energy use for a given amount of computing power). Even if the cloud infrastructure has been studied in terms of offering green solutions, there is a lack of developing sustainable and green software applications on the cloud. To this end, we intro-duce TEEC (Tool to Estimate Energy Consumption), which improves the source code quality of software by estimating its power consumption. The estimation is based on mathematical equations that take into account the CPU, the memory, the disk and the network together, instead of considering only the CPU consumption. Moreover, TEEC examines the source code and locates the parts that consume the highest amount of energy.
These parts then may be analyzed and optimized by software developers for improving the energy consumption of the code, its performance and its readability. In this paper, TEEC is used to improve the source code quality of MADONA, which is a framework for provisioning business application on cloud environments. Hence, MADONA will allow to select and compose business and cloud services, configure and deploy generated cloud-based business applications in a more eco-friendly way.
The remaining part of the paper is organized as follows: Section 2 presents related works regarding energy consump-tion measurement methodologies. Secconsump-tion 3 briefly gives the main ideas of TEEC. Then, Section 4 describes the use case on which the efficiency of TEEC is evaluated. Sections 5 evaluates and discusses the findings, and Section 6 draws final conclusions.
II. RELATED WORK
In first studies of estimating the energy consumption, an online power calculator have been used. The energy con-sumption of each component (CPU, memory, disk, etc.) in a device was taken into account to approximately calculate global energy consumption of the device. This approach has helped, in particular, the game developers to build faster devices with better game performances. The disadvantage of these tools is the fact that it is not possible to estimate software energy consumption distinctively. Thus, researchers oriented their works to new methodologies in order to measure and/or estimate an application energy consumption with accuracy. This will both limit the negative impact of the software on environment and optimize the source code quality for customer satisfaction.
A. Hardware methodologies
In recent literature, hardware methodologies have been frequently proposed to measure software energy consumption. A hardware device, such as a power meter, is used to measure the global system energy consumption or several sensors are directly connected to the component to measure this compo-nent’s energy consumption. Thus, hardware methodologies can be grouped in two categories: Power meter-based, and sensor-based. Power meter performs current and voltages measures to directly calculate power consumption in Watts [2], [3]. This device also measures and logs different types of data, such as current, voltage, power usage, energy consumption, etc. These data are then stored on the device memory or sent to a computer. Then related curves in terms of time or graphical representations are generated. In the second group [4], [5], energy consuming components are listed in advance and one directly connects customized power sensors on them. Generally, high performance servers use this technique [4].
In general, hardware methodologies are found to be more accurate than the hybrid and software methodologies. How-ever, there are several important limitations. With hardware methodologies, it is not possible to measure the energy consumption of a particular process and virtual machines.
Moreover, the required devices may be expensive and they can also consume energy themselves.
B. Hybrid methodologies
The goal of hybrid methodologies is to combine accuracy of hardware methodologies and simplicity of software method-ologies [6]. Unfortunately, proposed tools use a hardware device to measure the total energy consumption and a soft-ware to manage the collected data. Hence, it is complicated to distinguish them. Moreover, adding several hardware can imply additional energy consumption, which can be more than the saved energy.
C. Software methodologies
Instead of direct measurement, software methodology in-volves mathematical formulae, which are determined for each component, with respect to its characteristics. Usually, sim-plifications and assumptions are adopted depending on the area of study. In the majority of proposed methodologies, only the CPU power consumption is taken into account, whereas the other components (memory, disk, network, etc.) are neglected. The lack of information can cause unsatisfactory and incorrect results. In a power measurement tool, accuracy and completeness are fundamental. In Table I, we summarize tools proposed to estimate software energy consumption. Each tool focuses on one component only, and neglects the others. There is a lack of a tool for the estimation of software power consumption taking into account several components (CPU, memory, disk, network) together. This is our motivation in this paper. We integrated this capacity in our methodology, even if the energy consumed by a component can be neglected in several situations. Among the proposed methodologies in literature, we have not encountered a study that examines the effects of source code on energy consumption. The most related ones propose a manual approach, which require in-tegrating several functions to the source code. However, the manual approach can be complicated, boring or expensive for developers. It requires that the developers be experts or co-work with experts. Thus, a tool allowing to dynamically locate the hotpoints during runtime of software would simplify the tasks of developers.
III. TEEC (TOOL TOESTIMATEENERGYCONSUMPTION) We developed TEEC (see Figure 1) (Tool to Estimate Energy Consumption) that operates both on Windows OS, and on GNU/Linux. TEEC allows estimating energy consumption of Java programs taking into account the CPU, memory, disk and network consumptions. Our prototype uses Sigar [12] Javassist [13] libraries, which allow to provide Java agents with the capability to load the content of classes at runtime in the JVM, and to modify a class file when the JVM loads it and/or define a new class at runtime, respectively.
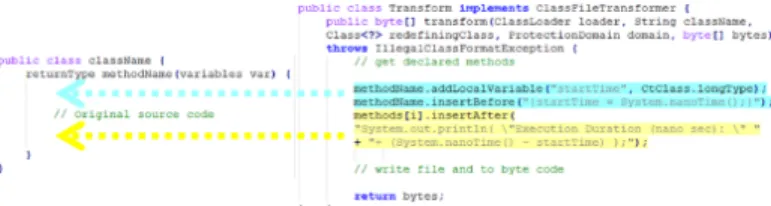
As illustrated in Figure 2, insertBefore and insertAfter Javassist methods allow to modify methods (methodName) in a class (className) by adding several lines of code at the beginning and/or at the end of these methods without
TABLE I
PROPOSED SOFTWARE TOOLS TO ESTIMATE THE POWER CONSUMPTION
Tools Component considered
Description Limits Intel Power
Gad-get [7]
CPU A software-based power usage monitoring tool en-abled for Intel Core processors. Monitor and estimate real-time processor package power information in Watts using the energy counters in the processor
Estimate the power consumption due to CPU only. It is not possible to estimate the power consumption of a specific process.
Orion [8] Network A power performance interconnection network sim-ulator that is able to provide power features, in ad-dition to performance features, to allow rapid power performance trade-offs at the architectural level
Dynamic power is formulated depending on the switching activity, the clock frequency, the switch capacitance and the supply voltage. Only a total network power consumption is estimated.
MIND [9] Disk A black box power model for RAID arrays. It is designed to quantitatively measure the power con-sumption of redundant disk arrays running different workloads in several execution modes. Five modes (idle, standby and several types of access) and four actions have been defined to precisely characterize power states and changes of RAID arrays
Energy consumption by four types of actions and power consumption in five types of modes are mod-elized depending on controller and disks. Only disk arrays power consumption are estimated.
CACTI-D [10] Memory It adds support for main memory DRAM chip or-ganization and support for modeling of commodity DRAM technology. It allows modeling of the com-plete memory hierarchy with consistent models all the way from SRAM based L1 caches through main memory DRAMs on DIMMs
Using benchmarks with large data sets architectural simulation is performed. The execution time results, power breakdown in the memory hierarchy and sys-tem energy delay product for the different syssys-tem configurations are presented. It is a tool limited to the modelization of the DRAM.
SPAN [11] CPU A two-level power model that estimates per core power dissipation on CMP (Chip Multi Processor) on the fly by using only one CMP and frequency information from CPUs. SPAN is a software power analyzer, which identify behavior of power associ-ated with software source code manually. Given an application, SPAN is able to determine its power dissipation rate at the function-block level
Only the energy consumed by CPU is considered. In this case, programmers need to use specific function manually (span-create(), span-open(), span-start(), span-stop(), etc.) to call the SPAN APIs. Not easy for developers. Simplicity and adaptability aspects are more emphasized than accuracy.
Fig. 1. TEEC
any change at the original source code. In our case, insert-Before and insertAfter methods are used to add a timer to calculate the execution time of the methodName, leading to the identification of source code hotpoints. In order to obtain accurate results, we take into account dynamic parameters while calculating power consumption. These parameters are obtained thanks to the pre-defined libraries and variable that are provided by the manufacturers. The power consumption of software can be separated in two parts:
- Static power represents the required power to maintain a running system. This is dependent on the quality of the device components.
- Dynamic power represents the required power to execute a task. It is dependent on clock frequency, voltage and quality of source code.
In this work, we are interested only in dynamic power
consumption. Now, let us represent the power model of each component.
Fig. 2. Source code manipulation
1. CPU
Power consumption of CPU is calculated as the multi-plication of frequency, square of voltage and a constant. We propose an equation (1) that is distinguished from others with its constant part:
PCP U = β · f · Vdd2 (1)
where β = CL.N.α is the constant, CL is the capaci-tance, N represents the number of gates and α < 1 is the average fraction of gates that commute at each cycle, f is the frequency and Vdd corresponds to voltage. In order
to obtain the power consumed by a specific process, we multiply (1) by the percentage of the process id, Nid
PCP U,id= PCP U· Nid (2)
2. Memory
The power of dynamic DRAM covers four states: acti-vate, precharge, read and write. Power consumption can then be expressed as (3):
PM emory= PActivate+ PP recharge+ PRead+ PW rite
(3) We multiply previous equation (3) by the usage percent-age Mid of the process id to obtain Eq. (4):
PM emory,id= PM emory· Mid (4)
3. Disk
While executing a sequence of requests, a disk can be in one of the four states: active, idle, standby and sleep. The dynamic disk power consumption is obtained when the disk is in active mode. Thus, we can deduce the following equation :
PDisk,dynamic= PActive= PRead+ PW rite
= PDiskRead RDiskRead · BRead+ PDiskW rite RDiskW rite · BW rite (5)
Where PDiskRead and PDiskW riteare, respectively, the
power consumption of disk read and write, RDiskRead
and RDiskW rite are the rate of disk read and write,
BRead and BW rite represents the bytes read and write
by the process at runtime. 4. Network
In this study, we assume that the network power con-sumption is related to the main activity of transmitting and receiving bytes. Thus, we establish the following equation:
PN etwork= PReceive+ PT ransmit
= PReadBytes· N etR + PT ransmitBytes· N etT
(6) where NetR is Network Received bytes, PReadBytes
represents the maximum power received, NetT is Net-work Transmit bytes and PT ransmitBytes corresponds
to the maximum power transmit. PReadBytes and
PT ransmitBytes are data obtained by the manufacturer
specifications.
IV. USE CASE
This section presents the use case to be evaluated. It consists of the prototype of a Method for AutomateD provi-sioning of clOud-based component-oriented busiNess Applica-tions (MADONA) [14]. MADONA allows automatic service-oriented development and deployment on cloud environment, where the user introduces her requirements through a Web form, and a business application is automatically generated, deployed and made available to the user.
We implemented MADONA as a web application. We chose the Grails framework [15], which allows the applications development following the Model, View, Controller (MVC) template.
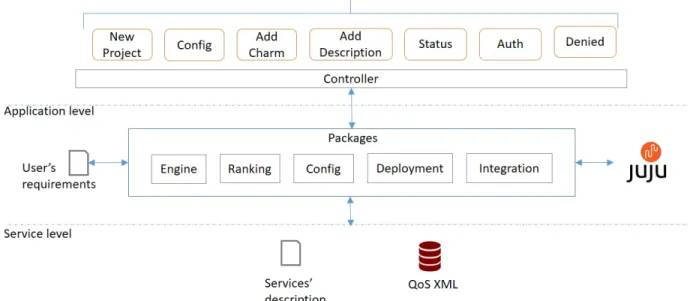
Figure 3 illustrates the prototype architecture of MADONA. Requirements elicitation, discovery of business services, inte-gration of new services into the marketplace, generation and rating of composition plans, and automatic deployment are implemented.
The prototype works as follows: from the user’s require-ments, several composition plans are generated and ranked. The plan with the highest QoS rating is selected. A script is generated and sent to the Juju [16] server for the deployment of this plan. We recall that some business services provide some configuration options (e.g., the name of the application). In this case, after selecting the composition plan to deploy, a new web page will open providing an interface to choose these options. A new script to configure the service is created and sent to the Juju server. Once the process is complete, the user is returned to the web page displaying the status of the generated application. The status of each service is analyzed to keep the user informed of the deployment status of its application. This status has two possible values "being deployed" or the link (IP address) to the application if the application is already deployed. An automatic refresh every thirty seconds of the web page allows the return and execution of a script for obtaining the status of deployed services. In the case where no service in the marketplace meets the functional needs of the user, the latter is directed to the "AddCharm" and "AddDescription" web interfaces that respectively allow the integration of new charms in the marketplace and to describe the service newly integrated. A charm is composed of scripts that simplify the deployment and management of a service [16].
MADONA is composed of three levels as follows: 1. The interface level (Level 1 of Figure 3) allows
commu-nication with the user. It is composed of controllers and views representing the MADONA Web interfaces. 2. The application level (Level 2 in Figure 3) enables
the generation and deployment of composition plans. It consists of Java classes, distributed over five packages (Engine, Ranking, Config, Deployment, Integration) as follows:
(a) Engine: this package is responsible for generating the composition plans based on the requirements of the user.
(b) Ranking: this package deals with calculating the QoS rating of a service and a composition plan.
(c) Config: this package contains the class "Composi-tionPlanConfig", which allows to generate the Juju configuration script of a business service from the configuration data entered by the user via the con-figuration Web form. The constructor of this class takes as input the name of the service to configure, its configurable parameters, as well as the configuration data to generate the configuration script, which will
Fig. 3. MADONA implemented architecture
be stored in the MADONA shell directory.
(d) Deployment: this package is responsible for deploy-ing the application corresponddeploy-ing to the selected composition plan. MADONA relies on the Juju Or-chestrator to manage the deployment, configuration, and composition of business services. It generates the deployment and configuration scripts, and runs them on the Juju server via Open-SSH.
(e) Integration enables the integration of new business services into the marketplace. We implemented five classes, which provide capabilities to integrate new services into the marketplace.
3. The service level (Level 3 in Figure 3) represents the marketplace of services. It consists of extended Linked USDL (Unified Service Description Language) descrip-tions of marketplace services, XML-formatted QoS files, and distributed business services’ packages. The Market-place elements are used when discovering, composing, scoring, configuring, and deploying services.
V. EVALUATION
We evaluate the green dimension of MADONA regarding the energy consumption, performance and readability aspects. A. Energy consumption
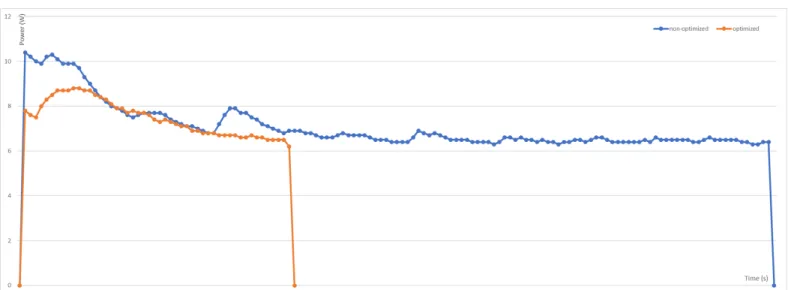
Energy consumption is evaluated following both software (using the proposed TEEC) and hardware (using a power meter) methodologies for comparison purposes. Figures 4 and 5 compare the variation of energy consumption of optimized and non-optimized MADONA source code with 10 users, who use MADONA sequentially using TEEC and a power meter,
respectively. In both figures, we can observe that optimized MADONA consumes less energy than the non-optimized one and it ends in less time, which is the reason why the curve’s peaks do not occur at the same time.
The total energy consumption while executing MADONA corresponds to the area of the curve representing the energy consumption as a function of time according to the formula E=P*T where E is the energy (Joules), P is the power (Watt) and T represents the time (Seconds). While executing MADONA with 10 users using respectively non-optimized and optimized codes, the energy consumption goes from 985,8 Joules for power meter and 968.484 Joules for TEEC to 373,5 Joules for power meter and 368,523 Joules for TEEC; thus saving 612.3 Joules (62% less).
In Figures 4 and 5, we note that the gain of average margin of error of TEEC compared to the power meter is equal to 1,76% for non-optimized MADONA and 1,33% for optimized MADONA.
B. Performance
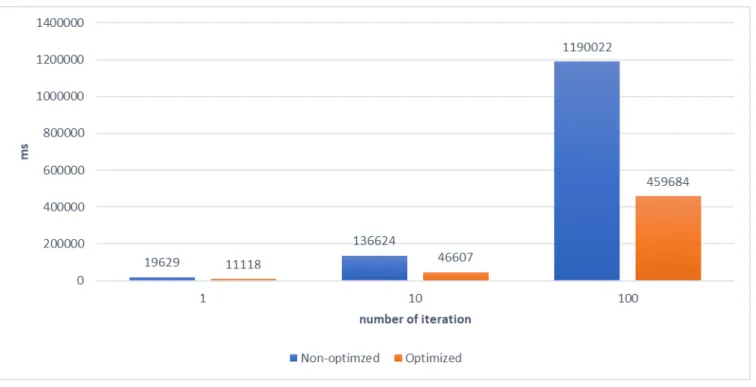
Source code quality improvement of MADONA implies reducing the execution time. Figure 6 illustrates the execution time of MADONA in respect to 1, 10 and 100 users. The figure shows that the time saving is significant allowing to save at least 34% of execution time. In fact, for one user, our tool allowed to save 56% of execution time; for 10 users, it allowed to save 34% of execution time; and for 100 users, it allowed to save 38% of execution time.
Table 2 illustrates several examples of used techniques, which allowed us to save execution time in some parts of
Fig. 4. TEEC: Optimized vs. non-optimized MADONA energy consumption
Fig. 5. Power Meter: Optimized vs. non-optimized MADONA energy consumption
source code. Here, the saved times are calculated for one user executing MADONA.
These positive results show us the importance to improve the source code quality to obtain efficient, sustainable and green software.
C. Readability
In a context that is more and more collaborative, readability of source code becomes essential. In fact, it allows analysts to review source code in a faster way, which implies an energy economy due to time saving. This is why we are considering the readability criterion in this work. We reduced MADONA source code from 3571 to 2134 lines (1437 less lines, which corresponds to 40% of reduction in code size). This has been done by eliminating non-used portions of code, and those allowing to display control messages used by developers.
VI. CONCLUSION
In this paper, we describe a methodology and a tool to evaluate software energy consumption and to improve software quality in respect to three dimensions: energy consumption, performance and source code readability. As the demonstra-tive example, we have evaluated a software for provisioning cloud business application, called MADONA. The evalua-tions demonstrate the accuracy and efficiency of TEEC. In fact, TEEC estimation error rate of energy consumption is lower than 2%, which is commonly acceptable. Moreover, MADONA execution time decreased from 145s to 140s for 10 executions, number of lines of source code decreased from about 3000 lines to 2000 lines. Moreover, non-optimized MADONA program consumes 5000 Joule, whereas the opti-mized one consumes 2000 Joule. This energy gains correspond approximately to the nonstop operating power of a computer during one year.
Fig. 6. Performance in terms of time TABLE II
DETAILS OF TIME CONSUMPTION OPTIMIZATION
Parts Saved time (ms) Remarks Composition plan
genera-tion
18 Variables allowing to read the files have been deleted. Some attributes were used only in one method, consequently we change them as a variable of the concerned method.
Composition plan ranking and selection
5855 Inside the loop, a default model was created and a file was opened with the format TTL (Turtle), whereas it is more efficient to do these tasks before beginning the loop in order to do only one model creation. We also avoid using the collection’s length in the declaration of the loop’s parameters in order to call the length method only one time (before the loop).
Generated application configuration and deployment
3524 SPARQL (SPARQL Protocol and RDF Query Language) have been improved in removing line break at the end of each line. Not used variables have been deleted. The same improvement regarding the declaration of the size of a loop. For reading/writing files, we replaced the methods used in the original code of MADONA by the new ones defined in Java 8, which are more optimized and more readable.
Fig. 7. Readability improvement
As future works, TEEC will integrate energy consumption measurements for physical resources in cloud environment. This will be done by defining a middleware, which communi-cates with public and private cloud APIs to collect
measure-ment data. APIs differ according to the cloud providers. We will then define translation rules for communication among these APIs.
REFERENCES
[1] Microsoft, Accenture and WSP Environment & Energy Study Shows Significant Energy and Carbon Emissions Reduction Potential from Cloud Computing, Nov. 4, 2010, https://newsroom.accenture.com/industries/systems-integration- technology/microsoft-accenture-and-wsp-environment-energy-study- shows-significant-energy-and-carbon-emissions-reduction-potential-from-cloud-computing.htm
[2] Feng, Wu Chun and Lin, Heshan, Proceedings of the 2010 IEEE Inter-national Symposium on Parallel and Distributed Processing, Workshops and Phd Forum, IPDPSW 2010, The green500 , 2010.
[3] Power efficiency in high performance computing, http://ieeexplore.ieee.org/lpdocs/epic03/wrapper.htm?arnumber=4536223, 2008.
[4] Giri, Ravi A. and Vanch, Anand, Increasing Data Center Efficiency with Server Power Measurements, https://www.intel.com/content/dam/doc/white-paper/intel-it-data-center-efficiency-server-power-paper.pdf, 2010.
[5] Aroca, Rafael Vidal and Gonçalves, Luiz Marcos Garcia, Journal of Parallel and Distributed Computing, Towards green data centers: A comparison of x86 and ARM architectures power efficiency, 2012. [6] Isci, C. and Martonosi, M., Proceedings of the Annual International
Symposium on Microarchitecture, MICRO, Runtime power monitoring in high-end processors: Methodology and empirical data, 2003. [7] Intel Power Gadget,
https://software.intel.com/en-us/articles/intel-power-gadget-20, 2016.
[8] Wang, Hang-sheng and Peh, Li-shiuan, Proceedings of IEEE Transactions on Very Large Scale Integration (VLSI) Systems, Orion 2.0: A power-area simulator for interconnection networks, 2012.
[9] 2011 International Green Computing Conference and Workshops, IGCC 2011, MIND: A black-box energy consumption model for disk arrays, 2011.
[10] Thoziyoor, Shyamkumar and Ahn, Jung Ho and Monchiero, Matteo and Brockman, Jay B. and Jouppi, Norman P., Proceedings - International Symposium on Computer Architecture, A comprehensive memory mod-eling tool and its application to the design and analysis of future memory hierarchies, 2008.
[11] Wang, Shinan and Chen, Hui and Shi, Weisong, Sustainable Computing: Informatics and Systems, SPAN: A software power analyzer for multicore computer systems, 2011.
[12] Javaagent, https://docs.oracle.com/javase/7/docs/api/java/lang/instrument/ package-summary.html
[13] Jboss-javassist, http://jboss-javassist.github.io/javassist/
[14] Hind Benfenatki, Catarina Ferreira Da Silva, Gavin Kemp, Aôrcha-Nabila Benharkat, Parisa Ghodous & Zakaria Maamar, MADONA: a method for automated provisioning of cloud-based componentoriented business applications, Service Oriented Computing and Applications, 11:1, 2017.
[15] Grails framework, https://grails.org/ [16] Juju, https://jujucharms.com/