HAL Id: tel-01053612
https://tel.archives-ouvertes.fr/tel-01053612
Submitted on 31 Jul 2014HAL is a multi-disciplinary open access archive for the deposit and dissemination of sci-entific research documents, whether they are pub-lished or not. The documents may come from teaching and research institutions in France or abroad, or from public or private research centers.
L’archive ouverte pluridisciplinaire HAL, est destinée au dépôt et à la diffusion de documents scientifiques de niveau recherche, publiés ou non, émanant des établissements d’enseignement et de recherche français ou étrangers, des laboratoires publics ou privés.
poro-thermoelastic framework
Murad S. Abuaisha
To cite this version:
Murad S. Abuaisha. Enhanced geothermal systems : permeability enhancement through hydraulic fracturing in a poro-thermoelastic framework. Other. Université de Grenoble, 2014. English. �NNT : 2014GRENI016�. �tel-01053612�
THÈSE
Pour obtenir le grade de
DOCTEUR DE L’UNIVERSITÉ DE GRENOBLE
Spécialité : Matériaux, Mécanique, Génie civil, ElectrochimieArrêté ministériel : 7 août 2006
Présentée par
Murad S. AbuAisha
Thèse dirigée par Benjamin Loretpréparée au sein du Laboratoire Sols, Solides, Structures –
Risques
dans l'École Doctorale : Ingénierie – Matériaux Mécanique
Énergétique Environnement Procédés Production
Géothermie profonde:
stimulation de la perméabilité
par fracturation hydraulique
dans un cadre
thermo-poroélastique
Thèse soutenue publiquement le 28 Avril 2014,devant le jury composé de :
Mr Leonhard Ganzer
Professor, Technische Universität Clausthal, Allemagne, Rapporteur,
Mr Dashnor Hoxha
Professeur, Université d’Orléans, Rapporteur,
Mr Thomas Kohl
Professor, Karlsruher Institut für Technologie, Allemagne,
Mr Benjamin Loret
The application of the Hydraulic Fracturing (HF) technology to exploit geothermal energy from Hot Dry Rocks (HDR) reservoirs is addressed. HF is achieved by ex-tensively pumping geothermal fluids to already existing fractured HDR reservoirs of low permeability. High fluid pressures are expected to drive cracks to evolve and connect. The newly created burgeoning hydraulic conduits should supposedly en-hance the permeability of the existing HDR reservoirs. The flow rate/pressure values at which geothermal fluids should be pumped, as well as the pumping schedule to initiate HF, depend primarily on the existing geostatic conditions (geostatic stresses, initial HDR pressure and temperature) as well as on HDR fracture properties (initial mean fracture length, mean fracture aperture, density and orientational distribution of fractures). While these components, in addition to their effects on borehole sta-bility, are scrutinized in this research, focus is on the evolution during circulation processes of the fracture properties.
A fracturing model that is capable of tracking fracture evolution in all possible spatial orientations is used to obtain the time course of the anisotropic permeability tensor. This evolving property is integrated into a domestic finite element code which is developed to solve thermo–poroelastic BVPs: emphasis is laid on the efficiency of the doublet flow technique where a fluid gains thermal energy by circulating through the HDR reservoir from the injection well to the production well.
The spurious oscillations in the hyperbolic solutions of the approximated finite ele-ment approach that are commensal with the phenomenon of forced heat convection are healed/mitigated through several stabilization approaches.
Ce travail concerne l’utilisation de la technique de Fracturation Hydraulique (FH) pour exploiter l’´energie g´eothermique des r´eservoirs profonds de roches s`eches chaudes (HDR). La fracturation hydraulique est r´ealis´ee par injection de fluides g´eothermiques dans des r´eservoirs partiellement fractur´es de faible perm´eabilit´e. Les fluides `a haute pression sont destin´es `a faire ´evoluer les fissures et leur connectivit´e. Les valeurs de d´ebit/pression auxquelles les fluides g´eothermiques doivent ˆetre pomp´es, ainsi que le calendrier de pompage pour initier la fracturation hydraulique, d´ependent prin-cipalement des conditions g´eostatiques existantes (contraintes g´eostatiques, pression fluide et temp´erature initiales de l’HDR) ainsi que des propri´et´es des fissures de l’HDR (longueur, ´epaisseur, densit´e et distribution directionnelle initiales moyennes de fissures). Tous ces ´el´ements, en sus de leurs effets sur la stabilit´e des forages, sont analys´es dans cette recherche.
Des mod`eles de fracturation, qui sont capables de suivre l’´evolution des fissures dans toutes les orientations spatiales possibles, sont utilis´es pour obtenir le tenseur anisotrope de perm´eabilit´e. Ces mod`eles sont int´egr´es dans un code domestique d’´el´ements finis qui est d´evelopp´e pour r´esoudre des probl`emes aux limites thermo-poro´elastiques.
Pour supprimer/diminuer les oscillations qui accompagnent les solutions paraboliques et/ou hyperboliques lors de la convection forc´ee, plusieurs techniques de stabilisation ont dˆu ˆetre impl´ement´ees.
This PhD research was financially supported by a CNRS fellowship for a period of three years. I would like to express my deep feelings of gratitude to the members in the INP-G and CNRS for facilitating my coming to France and pursuing my PhD research. I feel totally indebted to many members in the laboratory 3S-R, especially Professor Desrues Jacques, for fostering an outstanding research environment and for welcoming me in the laboratory. I can not be any more grateful to my supervisor Professor Benjamin Loret for his tireless efforts and quick responses to my calls for assistance. I am also thankful to Professors Kohl, Ganzer, Hoxha and Pl´e for coming from different far places and for accepting to be members in the jury of the defense.
For their friendship and day–to–day support, I am acknowledged to Khadija, Khaled, Mukhles, Jadalhaq, Wasim, Hanaa, Elie, Mahmoud, Mohammed, Hashem, Sinan,
Lek¨e, Mario, Hussain, Adel, Wael, Jamal, Dino, Benjamin, J´erˆome, R´emi, Wafa,
Widad and Denis. I apologize for those I could not remember, I thank them too.
I would like also to thank my parents and my brothers for their support, kindness and endless encouragement. Finally, I would like to acknowledge the thousands of
individuals who have coded for the LATEX project for free. It is due to their efforts
Contents
List of Figures ix
List of Tables xxi
Introduction 1
1 Geothermy and Enhanced Geothermal Systems (EGS): General view 5
1.1 Geothermal energy: Historical point of view . . . 5
1.2 Types of geothermal systems . . . 7
1.2.1 Conventional geothermal systems . . . 7
1.2.2 Enhanced geothermal systems . . . 7
1.3 Types of geothermal resources . . . 8
1.3.1 Vapor dominated systems . . . 9
1.3.2 Water dominated systems . . . 9
1.3.3 Sedimentary basins . . . 10
1.3.4 Geo–pressured resources . . . 11
1.3.5 Radiogenic resources . . . 11
1.3.6 Hot Dry Rock (HDR) resources . . . 12
1.3.7 Molten rock or magma resources . . . 13
1.4 Utilization of geothermal energy . . . 13
1.4.1 Electric power generation . . . 13
1.4.2 Direct utilization . . . 14 1.5 Environmental considerations . . . 15 1.5.1 Emissions . . . 15 1.5.2 Noise . . . 16 1.5.3 Water use . . . 16 1.5.4 Land use . . . 16
1.5.5 Impact on natural phenomena, wildlife and vegetation . . . 16
1.5.6 Induced seismicity . . . 17 iii
1.7 Relevant studies . . . 21
2 Equations for thermo–poroelasticity, fracture propagation and permeability evolution 31 2.1 The theory of fluid-saturated, porous, thermoelastic media . . . 31
2.1.1 Constitutive equations used in thermo–poroelasticity . . . 32
2.1.1.1 Mixture stress equation . . . 32
2.1.1.2 Change in mixture fluid content equation . . . 33
2.1.1.3 Darcy’s equation . . . 34
2.1.2 Field equations . . . 34
2.1.2.1 Equation of balance of momentum of the mixture . . . 35
2.1.2.2 Equation of balance of mass of the mixture . . . 35
2.1.2.3 Equation of balance of energy of the mixture . . . 36
2.1.2.4 The equation of stress diffusion . . . 37
2.1.3 Time scale of Thermo–poroelastic IBVPs . . . 37
2.2 Fracture mechanics and damage . . . 38
2.2.1 Fracture mechanics . . . 39
2.2.1.1 Linear Elastic Fracture Mechanics (LEFM) . . . 39
2.2.1.2 Elastic–plastic fracture mechanics (EPFM) . . . 41
2.2.2 Evolution of damage and damage tensor . . . 41
2.3 A Directionally Distributed Fracture Model (DDFM) to describe damage and permeability enhancement . . . 44
2.3.1 The DDFM for anisotropic damage . . . 45
2.3.2 A fracturing criterion for the DDFM . . . 47
2.3.3 The DDFM to estimate the permeability change . . . 51
2.3.4 Integration over a unit sphere . . . 54
2.4 Developing the DDFM by considering the change of crack aperture . . . 55
2.4.1 Barton’s hyperbolic closure model for crack aperture reduction . . . 56
2.4.2 Crack aperture increase due to shear slippage before the onset of the frac-turing criterion (crack slipping model) . . . 56
2.5 Application of the DDFM: Simulations and expectations . . . 58
2.5.1 Numerical simulations . . . 60
2.5.1.1 DDFM without considering crack aperture reduction: Applica-tion to Lac du Bonnet rock sample . . . 60
2.5.1.2 Modifying the DDFM to stand for the reduction of crack aperture 64 2.6 Validating the DDFM with aperture reduction using experimental data . . . 69
3 Finite element formulation for thermo–poroelastic IBVPs: Focus on fluid
compressibility 71
3.1 From mathematics to the finite element formulation . . . 71
3.2 Finite element method for thermo-poroelasticity . . . 75
3.2.1 The weak formulations . . . 75
3.2.1.1 The weak formulation of the balance of momentum of the mixture 75 3.2.1.2 The weak formulation of the balance of mass of the pore fluid . 76 3.2.1.3 The weak formulation of the balance of energy of the mixture . 77 3.2.2 Discretization and Galerkin’s method . . . 78
3.2.3 The matrix formulation of the semi-discrete equations . . . 79
3.2.3.1 The matrix formulation of the balance of momentum of the mixture 79 3.2.3.2 The matrix formulation of the balance of mass of the pore fluid 80 3.2.3.3 The matrix formulation of the balance of energy of the mixture 80 3.2.4 Time marching scheme for solving the equations: The predictor multi-corrector method . . . 82
3.3 Simulation of thermo-poroelasticity using ABAQUS . . . 87
3.3.1 Results obtained using ABAQUS . . . 89
3.3.2 Comparing the effect of heat transfer to the abrupt change caused by the sudden application of the surcharge σ0 . . . 94
3.3.3 Verifying the homogeneous parts of the numerical solution with the ana-lytical solution . . . 97
3.3.3.1 Verifying pore pressure increase due to the thermal loading only 97 3.3.3.2 Verifying the homogeneous field of the axial strain at the end of consolidation and heat transfer . . . 98
3.4 Validation of the Fortran 90 finite element code . . . 99
3.4.1 One–dimensional application . . . 99
3.4.2 Two–dimensional application . . . 102
3.4.2.1 Model description . . . 102
3.4.2.2 The analytical solutions of the BVP . . . 103
3.4.2.3 Calculations and results . . . 105
4 Simulations of heat extraction from natural and enhanced HDR reservoirs by hydraulic fracturing 107 4.1 Preliminary results: The natural geothermal reservoir of Soultz–Sous–Forˆets . . . 108
4.1.1 Material properties . . . 108
4.1.2 Geometry and FEM mesh . . . 109
4.1.3 Simulations and expectations . . . 111 v
4.1.3.2 Contours of mixture temperature and effective stresses . . . 112
4.2 An insight into the process of Hydraulic Fracturing (HF) . . . 117
4.2.1 Lost circulation . . . 117
4.2.2 Tensile failure in HF . . . 119
4.2.2.1 Initiation of fractures and breakdown of formation . . . 120
4.2.2.2 Fracture size and shape . . . 122
4.2.2.3 Thermal effects on hydraulic fracturing . . . 123
4.3 Development of the Hydraulic Fracturing Model (HFM) . . . 125
4.3.1 From continuum mechanics to fracture mechanics . . . 125
4.3.2 Testing and calibrating the HFM at a Gauss’ point . . . 128
4.3.2.1 ∆w is calculated using equation (4.27) . . . 129
4.3.2.2 ∆w is calculated using section (2.5.1.1) . . . 131
4.3.3 The role of the model parameter η . . . 133
4.4 Integrating the Hydraulic Fracturing Model (HFM) in the FEM . . . 136
4.4.1 Anisotropy and Voigt’s notation . . . 137
4.4.1.1 Hooke’s law for anisotropic plane strain linear elasticity . . . 138
4.4.1.2 Hooke’s law for anisotropic axisymmetric linear elasticity . . . . 138
4.4.2 Updating the Fortran 90 FE code for micro–scale anisotropy . . . 139
4.5 Hydraulic enhancement/stimulation: Geothermal reservoir of Soultz–Sous–Forˆets 142 4.6 Stresses around boreholes and borehole stability . . . 150
4.6.1 Stresses around boreholes: The hollow cylinder model . . . 150
4.6.2 Borehole shear failure criteria . . . 152
5 Designing HDR reservoirs: Impedance, efficiency, fracturing modes and life– time 157 5.1 Designing and modelling of a prototype HDR reservoir . . . 158
5.1.1 Well testing and hydraulic parameters . . . 158
5.1.1.1 Reservoir impedance . . . 158
5.1.1.2 Reservoir water loss . . . 160
5.1.2 Modelling approaches for HDR reservoirs . . . 161
5.1.2.1 Reservoir design parameters . . . 161
5.1.2.2 Exploitation of large scale hydraulic features . . . 162
5.2 Stimulation tests of Soultz–Sous–Forˆets HDR reservoir: Phase 1 injection test at GPK1 . . . 163
5.2.1 Phase 1 injection test at GPK1 well, 1993: Simulating the flow history . . 164
5.2.1.1 The transient BVP: Geometry, material properties and FEM mesh164
5.2.1.2 Time scales of the BVP to be stimulated . . . 168
5.2.1.3 Flow history at GPK1 well: Simulations and correlations . . . . 169
5.2.2 Phase 1 injection test at GPK1 well, 1993: Permeability enhancement of the reservoir . . . 171
5.2.2.1 The transient BVP: Geometry, material properties and FEM mesh171 5.2.2.2 Simulations of the HDR reservoir without HF . . . 172
5.2.2.3 Simulation of the HDR reservoir with HF . . . 175
5.3 Working fluids of geothermal systems: Characteristics and alternatives . . . 184
5.3.1 Thermophysical properties of water substance . . . 184
5.3.2 Dynamic viscosities of working fluids as a function of temperature and pressure . . . 186
5.3.3 Phase 1 injection test at GPK1 well, 1993: Permeability enhancement of the reservoir with viscosity–temperature change . . . 189
5.3.3.1 Deactivating HF process: Viscosity–temperature change is ac-counted for . . . 189
5.3.3.2 Activating HF process: Viscosity–temperature change is accounted for . . . 191
5.3.4 EGS using carbon dioxide (CO2) as working fluid . . . 195
5.3.4.1 Thermophysical properties of CO2 . . . 196
5.3.4.2 EGS reservoir heat extraction using CO2: Benefits and concerns 197 5.4 Improving the HFM to stand for shear sliding: Mode I and mode II fracturing model (HFM2) . . . 200
5.4.1 From continuum mechanics to fracture mechanics: HFM2 . . . 200
5.4.2 Testing and calibrating the HFM2 at a Gauss’ point . . . 203
5.4.3 Phase 1 injection test at GPK1 well, 1993: Permeability enhancement of the reservoir using HFM2 . . . 206
5.4.4 Beyond HFM and HFM2: Shear slippage under compressive stresses . . . 212
5.5 Chemical enhancement of geothermal reservoirs: A short review . . . 213
6 Phenomenon of forced heat convection in EGS: Stabilization methods 217 6.1 Mechanism of forced heat convection . . . 217
6.2 Presentation of the SUPG method: Mathematics and FEM formulation . . . 219
6.3 Presentation of the SGS/GSGS method . . . 221
6.3.1 The mathematics of the SGS/GSGS method . . . 222
6.3.2 The finite element formulation of the SGS/GSGS method . . . 225
6.3.3 First, second and third order gradients of the shape functions of the four– node bilinear quadrilateral elements (Q4) . . . 233
6.4.1 Phase 1 injection test at GPK1 well, 1993: Heat extraction simulations,
convection of heat is treated by the SGS method . . . 237
6.4.2 Phase 1 injection test at GPK1 well, 1993: Permeability enhancement by
HFM2, convection of heat is treated by the SGS method . . . 239
6.5 Beyond the SGS and the SUPG methods . . . 241
6.5.1 The Discontinuity Capturing Method (DCM) . . . 241
6.5.2 Phase 1 injection test at GPK1 well, 1993: Heat extraction simulations,
convection of heat is treated by the DCM method . . . 243
Reflections and perspectives 245
Appendices 249
A 251
A.1 Macroscopic free enthalpy of a fractured medium . . . 251
A.2 Derivation of the Directionally Distributed Fracture Model (DDFM) to describe
damage and permeability evolution: Equation (2.63) . . . 252
B 255
B.1 The effective fracture toughness in Hydraulic Fracturing (HF): HF in weak for-mations . . . 255
C 259
C.1 Sub–matrices of the weak formulation of therm–poroelasticity: Chapters (3) and
(6) . . . 260
References 263
List of Figures
1.1 Total worldwide geothermal capacity from 1975 up to end of 2007 (Bertani,[2007]). 6
1.2 Enhanced geothermal system 1:Reservoir 2:Pump house 3:Heat exchanger
4:Tur-bine hall 5:Production well 6:Injection well 7:Hot water to district heating 8:Porous
sediments 9:Observation well 10:Crystalline bedrock (Wikipedia EGS, 30/08/2011). 7
1.3 Vapor dominated geothermal system edited from (White et al., [1971]). . . 9
1.4 Hot water dominated geothermal system edited from (White et al., [1971]). . . . 10
1.5 Sedimentary basin geothermal resource edited from (Anderson and Lund, [1979]). 10
1.6 Geopressured geothermal system edited from (Bebout et al., [1978]). . . 11
1.7 Radiogenic geothermal system edited from (Anderson and Lund, [1979]). . . 11
1.8 Hot Dry Rock (HDR) exploitation edited from (Lund, [2007]). . . 12
1.9 Steam plant using a vapor or dry steam dominated geothermal resource edited
from (Lund, [2007]). . . 13 1.10 Flash steam plant using a water-dominated geothermal resource with a separator
to produce steam edited from (Lund, [2007]). . . 13
1.11 Binary power or organic Rankine cycle plant using a low temperature geothermal resource and a secondary fluid of a low boiling-point hydrocarbon edited from (Lund, [2007]). . . 14 1.12 Idealized view of heat extraction from a hot dry rock (left) with the mathematical
solution domain (right). . . 21 1.13 Side (a) and top (b) view of the system being modeled. The reservoir is assumed to
extend from the top to the bottom of the system. The vertical fracture intersects the entire reservoir and extends between the injection well on the left and the
production well on the right. . . 22
1.14 Fluid circulation in a geothermal reservoir. . . 24
1.15 Mesh used in simulation; SH, max represents maximum far field stress and Sh, min
is for minimum far field stress. Injection rate is Q. . . 27
is the minimum horizontal stress, and Sv is vertical stress. . . 28
1.17 Coordinate system for an inclined wellbore. . . 30
2.1 An edge crack of length a in a semi–infinite plate. . . 39
2.2 The three modes of fracturing. . . 41
2.3 The definition of the function f (r). . . 48
2.4 Cylindrical rock sample subjected to tensile dominated stresses left, and compres-sive dominated stresses right. . . 49
2.5 Vertical crack embedded in a cylindrical rock sample subjected to an arbitrary stress state, out–of–plane stress is equal to σ2. . . 49
2.6 The role of the coefficient λ in calculating the correct average crack aperture available for fluid flow. . . 53
2.7 Angular parametrization of a unit sphere Ω = Ω(θ ∈ [0, π], φ ∈ [0, 2π]). . . . 54
2.8 Penny-shaped crack with normal and shear stresses acting on it. . . 55
2.9 Sketch of Mohr-Coulomb criterion, the angle of the straight lines φ is “the angle of friction”. The apparent cohesion is the changing parameter for hardening. . . 57
2.10 Sketch for a crack section illustrating contraction and dilatancy due to both com-pliance and shearing. . . 58
2.11 Conceptualization of anisotropic permeability occurring on three orthogonal frac-ture planes. . . 59
2.12 Deformation stages and corresponding permeability change of a rock specimen tested in compression, (Souley et al., [2001]). . . 59
2.13 Hydrostatic and non-hydrostatic loadings of a cylindrical Lac du Bonnet rock sample. . . 61
2.14 The relation between the crack average aperture w and its average radius r. Scattered data are collected from five references. A power fitting curve, equation (2.92), with R2 = 0.67 is chosen to represent the data. . . . 62
2.15 Directional evolution of cracks radii for three values of deviatoric stress in a vertical cross–section and for a confining pressure of 10 MPa. . . 63
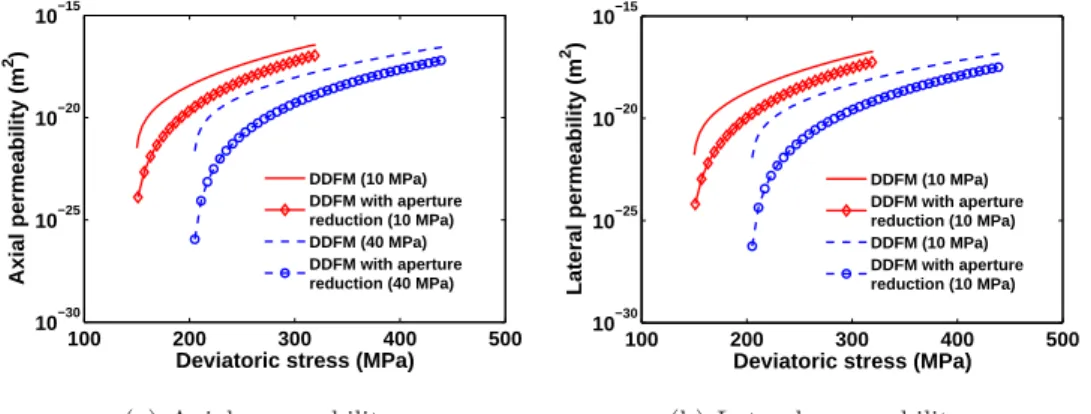
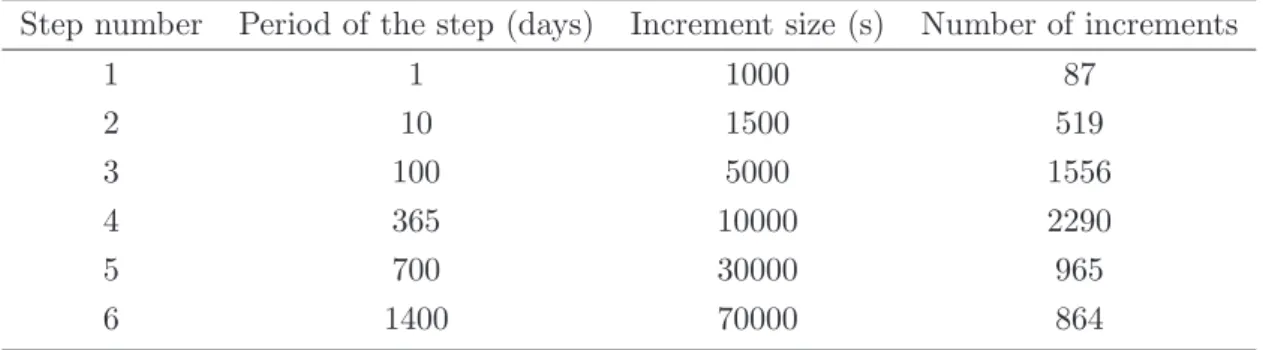
2.16 Variation of permeability in the axial and radial directions during two triaxial compression tests on Lac du Bonnet granite. . . 64
2.17 Variation of permeability in the axial and radial directions during triaxial com-pression tests on Lac du Bonnet granite with 4 confining pressure values. . . 64
2.18 Variation of normalized normal closure u/w0 and relative normalized compliance Cn versus normalized effective stress of cracks σ ′ n/σ ′ n0. . . 66 x
2.19 Directional distribution of the normal effective stress and Barton’s hyperbolic closure curve at a vertical cross–section and for a deviatoric stress ∆σ = −60 MPa and confining pressure of 10 MPa. Point A represents a vertical crack closed
by 90% due to the confining pressure (σ′n = −10 MPa at any time). Point B
represents a horizontal crack that will continue to close while adding the deviatoric
stresses (σ′n≥ −10 MPa at any time). . . . 67
2.20 Directional distribution of crack aperture for w0 = 15 µm and for a confining
pressure of 10 MPa. . . 68
2.21 Variation of permeability for confining pressures of 10 and 40 MPa with and
without considering the closure of cracks, kn0= 74 GPa. . . 68
2.22 Correlating the DDFM with aperture reduction with the experimental data given by (Souley et al., [2001]), Crc= 1.03 MPa√m. . . 69 2.23 Correlating the DDFM with aperture reduction with the experimental data given
by (Souley et al., [2001]), Crc= 1.26 MPa√m. . . 70
3.1 Shape functions for a four-node bilinear quadrilateral parent element (Q4). Nodal
points are labeled in ascending order in counter-clockwise direction. . . 79
3.2 Schematic diagram of the one-dimensional problem to be solved. . . 87
3.3 Temperature and pore pressure distributions within a one–dimensional element
subjected to temperature change from 100 to 0◦C and compressive load 10 MPa,
with subsequent heat and fluid dissipation through its upper surface only. . . 92
3.4 Vertical displacement distribution within a one-dimensional element subjected
to temperature change from 100 to 0 ◦C and compressive load 10 MPa, with
subsequent heat and fluid dissipation through its upper surface only. Note that u−20= 18.54 mm. . . 92
3.5 Pore pressure time profiles at (x2 = 10 m) without and with considering the
compressibility of pore fluid. . . 93
3.6 Pore pressure time profiles at (x2 = 10 m) without and with considering the
thermal expansion of pore fluid. . . 93
3.7 Vertical displacement time profiles at (x2 = 0 m). . . 93
been heated from zero to 100◦C without allowing any fluid seepage which has led the pore pressure to build up an initial value p−0. B- At time t = 0+, a load of 10 MPa is applied at the top of the column allowing it to consolidate while preventing
any heat dissipation through the surface x2 = 0 m. C- After consolidation is
totally done, zero temperature is imposed at the surface x2 = 0 allowing heat
transfer to take place and sample to consolidate again until temperature change
over all the column vanishes “D”. . . 95
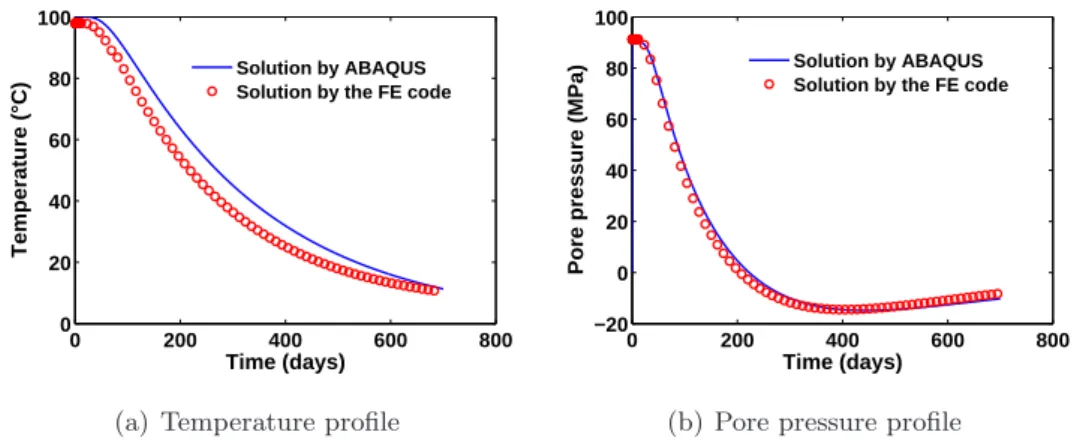
3.9 Pore pressure time profiles at (x2 = 10 m), fluid thermal expansion is neglected. . 95
3.10 Pore pressure time profiles at (x2 = 10 m), fluid thermal expansion is 4.2 × 10⁻⁴ 1/◦C. . . 96
3.11 Axial stress and strain time profiles at (x2 = 10 m), fluid thermal expansion and compressibility are 4.2 × 10⁻⁴ 1/◦C and 4.54 × 10⁻¹⁰ 1/Pa respectively. . . . 96
3.12 Time scheme used in the domestic FE code to solve the thermo–poroelastic IB-VPs. First time step starts at second 1 and continues to increase logarithmically till a specific maximum value. After the maximum value is reached, time steps are to increase linearly by a slope equal to the maximum value. . . 101
3.13 Vertical displacement time profile at (x2 = 0 m), comparison between numerical response of the FE code and ABAQUS simulation. . . 101
3.14 Temperature and pore pressure time profiles at (x2 = 10 m), comparison between numerical response of the FE code and ABAQUS simulation. . . 102
3.15 Cylindrical hole in an infinite fluid saturated porous rock formation. . . 102
3.16 Spatial discretization of the model geometry. . . 103
3.17 Temperature distribution along the radial direction. . . 105
3.18 Pore pressure distribution along the radial direction. . . 106
4.1 Modeling of the geothermal reservoir at Soultz–Sous–Forˆets, figure is not to scale. 108 4.2 Initial conditions and geometric layout of a fractured zone at Soultz–Sous–Forˆets. 109 4.3 Modeling of a circulation test at Soultz–Sous–Forˆets. Figure is not to scale. . . . 110
4.4 Scaled fluid velocity vectors for a steady state of injection pressure p0 + 1 MPa at well GPK1 and extraction pressure p0 − 1 MPa at GPK2. The velocity field is not homogeneous at the neighbors of the wells, however, the average velocity of the formation fluid is about ||v|| = vx= 9.46 × 10⁻⁷ m/s since vy ≈ 0. . . 111
4.5 Temperature and pore pressure profiles at y = 0 m. Hydraulic diffusion is very fast, meanwhile, heat front propagates faster, as expected, when convection of heat is accounted for. . . 112
4.6 Contours of the mixture temperature at two times when convection of heat is considered in the simulations. . . 112
4.7 Contours of longitudinal effective stress σx′ at two times when convection of heat
is considered in the simulations. . . 113
4.8 Contours of longitudinal effective stress σx′ at two times when convection of heat
is NOT considered in the simulations. . . 114
4.9 Contours of transversal effective stress σ′
y at two times when convection of heat
is considered in the simulations. . . 114
4.10 Contours of transversal effective stress σy′ at two times when convection of heat
is NOT considered in the simulations. . . 115
4.11 Contours of out–of–plane effective stress σz′ at two times when convection of heat
is considered in the simulations. . . 115
4.12 Contours of out–of–plane effective stress σz′ at two times when convection of heat
is NOT considered in the simulations. . . 116
4.13 Vertical fracture around a vertical well. Two symmetric fracture wings develop perpendicularly to the direction of least principal stress. . . 117 4.14 A schematic graph summarizing the process of extracting natural gas by using
the technique of HF, reproduced from wikipedia. . . 118
4.15 Hydraulic fracturing of a porous and permeable rock, (Fjaer et al., [2008]). . . . 119
4.16 Vertical wellbore with vertical cracks. Wellbore wall can/can not be aligned with a mud cake. . . 120 4.17 Borehole pressure response during hydraulic fracturing of a vertical borehole, two
pressure cycles are defined. Figure is not to scale. . . 121
4.18 Illustration of the fracture shape for the KGD model. . . 122
4.19 Mohr circles and failure line: the effect of increasing pore pressure and decreasing temperature on HF. . . 125 4.20 Vertical borehole with vertical fracture of average radius r and arbitrary direction
n. . . 125 4.21 parallelepiped sample of Lac du Bonnet granite subjected to the stress state shown
and drilled at the middle where fluid is pumped, out of plane stress is equal to -10 MPa. . . 128 4.22 Variation of permeability in the axial and lateral directions during pumping water
in a parallelepiped Lac du Bonnet granite sample with a stress state as shown
in figure (4.21). ∆w is calculated using equation (4.27). As the rock sample
resembles a single point, the pumping pressure pw is equal to the pore pressure. . 130
water in a parallelepiped Lac du Bonnet granite sample with a stress state as shown in figure (4.21), ∆w is calculated using section (2.5.1.1). (b) Variation of
the ratio k11/k33 with the pumping/pore pressure. . . 131
4.24 Directional evolution of cracks radii at point C, pw = 24 MPa. . . 131
4.25 Directional evolution of cracks radii at point B, pw= 47 MPa. . . 132
4.26 Directional variation of normal effective stress (σ′ n= n.σ ′ .n) at point B, pw= 47 MPa. . . 133
4.27 Study of the model parameter η effects on crack propagation and stability of crack growth. . . 134
4.28 Effect of the model parameter η on the HF pressure, equation (4.34). Parameters values are used as in Table (4.2). . . 135
4.29 Variation of permeability in the axial and lateral directions during pumping water in a parallelepiped Lac du Bonnet granite sample with a stress state as shown in figure (4.21) and for different values of the model parameter η. . . 136
4.30 Schematic diagram which represents integrating the HFM into the FEM. . . 139
4.31 Modeling of HF process at Soultz–Sous–Forˆets. Figure is not to scale. . . 143
4.32 Contours of the mixture temperature at two times with/without HF. . . 144
4.33 Scaled fluid velocity vectors without HF at year 1. . . 144
4.34 Scaled fluid velocity vectors with HF at year 1. . . 145
4.35 Contours of the formation pressure at two times with/without HF. . . 145
4.36 Contours of longitudinal effective stress σ′ x at two times with/without HF. . . 146
4.37 Contours of transversal effective stress σy′ at two times with/without HF. . . 147
4.38 Contours of longitudinal permeability component kx at different times during HF process. . . 148
4.39 Contours of the ratio ky/kx at two times during HF process. . . 149
4.40 Section of the hollow cylinder model, pw is the borehole pressure and pf is the formation pore pressure. In the presence of a mud cake pf(R+w) 6= pw, meanwhile if well and formation fluids are fully connected pf(R+w) = pf(R−w) = pw (rigorous assumption). . . 150
4.41 Stresses around a borehole in linear elastic formation, compressive stresses are negative. σr is always compressive, meanwhile σθ could be compressive or tensile depending on pw. . . 151
4.42 Sketch of Mohr-Coulomb criterion, equation (4.53), the angle of the straight line φ is “the angle of friction”. C0 is the uniaxial compressive strength of the material. The angle β represents the orientation of failure plane. . . 153
5.1 Schematic diagram of HDR power generating system, (Murphy et al., [1999]). . . 159
5.2 Schematic representation of an HDR reservoir design, based on the exploitation
of isolated large scale conductive fractured zones. . . 163
5.3 Summary of microseismic event locations from the 1993 phase 1 stimulation test,
(Bruel, [1995]). . . 164
5.4 Geometric layout of the fractured zone to be stimulated at the HDR reservoir of
Soultz–Sous–Forˆets. GPK2 is drilled in the direction of fracture evolution. Only
quarter of the problem is to be studied due to symmetry. . . 165
5.5 Modeling of the phase 1 injection test at Soultz–Sous–Forˆets: simulating the flow
logging at GPK1, figure is not to scale. . . 165
5.6 Applied flow history at GPK1 during the 1993 phase 1 injection test at Soultz–
Sous–Forˆets. . . 170
5.7 Injection pressure at GPK1 during the 1993 phase 1 injection test at Soultz–
Sous–Forˆets. Comparison between experimental data and the numerical response of our HFM for schemes shown in Table (5.5). . . 170
5.8 Modeling of the phase 1 injection test at Soultz–Sous–Forˆets: permeability
en-hancement of the reservoir. All boundary and initial conditions are shown on the graph, figure is not to scale. . . 171
5.9 Contours of the mixture temperature at two times, convection of heat is accounted
for. . . 172 5.10 Scaled fluid velocity vectors for the defined injection state at well GPK1 and
extraction pressure of p0−1 MPa at GPK2. The velocity field is not homogeneous
at the neighbors of the wells. However, the average velocity of the formation fluid is about ||v|| = 5.57 × 10⁻⁶ m/s. . . 172 5.11 Contours of the mixture pore pressure at two times, convection of heat is
ac-counted for. . . 173
5.12 Contours of longitudinal effective stress σx′ at two times, convection of heat is
accounted for. . . 173
5.13 Contours of transversal effective stress σ′y at two times, convection of heat is
accounted for. . . 174 5.14 Relation between injected pore fluid pressure and the magnitude of created fluid
flux at the injection well GPK1 of unenhanced HDR reservoir at Soultz–Sous–Forˆets.175
5.15 Impedance profile of unenhanced HDR reservoir at Soultz–Sous–Forˆets. . . 175
5.16 (a) The contour of longitudinal permeability component kx at year 1, (b) The
projection of kx contour in x − y plane. . . 176 xv
accounted for. . . 176 5.18 Scaled fluid velocity vectors for the defined injection state at well GPK1 and
extraction pressure of p0− 1 MPa at GPK2 when activating HF. The velocity
field is not homogeneous at the neighbors of the wells, the average velocity of the
formation fluid in the zone of active HF is ||v|| = 2.75 × 10⁻⁵ m/s while in the
other zones it is about ||v|| = 6.20 × 10⁻⁶ m/s. . . 177 5.19 Contours of the mixture pore pressure at two times with HF, convection of heat
is accounted for. . . 177
5.20 Contours of longitudinal effective stress σx′ at two times with HF, convection of
heat is accounted for. . . 178
5.21 Contours of transversal effective stress σ′y at two times with HF, convection of
heat is accounted for. . . 178 5.22 Relation between injected pore fluid pressure and the magnitude of created fluid
flux at the injection well GPK1. Non–linear relation is clear while HF process is
active announcing the creation of improved connections, (Bruel, [1995]). . . 179
5.23 Longitudinal permeability kx history at the injection well GPK1. Points M and
N correspond to the period of intense permeability enhancement in figure (5.22).
Intense permeability enhancement happens earlier than in the flow–injection log-ging, figure (5.22). . . 180
5.24 Impedance profile of the enhanced HDR reservoir at Soultz–Sous–Forˆets. . . 180
5.25 (a) Profiles of produced fluid temperature with HF (Thf) and without HF (Twhf).
(b) Profile of the ratio Twhf/Thf (temperatures are measured in ◦C). . . 181
5.26 Thermal drawdown, equation (5.1), of the mean production temperature for the
enhanced HDR reservoir curve B, and the standard production temperature as suggested by (Kolditz, [1995]) curve C. . . 181
5.27 (a) Profiles of produced flow rate with HF (Qhf) and without HF (Qwhf). (b)
Profile of the ratio Qwhf/Qhf. . . 182
5.28 (a) The contour of transversal permeability component ky at year 1. (b) The
projection of kx/ky contour in x − y plane at year 1. . . 182 5.29 θ–φ position of a crack of radius r(n). . . 183
5.30 Directional evolution of fracture radii at points A and D at year 1 (the end of HF).183
5.31 Directional evolution of fracture radii at points B and C at year 1 (the end of HF).184
5.32 Phase diagram of water substance at different temperature and pressure values. . 185
5.33 Correlation between the experimental record of the water substance shown in Table (5.6) and the analytical expression of (Burger et al., [1985]). . . 187
5.34 Brine viscosity as a function of temperature while pressure and NaCl mass fraction are held constant to 1.5 MPa and 0.225 kgNaCl/kgSolution respectively. Solid line represents the fitting curve of the scattered data with determination coefficient of R2= 0.9957. . . 188 5.35 Percent of viscosity increase as result of using sodium chloride NaCl in a
concen-tration of 0.225 kgNaCl/kgH2O, fluid pressure is held at 1.5 MPa. . . 189
5.36 Pore pressure profiles at the plane y = 0 m, for the times of 1 and 15 years. Solid lines account for the simulation when viscosity is updated with temperature,
meanwhile dashed lines represent the case of constant brine viscosity µb= 3×10⁻⁴
Pa.s. . . 190 5.37 Relation between injected pore fluid pressure and the magnitude of created fluid
flux at the injection well GPK1, viscosity–temperature change is accounted for. . 190
5.38 Impedance profile of unenhanced HDR reservoir at Soultz–Sous–Forˆets, viscosity– temperature change is accounted for. . . 191 5.39 Contours of the mixture temperature at two times, convection of heat and viscosity–
temperature change are accounted for. . . 191
5.40 Contours of longitudinal permeability component kx at two times, viscosity–
temperature change is accounted for. . . 192
5.41 Projection of kxcontour in the x−y plane at year 5, viscosity–temperature change
is accounted for. Injection pressure schedule shown in figure (5.8) is active till year 5. . . 192 5.42 Contours of the mixture temperature at two times with HF, convection of heat
and viscosity-temperature change are accounted for. . . 193
5.43 Contours of the mixture pore pressure at two times with HF, convection of heat
and viscosity-temperature change are accounted for. . . 193
5.44 Relation between injected pore fluid pressure and the magnitude of created fluid
flux at the injection well GPK1, viscosity–temperature change is accounted for. . 194
5.45 Impedance profile of enhanced HDR reservoir at Soultz–Sous–Forˆets, viscosity– temperature change is accounted for. . . 194
5.46 Profiles of produced fluid temperature with active HF (Thf(µ)) and without active
HF (Twhf(µ)), convection of heat and viscosity-temperature change are accounted
for. . . 195
5.47 Phase diagram of carbon dioxide (CO2). Dashed lines are only drawn to identify
regions with different customary naming conventions. They do not signify phase transitions, as all fluid properties vary smoothly and continuously across these lines, (Pruess, [2006]). . . 197
et al., [2005]). . . 198
5.49 Shear slippage of inclined fractures, wing fracture evolution. . . 200
5.50 Vertical borehole with vertical fracture of average radius r and arbitrary direction n. . . 201 5.51 parallelepiped sample of Lac du Bonnet granite subjected to the stress state shown
and drilled at the middle where fluid is pumped, out of plane stress is equal to -10 MPa. . . 203 5.52 (a) Variation of permeability in the axial and lateral directions while pumping
water in a parallelepiped Lac du Bonnet granite sample with a stress state as shown in figure (5.51). (b) The variation of the ratio k11/k33 with the formation
pressure. Dashed lines describe the simulations of HFM of section (4.3),
mean-while solid lines represent the simulations of the HFM2 discussed above. Colored curves are provided in the digital version. . . 204
5.53 Directional evolution of crack radius at pw = 24 MPa and at the plane φ = 90◦.
The curve with the dashed line represent the simulations using HFM of section
(4.3), meanwhile the curve with solid line describe the simulations using HFM2
discussed above. . . 204 5.54 Effect of using HFM2 instead of HFM on the order of magnitude for rock
per-meability. This curve is directly obtained from figure (5.52(a)) by calculating the ratios k11,HFM/k11,HFM2 and k33,HFM/k33,HFM2. . . 205
5.55 Enhanced longitudinal permeability component kx depicted as the projection of
its contour in the x−y plane. Fracture propagation is in the direction of maximum far field stress. Injection pressure schedule, described in figure (5.8), is sufficient
to entirely enhance the HDR reservoir in the longitudinal direction. . . 206
5.56 Contours of the mixture temperature at two times with HF by applying HFM2, convection of heat is accounted for. . . 207 5.57 Contours of the mixture pore pressure at two times with HF by applying HFM2,
convection of heat is accounted for. . . 208 5.58 Contours of longitudinal and transversal effective stresses after 10 years of HF by
applying HFM2, convection of heat is accounted for. . . 208
5.59 Longitudinal permeability kx history at the injection well: Comparison between
the simulations using HFM or HFM2. . . 209
5.60 (a) Relation between injected pore fluid pressure and the magnitude of created fluid flux at the injection well GPK1 by HFM2. (b) Impedance profile of the
enhanced HDR reservoir at Soultz–Sous–Forˆets by HFM2. . . 210
5.61 Comparison between the time profiles of produced (a) temperatures (b) flow rates
for HFM and HFM2. . . 210
6.1 Diffusion leads ultimately to a spatially uniform repartition of the solute particles. In a stream, the solute particles with turtle velocity are convected by the flow: their velocity is that of the flow. . . 218
6.2 Dimensionless stabilizing parameters (a): t00 and (b): t11 stemming from one–
dimensional nodal exactness of (Hauke et al., [2007]). . . 224
6.3 Shape functions for a four-node bilinear quadrilateral reference element. Nodal
points are labeled in ascending order in counter-clockwise direction. . . 234
6.4 Temperature and pore pressure profiles along the line of symmetry y = 0 m: (a)
Heat convection oscillations near the injection well are well stabilized when the SGS method is applied. (b) Pore fluid pressure profiles are not affected by the SGS method since hydraulic diffusion is very fast. . . 238
6.5 Temperature profiles along the line of symmetry y = 0 m: (a) Heat convection
oscillations are mitigated at the production well but far from being healed. (b) The capacity of the SGS method is lost; SUPG and SGS methods are almost the same. . . 238
6.6 Contours of the mixture temperature at different times with HF by applying
HFM2, convection of heat is treated by the SGS method. . . 239
6.7 Enhanced longitudinal permeability component kx depicted as the projection of
its contour in the x−y plane. Fracture propagation is in the direction of maximum far field stress. Injection pressure schedule, described in figure (5.8), is sufficient
to entirely enhance the HDR reservoir in the longitudinal direction. . . 240
6.8 Longitudinal permeability kx history at the injection well; comparison between
the simulations when implementing the SGS method (solid lines) and the SUPG method (dashed lines). . . 240
6.9 Temperature profiles along the line of symmetry y = 0 m. DCM is capable of
treating the most stubborn numerical noises at the production well where both
the SGS and SUPG methods were proven inefficient. . . 243
B.1 Representation of the elasto–plastic fracturing process of rocks. . . 256
List of Tables
1.1 Geothermal Resource Types (White and Williams, [1975]). . . 9
1.2 Comparison of emitted gases (kg/MWh) between a coal-fired plant and a
geother-mal power plant (Lund, [2007]). . . 15
2.1 Parameters used in the simulations of DDFM on Lac du Bonnet granite, (Shao
et al., [2005]). . . 61
2.2 Average crack radii and apertures relation. . . 62
3.1 Time discretization considered to simulate the 1-dimensional problem by ABAQUS. 91
3.2 Properties of the sample material “Typically rock”. . . 91
3.3 Pore pressure (uniform) and vertical displacement (at x2 = 0) initially built up
as result of pre–heating the column from 0 to 100◦C. . . 92
3.4 Comparison between the effect of heat transfer to the effect of consolidation. . . 97
3.5 Properties of the sample material “Typically rock”. . . 100
3.6 Thermal parameters for the fluid and the solid phases. . . 104
3.7 Poroelastic parameters for the fluid saturated porous medium. . . 105
4.1 Material properties of Soultz–Sous–Forˆets reservoir, (Evans et al., [2009]). *The
permeability value is used as in (Taron and Elsworth, [2009]). . . 109
4.2 Parameters used in testing the HF model (HFM). References: 1.(Shao et al., [2005])
and 2.(Atkinson, [1991], p. 245). . . 128
4.3 Parameters used in the application of HFM. References: 1.(Shao et al., [2005]),
2.(Atkinson, [1991], p. 245), 3.(Evans et al., [2009]) and 4.(Taron and Elsworth, [2009]). . . 142
5.1 Key reservoir design parameters, (Jupe et al., [1995]). . . 162
5.2 Boundary conditions used for the stimulation test at Soultz–Sous–Forˆets. l=left,
r=right, o=outer, and i=inner boundaries of figure (5.5). . . 166
5.3 Material properties of Soultz–Sous–Forˆets reservoir. . . 166
2.(Atkinson, [1991], p. 245), 3.(Evans et al., [2009]) and 4.(Bruel, [1995]). . . 167
5.5 Simulation schemes of the HF process at GPK1 for phase 1 injection test. . . 169
5.6 Dynamic viscosity of water substance (1 cP(centipoise)= 10−3 Pa.s). . . . 186
5.7 Applicability range of various models for calculating brine viscosity, (Francke and
Thorade, [2010]). . . 187
Introduction
Objective, method and scope
The objective of this research is to develop an environment that describes permeability en-hancement of geothermal systems in a Thermo–Hydro–Mechanical (THM) framework. The developed environment is to include mechanical ingredients, i.e. fracturing models, to describe Hydraulic Fracturing (HF), and a computational aspect to implement the HF process in thermo– poroelasticity.
A great deal of time is spent in studying thermo–poroelasticity on the mathematical and the finite element levels. The contribution from the available literature is highly valued and investi-gated. A domestic Fortran 90 finite element code is developed to simulate thermo–poroelasticity in single–porosity media subjected to temperature changes. Fracture and damage mechanics are employed to develop and modify fracturing models to describe HF. The fracturing models are integrated into our finite element code to study HF in a thermo–poroelastic framework.
Validation of the fracturing models is accounted for. Several stimulation and/or circulation tests at the geothermal reservoir of Soultz–Sous–Forˆets are finally presented.
Strategy of the PhD research
Geothermal geomechanics and its applications on the Enhanced Geothermal Systems (EGS) is presented. Under the framework of thermodynamics, the mechanics of porous media subjected to thermal changes is precisely studied. The field equations attributed to thermo–poroelasticity with full coupling between the mechanical, the fluid diffusive and the thermal diffusive effects are presented. A full mathematical model to describe fluid-temperature transports in single– porosity deformable fractured zones is hence developed.
Using the Finite Element Method (FEM), this mathematical model was discretized in the space and time to get the matrix formulation that can be coded for to solve the thermo-poroelastic Transient Boundary Value Problems (TBVPs).
metric thermo-poroelastic TBVPs is developed. The FE code is used to simulate the thermal recovery from large–scale geothermal systems lying deep in the ground.
To enhance the performance and/or the efficiency of these geothermal systems, the process of HF is studied thoroughly. HF is achieved by extensively pumping geothermal fluids to already existing geothermal reservoirs of low permeability. High fluid pressures will drive cracks to evolve and connect, the new created burgeoning hydraulic conduits will supposedly enhance the permeability of the existing reservoir and hence the efficiency of heat extraction process.
To numerically simulate the process of HF, fracture and damage mechanics are employed to develop fracturing models capable of describing the directional fracture evolution. These fracturing models are tested against experimental data to ensure good results before applying them in the research.
The fracturing models are working following this scheme: a criterion to decide whether frac-turing and hence damage, at the scale of Gauss’ points and in any direction, takes place or not and a rule that provides the incremental length of the crack are presented. Knowing the new fracture radius, the change in fracture aperture is estimated based on analytical estimations and/or experimental data which relate aperture change to change of fracture radius. Using the new fracture aperture along with the fracture radius, the local velocity field is calculated by implementing Navier–Stokes equation for laminar flow between two parallel plates. The macro-scopic velocity field is deduced by the directional averaging (sort of a homogenization approach) over the local velocities. A macroscopic anisotropic permeability tensor, that accurately de-scribes the hydraulic connectivity of the hydraulically fractured medium, is then calculated by applying Darcy’s law for laminar flow.
These fracturing models are integrated into the FE code that addresses thermo–poroelastic TBVPs: thermal recovery from Hot Dry Rock (HDR) reservoirs is upgraded by enhancing geothermal fluid circulation, i.e. increasing the reservoir permeability between injection and production wells by the process of HF. HF has been proven to enhance the efficiency of the thermal recovery from HDR reservoirs by 50%.
The problem of borehole stability associated with tensile and shear failure of the borehole case–shoe is also presented to ensure safe HF process of HDR reservoirs.
A fairly sufficient study on designing the Enhanced Geothermal Systems; in terms of size, impedance, efficiency and life time is outpointed. Chemical enhancement of EGS is also briefly addressed from several researchers who have been working on it recently. The effect of tempera-ture change on geothermal fluids, Newtonian and Non-Newtonian, viscosity is neatly addressed. The phenomenon of forced heat convection is highlighted with several approaches to heal/ mitigate the oscillations in the hyperbolic solutions of the approximated finite element approach.
The commonly used Streamline Upwind Petrov-Galerkin (SUPG) method fails to heal these oscillations at early times near the injection wells and at late times near the production wells. New approaches like the Subgrid Scale (SGS) and the Discontinuity Capturing Method (DCM) are worked and employed in our FE code to perfectly heal those numerical oscillations against which the SUPG schemes are inefficient.
Geothermy and Enhanced Geothermal
Systems (EGS): General view
1.1
Geothermal energy: Historical point of view
Geothermal energy (The adjective geothermal originates from the Greek roots geo, meaning earth, and thermos, meaning heat) is the thermal energy generated and stored in the Earth. Our planet self–generates this energy from the decaying of certain radioactive minerals and from the tectonic activities. This thermal energy is driven to the surface of the Earth due to a con-tinuous conduction which is a natural result of an existing difference of gradient of temperature between the core and the surface of the planet (Turcotte and Schubert, [2002]).
Geothermal energy exploitation has been historically limited to certain areas on the planet where it was feasible and easy to use it, for instance areas near tectonic plates boundaries. Mod-ern technologies, such as hydro–fracturing, have been employed to enhance the capability of extracting geothermal energy from any place on the planet, if cost effective though. Geothermal power is reliable, sustainable, and environmentally friendly; the greenhouse gases that could be released while extracting it, are much lower per unit energy produced than fossil fuels. Geother-mal energy could be the salvation of humanity that suffers from global warming if it was widely deployed.
The estimated total thermal energy above mean surface temperature to a depth of 10 km is
1.3 ×1027J, equivalent to burning 3.0 ×10¹⁷ barrels of oil. Since the global energy consumptions
for all types of energy, is equivalent to use of about 100 million barrels of oil per day, the Earth’s energy to a depth of 10 kilometers could theoretically supply all of mankind’s energy needs for six million years (Lund, [2007]). It is quite obvious that the Earth’s geothermal resources are
exploited. The efficiency here is more or less the economic efficiency; drilling to deep resources is not inexpensive, future needs for energy, future technologies and logistic interests could be the mean reasons driving the use of the geothermal power.
Hot springs have been used for bathing at least since Paleolithic times (Cataldi, [1993]). The first commercial use of geothermal power appeared in the first century AD, when Romans
conquered Aquae sulis1and used hot springs there for public paths and heating. The world’s
oldest geothermal district heating system is in Chaudes-Aigues (hot waters in old French), France, and has been operating since the 14th century (Lund, [2007]).
The USA were the first to use geothermal energy to run an entire heating system in Boise Idaho, Klamath Fallas, and Oregon between 1892 and 1900. Geysers were also used to heat green houses in Iceland around 1900’s and to heat homes in 1943 (Dickson and Fanelli, [2004]). The exploitation of geothermal energy became much common and accepted after the implementation of the heat pump in 1940’s. J. Donald Kroeker was the first to heat a common–wealth building
Portland, Oregon in 1946 by a commercial heat pump that he designed2. The idea of exploiting
geothermal energy became widely accepted and started to grow slowly after the oil crisis in 1973. As of 2004, there are over a million geothermal heat pumps installed worldwide providing 12 GW of thermal capacity (Curtis et al., [2004]). Each year, about 80,000 units are installed in the USA and 27,000 in Sweden (Curtis et al., [2004]).
19700 1980 1990 2000 2010 2 4 6 8 10 Year Installed capacity (GW)
Figure 1.1: Total worldwide geothermal capacity from 1975 up to end of 2007 (Bertani,[2007]).
1Aquae Sulis was a small town in the Roman province of Britannia.
2Kroeker J. Donald, Chewning Ray C. (February 1948), A Heat Pump in an Office Building, ASHVE Trans-actions 54: 221-238.
1.2
Types of geothermal systems
1.2.1 Conventional geothermal systems
Traditional geothermal energy systems for effective electricity production can be potentially used
only on less than 10 percent of Earth’s surface. They rely on locating anomalies, section(1.1).
They use a well to pump water out of the ground and pass it through a heat exchanger. A refrigerant cycle is then used to remove heat from the water. This refrigerant is compressed to make a hot gas that could be used to heat buildings (Lund, [2007]).
1.2.2 Enhanced geothermal systems
The vast majority of geothermal energy, within reach of available techniques, is in dry and non-permeable rock Hot Dry Rock (HDR) (Duchane and Brown, [2002]). Enhanced Geothermal Systems (EGS), unlike the conventional geothermal systems, do not require any certain loca-tion anomalies; engineers would rather enhance and/or create the geothermal recovery from this
HDR through hydraulic stimulation, see figure (1.2).
Figure 1.2: Enhanced geothermal system 1:Reservoir 2:Pump house 3:Heat exchanger 4:Turbine hall 5:Production well 6:Injection well 7:Hot water to district heating 8:Porous sediments 9:Obser-vation well 10:Crystalline bedrock (Wikipedia EGS, 30/08/2011).
When the rock is not porous enough to allow efficient rates of flow, cold pressurized water is injected down the borehole. The injection increases the fluid pressure in the naturally frac-tured rock which incites shear events, enhancing the permeability of the fracfrac-tured system. This
process is called hydro–shearing/fracturing.
Water travels through fractures in the rock, capturing the heat of the rock until it is forced out of a second borehole as very hot water, which is converted into electricity using either a steam turbine or a binary power plant system. All of the water, now cooled, is injected back into the ground to heat up again in a closed loop. Distinct from conventional geothermal systems, HDR / EGS may be feasible anywhere in the world depending on the economic limits of drilling depth. Good locations are over deep granite covered by a thick (3-5 km) layer of insulating sediments which slow heat loss. Most of HDR wells are expected to have a useful life of 20 to
30 years before the outflow temperature drops about 10 ◦C and the well becomes uneconomic.
If left for 50 to 300 years the temperature will recover (Beardsmore, [2007]).
There are HDR and EGS systems currently being developed and tested in France, Australia, Japan, Germany, the U.S. and Switzerland. The largest EGS project in the world is a 25 megawatt demonstration plant currently being developed in the Cooper Basin, Australia. The Cooper Basin has the potential to generate 5,000-10,000 MW (Beardsmore, [2007]).
1.3
Types of geothermal resources
On average, the temperature of the Earth increases about 30 ◦C/km above the mean surface
ambient temperature. Thus, assuming a conductive gradient, the temperature of the earth at
10 km would be over 300 ◦C. However, most geothermal exploration occurs where the gradient
is higher and thus where drilling is shallower and less costly. These shallow depth geothermal resources occur due to (Wright, [1989]):
1. Intrusion of molten rock (magma) from depth, bringing up great quantities of heat. 2. High surface heat flow, due to a thin crust and high temperature gradient.
3. Ascent of groundwater that has circulated to depths of several kilometers and been heated due to the normal temperature gradient.
4. Insulation of deep rocks by thick formation of rocks like shale whose thermal conductivity is low (Thermal Blanketing).
5. Anomalous heating of shallow rock by decay of radioactive elements, perhaps augmented by thermal blanketing.
Geothermal resources are usually classified as shown in Table (1.1). Geothermal resources
range from the mean annual ambient temperature of around 20◦C to over 300◦C. In general,
resources above 150◦C are used for electric power generation, and resources below 150 ◦C are
usually used in direct–use projects for heating and cooling (White and Williams, [1975]). Table 1.1: Geothermal Resource Types (White and Williams, [1975]).
Resource Type Temperature Range◦C
Convective hydrothermal resources
Vapor dominated 240◦
Hot-water dominated 20 to 350◦ +
Other hydrothermal resources
Sedimentary basin 20 to 150◦
Geo–pressured 90 to 200◦
Radiogenic 30 to 150◦
Hot rock resources
Solidified (Hot Dry Rock) 90 to 650◦
Part still molten (magma) > 650◦
1.3.1 Vapor dominated systems
Produce steam from boiling of deep waters in low permeability rocks. These reservoirs are few in number, with The Geysers in Northern California, Larderello in Italy and Matsukawa in Japan being ones where the steam is exploited to produce electric energy (White et al., [1971]).
Region of condensation Water table
Heat Vapor
Boiling sub-surface water table Convecting hot water
Recharge Recharge
Figure 1.3: Vapor dominated geothermal system edited from (White et al., [1971]).
1.3.2 Water dominated systems
These systems are generated from water circulating deep in permeable rocks that are heated by a convecting source and later lifted up by buoyancy. These systems include an up–flow zone
at the center of each convection cell, an outflow zone of heated water moving laterally away from the center of the system, and a down–flow zone where recharge is taking place. Surface manifestations could include hot springs, Geysers, chemically altered rocks, or sometimes a blind source with no surface manifestation (White et al., [1971]).
Co ld wat er High den sit y Lo w de ns ity Ho t wat er Boiling begins Rocks of low permeability Convecting Magma Permeable rock Crystalline rocks Hot spring or geyser Heat 10 °C at surface
Figure 1.4: Hot water dominated geothermal system edited from (White et al., [1971]).
1.3.3 Sedimentary basins
Produce higher temperature resources than the surrounding formations due to their low thermal
conductivity “geothermal gradients > 30◦C/km”. These basins generally extend over large areas
and are typical of the Madison Formations of North Dakota, South Dakota, Montana and Wyoming area of the northern United States and the Pannonian Basin of central Europe where it has been used extensively in Hungary (Anderson and Lund, [1979]).
Sandstone Shale
Conglomerate
Basement Crystaline rock
30°C Isotherm 30°C 60°C Recharge Geothermal wells Fault Thermal spring 0 1 2 3 km
1.3.4 Geo–pressured resources
These resources, figure (1.6), occur as result of water circulating in permeable sedimentary
rocks which are buried deep in the earth crust. These deeply circulating fluids are heated by
natural/enhanced1 geothermal gradients and tightly confined by the surrounding impermeable
rocks holding pressure much larger than the hydrostatic. These waters are target for drilling not only for geothermal power but also for the dissolved methane. The Texas and Louisiana Gulf Coast in the United States has been tested for the geothermal energy, however, due to the great depths of several kilometers they have not proved economic (Bebout et al., [1978]).
Continental shelf Slope Coastal plain A A' QUAT SD & SH Low density high-pressure shale Houston A A' Texas coastal area
Pre-Tertiary section Geopressured Sands 1 0 ,0 0 0 m Miles 0 50 100
Figure 1.6: Geopressured geothermal system edited from (Bebout et al., [1978]).
1.3.5 Radiogenic resources
Found where granitic intrusions are near surface heating up the local groundwater from the decay of radioactive thorium, potassium and uranium. This localized heating increases the normal geothermal gradient providing hot water at economical drilling depths. This type of resource occurs along the eastern United States, but has not been developed commercially.
Recharge at out crop area Geothermal
well Vertical recharge throughleaky aquifers
Aquitards Aquifer Radiogenic intrusive rocks Basement crystalline rocks 60°C 30°C S e d im e n ts o f l o w T h e rm a l c o n d u c tiv it y
Figure 1.7: Radiogenic geothermal system edited from (Anderson and Lund, [1979]).
1.3.6 Hot Dry Rock (HDR) resources
These resources represent heat trapped in quite deep rocks (up to 10 km). At such depths geothermal energy cannot be extracted economically, besides these rocks contain few pores or fractures and thus very low or no permeability.
In order to extract the heat, experimental projects have artificially fractured the rock by hydraulic pressure, followed by circulating cold water down one well to extract the heat from the rocks and then producing from a second well in a closed system. Early experimental projects were undertaken at Fenton Hill (Valdes Caldera) in northern New Mexico and on Cornwall in southwest England, however, both of these projects have been abandoned due to lack of funds and poor results. Projects are currently underway in Soultz-sous-Forˆets in the Rhine Graben
on the French-German border, in Switzerland at Basel and Z¨urich, in Germany at Bad Urach,
several locations in Japan, and in the Cooper Basin of Australia (Tenzer, [2001]).
Surface plant
Heat exchanger
Control building
Cooled water return Hot water supply Directly drilled to intercept fractures Hydraulic fracture zone 1,000 m2 2 0 0 °C w a te r 3 -5 k m
High heat flow area
1.3.7 Molten rock or magma resources
A heat exchanger constructed on the surface of the lava flow recovered steam resulting from boiling of downward percolation water from the surface. These resources have been drilled in Hawaii experimentally to extract heat energy directly from molten rock. It has been used successfully at Heimaey in Iceland (one of the Westmann Islands) after the 1973 eruption.
1.4
Utilization of geothermal energy
1.4.1 Electric power generation
Geothermal energy is generated by using the hot steam which turns a turbine which is, in its turn, designed to generate electricity. Vapor dominated resources figures (1.3) and (1.9) can be used directly. However, water dominated resources need a pre–step in which pressure is reduced to generate the steam, figure (1.10).
Turbine
Steam
Condensate
Air Air
Air and water Vapor Water Generator Cooling tower water Condenser Geothermal reservoir (Dry Steam) Injection well Production well
Figure 1.9: Steam plant using a vapor or dry steam dominated geothermal resource edited from (Lund, [2007]).
Air and water vapor Condensate Condenser Steam Waste water Turbine Steam Water Seperator Air Water Air
Direct heat users
Generator Cooling tower Injection well Production
well Geothermal reservoir
Water
Figure 1.10: Flash steam plant using a water-dominated geothermal resource with a separator to produce steam edited from (Lund, [2007]).
cycle called Rankine cycle that contains low–boiling organic fluid is necessary to generate the
vapor required to run the turbine, figure (1.11). Later a cooling tower is used to condense
the vapor leaving the turbine and thus increasing the efficiency of the system by creating a considerable drop in the temperature of the vapor.
Air and water vapor Turbine Generator Cooling tower Air Water Air Water Condenser Cooled water Heat exchanger Pump Or g anic V ap or Injection well Production
well Geothermal reservoir
Figure 1.11: Binary power or organic Rankine cycle plant using a low temperature geothermal resource and a secondary fluid of a low boiling-point hydrocarbon edited from (Lund, [2007]).
1.4.2 Direct utilization
Direct use of geothermal energy is widespread and could be located in very far and isolated areas. This renders the estimation of the global direct utilization a tremendous task, however, the main utilization categories are:
1. Swimming, bathing and balneology.
2. Space heating and cooling including district energy systems. 3. Agricultural applications such as greenhouse and soil heating. 4. Aquaculture application such as pond and raceway water heating.
5. Industrial applications such as mineral extraction, food and grain drying.
Direct utilization of geothermal energy includes geothermal resources which give low to in-termediate temperature. These low to inin-termediate temperature resources are feasible and exist in at least 80 countries at economic depths (Lund, [2007]). The direct utilization projects range from individual scales of homes and greenhouses heating to large scales operations such as min-erals extraction.
Geothermal waters are oxygen free and care must be payed to prevent oxygen from pen-etrating them. Dissolved gases and minerals such as Arsenic and Hydrogen Sulfide must be removed or isolated since they are harmful to humans and plants. On the other hand, carbon dioxide which often occurs in geothermal waters can be extracted and used to enhance growth in greenhouses.
1.5
Environmental considerations
Although geothermal resources are considered renewable and green, there are several environ-mental impacts, that are usually mitigated, which must be considered during utilization. These include emission of harmful gases, noise pollution, water use and quality, land use, impact on natural phenomena, and induced seismicity (Kagel et al., [2005]).
1.5.1 Emissions
These are normally direct results of using vapor power plants with cooling towers as they produce water steam emission. Depending on the reservoir type, these vapor emissions include: carbon dioxide, sulfur dioxide, nitrous oxides, hydrogen sulfide along with particulate matter. Table
(1.2) shows a small comparison of emitted gases (kg/MWh) between a coal-fired plant and a
geothermal power plant.
Table 1.2: Comparison of emitted gases (kg/MWh) between a coal-fired plant and a geothermal power plant (Lund, [2007]).
Name of the emitted gas Amount released from Amount released from
a coal–fired plant a geothermal power plant
Carbon dioxide 994 40
Sulfur dioxide 4.71 0.16
Nitrogen oxides 1.95 0
Hydrogen sulfide 0 0.08
Other particulate matters 1.01 0
Hydrogen sulfide is routinely treated at geothermal power plants and converted to elemental sulfur. Binary (air–cooled) power plants and direct-use projects normally do not produce any pollutants, as the water is injected back into the ground after use without exposing it to the atmosphere.
![Table 2.1: Parameters used in the simulations of DDFM on Lac du Bonnet granite, (Shao et al., [2005]).](https://thumb-eu.123doks.com/thumbv2/123doknet/14495177.718188/88.892.133.790.554.884/table-parameters-used-simulations-ddfm-bonnet-granite-shao.webp)