HAL Id: hal-02126337
https://hal.archives-ouvertes.fr/hal-02126337
Submitted on 11 May 2019
HAL is a multi-disciplinary open access
archive for the deposit and dissemination of
sci-entific research documents, whether they are
pub-lished or not. The documents may come from
teaching and research institutions in France or
abroad, or from public or private research centers.
L’archive ouverte pluridisciplinaire HAL, est
destinée au dépôt et à la diffusion de documents
scientifiques de niveau recherche, publiés ou non,
émanant des établissements d’enseignement et de
recherche français ou étrangers, des laboratoires
publics ou privés.
The Risk of Flawed Inference in Evolutionary Studies
When Detectability Is Less than One
Olivier Gimenez, Anne Viallefont, Anne Charmantier, Roger Pradel,
Emmanuelle Cam, Charles Brown, Mark Anderson, Mary Brown, Rita Covas,
Jean-Michel Gaillard
To cite this version:
Olivier Gimenez, Anne Viallefont, Anne Charmantier, Roger Pradel, Emmanuelle Cam, et al.. The
Risk of Flawed Inference in Evolutionary Studies When Detectability Is Less than One. American
Naturalist, University of Chicago Press, 2008, 172 (3), pp.441-448. �10.1086/589520�. �hal-02126337�
The Risk of Flawed Inference in Evolutionary Studies
When Detectability Is Less than One
Olivier Gimenez,1,*Anne Viallefont,2,†Anne Charmantier,1,‡ Roger Pradel,1,3,§ Emmanuelle Cam,4,k
Charles R. Brown,5,#Mark D. Anderson,6,**Mary Bomberger Brown,5,††Rita Covas,1,‡‡and Jean-Michel Gaillard2,§§
1. Centre d’Ecologie Fonctionnelle et Evolutive, Centre National de la Recherche Scientifique, Unite´ Mixte de Recherche 5175, 1919 Route de Mende, 34293 Montpellier Cedex 5, France;
2. Universite´ de Lyon, F-69000, Lyon, Universite´ Lyon 1, Centre National de la Recherche Scientifique, Unite´ Mixte de Recherche 5558, Laboratoire de Biome´trie et Biologie Evolutive, F-69622, Villeurbanne, France;
3. Consejo Superior de Investigaciones Cientı´ficas, Universitat de les Illes Balears, Institut Mediterrani d’Estudis Avanc¸ats, Population Ecology Group, ES-07190 Esporles, Spain;
4. Laboratoire Evolution et Diversite´ Biologique, Centre National de la Recherche Scientifique, Unite´ Mixte de Recherche 5174, Baˆtiment 4R3, Universite´ P. Sabatier, Toulouse III, 118 route de Narbonne, 31062 Toulouse Cedex 4, France;
5. Department of Biological Sciences, University of Tulsa, Tulsa, Oklahoma 74104;
6. Department of Tourism, Environment and Conservation, Private Bag X6102, Kimberley 8300, Northern Cape, South Africa
Submitted January 19, 2007; Accepted April 15, 2008; Electronically published July 25, 2008
abstract: Addressing evolutionary questions in the wild remains a challenge. It is best done by monitoring organisms from birth to death, which is very difficult in part because individuals may or may
* E-mail: [email protected]. † E-mail: [email protected]. ‡ E-mail: [email protected]. § E-mail: [email protected]. k E-mail: [email protected]. #E-mail: [email protected]. ** E-mail: [email protected].
††Present address: Tern and Plover Conservation Partnership, University of
Nebraska, Lincoln, Nebraska 68583; e-mail: [email protected].
‡‡E-mail: [email protected]. §§E-mail: [email protected].
Am. Nat. 2008. Vol. 172, pp. 441–448.䉷 2008 by The University of Chicago. 0003-0147/2008/17203-50115$15.00. All rights reserved.
DOI: 10.1086/589520
not be resighted or recaptured. Although the issue of uncertain de-tection has long been acknowledged in ecology and conservation biology, in evolutionary studies of wild populations it is often as-sumed that detectability is perfect. We argue that this assumption may lead to flawed inference. We demonstrate that the form of nat-ural selection acting on body mass of sociable weavers is altered and that the rate of senescence of roe deer is underestimated when not accounting for a value of detectability that is less than one. Because mark-recapture models provide an explicit way to integrate and re-liably model the detection process, we strongly recommend their use to address questions in evolutionary biology.
Keywords: capture-recapture, Cormack-Jolly-Seber, fitness function,
individual covariates, selection gradients, senescence.
Evolutionary biologists are often interested in addressing questions in natural populations. The increasing avail-ability of longitudinal data collected during long-term studies in the wild makes it possible to understand evo-lutionary processes better than ever. In particular, evolu-tionary biologists are showing growing interest in per-forming empirical tests of evolutionary theories through the study of ongoing evolution in natural settings (Hoek-stra et al. 2001; Kingsolver et al. 2001). Although studies of evolution in the wild are necessary to highlight processes that occur in the natural environment that cannot be ac-curately mimicked in laboratory conditions, they also con-tain inherent methodological problems compared to lab-oratory experiments, some of which are too often neglected. In particular, measuring fitness traits in the field is difficult. Estimating lifetime fitness would ideally require continual monitoring of each individual in the population from birth to death. In practice, however, individuals may or may not be seen (or recaptured) at various times in their lifetime, thereby raising the issue of a detectability value that is less than one (e.g., Lebreton et al. 1992). For example, when the last encounter with an individual oc-curs before the end of the study, its date of death will be unknown but will be estimated as the date the individual was last observed. Although this problem has long been acknowledged in ecology and conservation biology (Wil-liams et al. 2002), it has surprisingly been overlooked by
442 The American Naturalist
evolutionary biologists (Clobert 1995). Most often, detec-tion is assumed to be certain so that standard methods such as generalized linear models or survival analysis can be conveniently used (Skalski et al. 2005).
Two objectives that have recently received a growing level of attention but that suffer from this problem of nonperfect detectability are (i) demonstrating microevo-lution within a population where selection on an evolving trait is measured (Hoekstra et al. 2001; Kingsolver et al. 2001) and (ii) investigating survival senescence and its evolution in the wild (Bronikowski and Promislow 2005; Williams et al. 2006). Here, we use two long-term data sets to illustrate the risk of flawed inference in these two types of evolutionary studies when detectability is less than unity. In both examples, we proceed in two steps. First, we conduct a naive analysis considering all individuals as being detected with certainty. Second, we adopt a mark-recapture (MR) modeling approach that explicitly ac-counts for the detection process (Lebreton et al. 1992); therefore, demographic parameter estimates are unbiased. Although the MR approach has been advocated to address evolutionary questions, this statistical method remains un-derused (Clobert 1995; Cooch et al. 2002; Brown and Brown 2004). By comparing the results of the naive and MR analyses, we show that the selection on body mass of birds is incorrectly inferred and that the rate of senescence of roe deer is underestimated.
Material and Methods
Natural Selection on Body Mass of Sociable Weavers
From 1993 to 2000, sociable weavers (Philetairus socius) were captured with mist nets and individually banded with numbered metal bands at Benfontein Game Farm, Northern Cape Province, South Africa. A total of 435 birds of known age that had first been ringed and weighed as juveniles were used in this analysis. Covas et al. (2002) provide further details on the MR protocol. We investi-gated the relationship between body mass and survival of weavers in two ways after accounting for possible age and year variation. First, using a naive approach, we assumed that detection probability (the probability of capturing an individual alive and present in the study area) was 1. We calculated selection gradients following the approach of Lande and Arnold (1983). Selection gradients measure the action of selection on a trait. More precisely, in a selection experiment, they measure the difference in the mean phe-notype (i.e., mean body mass) in the selected group and the mean phenotype in the entire population before se-lection, holding all other traits statistically constant. Se-lection gradients can be estimated using the slope coef-ficients of a model where fitness (or a fitness component)
is a function of one or several phenotypic traits. Such relationships are also called fitness functions and are not necessarily linear: they describe the strength and the form of natural selection (stabilizing, directional, or disruptive). We calculated time to death (or equivalently, survival, a proxy of fitness in that study) as the occasion following that when an individual was last captured. Although sev-eral studies have used linear regression (e.g., Bjo¨rklund and Sen˜ar 2001), logistic regression is more appropriate with binary dependent variables such as survival (Janzen and Stern 1998) and has been widely used (e.g., Husak 2006; Calsbeek and Smith 2007). Using logistic regression, we first analyzed the data using the R program (Ihaka and Gentleman 1996) in what we call the naive approach. We then followed recommendations by Kingsolver and Smith (1995) and used MR models to estimate the relationship between survival and body mass while accounting for a detection probability !1. Program MARK (White and
Burnham 1999) was used to estimate the likelihood of the possible relationships between survival and body mass and to estimate survival and recapture parameters. On the basis of recent analyses of the data (Covas et al. 2002; Gimenez et al. 2006), we tested for age and time dependence in survival and detection probabilities. In both the naive and the MR analyses, two models were fitted that specified linear and linear-quadratic shapes of the relationship link-ing survival to body mass. We discriminated between di-rectional selection (i.e., a monotonic increase of survival with increasing body mass) and stabilizing selection (i.e., a peak of survival at some intermediate body mass) by comparing models involving a linear effect versus those that involve both linear and quadratic effects (Lande and Arnold 1983; Phillips and Arnold 1989), using the Akaike Information Criterion (AIC; Burnham and Anderson 2002): the lower the AIC value, the better the model is supported by the data. We additionally calculated “AIC weights” to quantify the likelihood that a model is the best relative to a predefined set of alternative models (Burnham and Anderson 2002). In both analyses, body mass mea-surements were standardized (Gimenez et al. 2006).
Senescence in Survival of Roe Deer
From 1978 to 2005, roe deer (Capreolus capreolus) were captured with drive nets in a 26-km2 enclosure at Chize´,
France. A total of 432 deer (214 females and 218 males) were used in this analysis. The age of each deer was known because they were all caught as fawns. Gaillard et al. (1993) provide further details on the MR protocol. We investi-gated actuarial senescence patterns (i.e., the age-related increase in mortality rate; Williams et al. 2006) in deer by estimating age-specific variation in survival. Actuarial se-nescence patterns in roe deer are well described using a
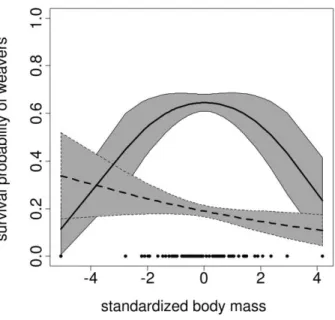
Figure 1:Relationship between survival and body mass in sociable weav-ers obtained by a mark-recapture analysis (solid line) and a naive analysis assuming perfect detection (dashed line). Filled circles represent body mass values, and shaded areas represent 95% confidence intervals.
Table 1: Model selection for the relationship between survival and body mass of sociable weavers: naive
approach assuming perfect detectability versus mark-recapture (MR) approach Fitness function
Naive analysis MR analysis
AIC AIC weight No. parameters AIC AIC weight No. parameters
Linear⫹ quadratic 427.857 .336 4 927.336 .709 10
Linear 426.495 .664 3 929.109 .291 9
Note: AIC, Akaike Information Criterion.
Gompertz curve (Gaillard et al. 2004), which assumes that the mortality hazardm(x)is exponentially related to age x asm(x) p A exp (bx), where A and b are usually considered to be intercept and slope, respectively (e.g., Service 2004). We thus considered this model to be our reference. As in the previous example, a naive approach was adopted first, assuming that the probability of recapturing a deer at any stage of its reproductive life was 1. We estimated the age at death as the number of years between the first and last capture (e.g., Moya-Laran˜o 2002; Morbey et al. 2005). We analyzed these data using the R program (Ihaka and Gen-tleman 1996) using parametric survival modeling (Klein and Moeschberger 2003), a classical approach in senes-cence studies (Pletcher 1999). Individuals that were still alive at the end of the study were censored, as were some marked individuals that were removed from the popula-tion because they were injured during captures (∼3%; Gaillard et al. 1993) or because they were translocated to other populations as a part of the management of this enclosed population (although translocated roe deer [∼80– 100 per year] were preferentially unmarked animals; see Gaillard et al. 1993 for further details). We then used an MR modeling approach to estimate age-dependent sur-vival probabilities. On the basis of previous studies (e.g., Gaillard et al. 2004) we tested for time dependence in both survival and capture probabilities. We used program MARK (White and Burnham 1999) to estimate the pa-rameters of the Gompertz model (Gaillard et al. 2004) and the recapture probabilities. In both analyses, males and females were analyzed separately (Gaillard et al. 1993).
Results
Natural Selection on Body Mass of Sociable Weavers
The best-fitting model included a survival probability con-stant over age and time, whereas detection probabilities varied over time. The linear model was selected by the naive analysis, suggesting that directional selection acts on body mass of weavers (table 1). Survival was predicted to be maximal (10.25) for body mass !23 g and decreased
in heavier birds (fig. 1, dashed line). When the assumption of perfect detectability was relaxed, the MR analysis re-vealed that estimated recapture probability values were clearly!1 and also were highly variable with time (0.12–
0.83; see appendix table A1 for annual estimates of de-tection probabilities). In contrast to the naive approach, the MR approach favored the quadratic model, indicating that body mass was under stabilizing selection (table 1). Survival was maximal around the mean phenotype (fig. 1,
solid line), that is, a body mass between 26 and 31 g leading
to survival value 10.60. Overall, stabilizing selection was
more than twice as plausible as directional selection (AIC weights ratio, 0.709 : 0.291), whereas the naive analysis incorrectly selected the reverse pattern, that is, suggesting directional selection was about twice as plausible as sta-bilizing selection (AIC weights ratio, 0.664 : 0.336). This discrepancy between the naive and the MR analyses sug-gests that the curvilinear relationship between survival and body mass may be masked either by a direct correlation between body mass and detection probability (e.g., Janzen et al. 2000; but additional analyses did not provide such evidence) or by an indirect relation of both parameters with a third life-history trait, such as age or body size. The observed pattern of stabilizing selection probably results
444 The American Naturalist
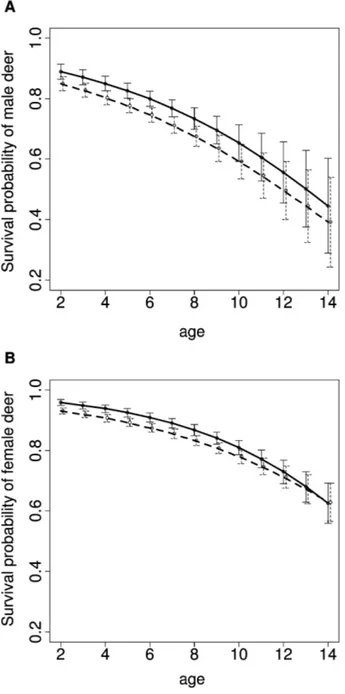
Figure 2:Relationship between survival and age in (A) male and (B)
female roe deer obtained by a mark-recapture analysis (solid line) and a naive analysis assuming perfect detection (dashed line). Vertical bars rep-resent 95% confidence intervals.
from a trade-off between the risks of starvation at low body mass and predation at high body mass (Covas et al. 2002).
Senescence in Survival of Roe Deer
The best-fitting model included a survival probability con-stant over time, whereas detection probabilities varied over
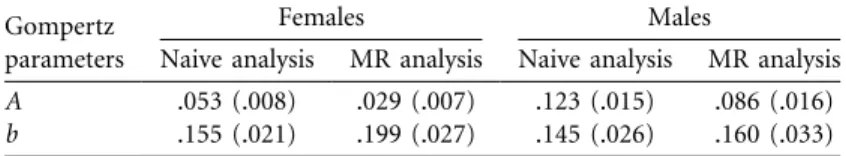
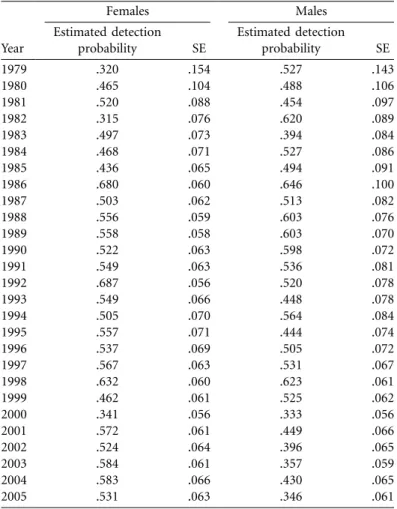
time. The naive analysis led to downward-biased, age-specific survival estimates of both sexes when compared with the MR analysis (fig. 2). This systematic bias occurred because deer that are observed for the last time before the end of the study are wrongly considered to be dead by the naive approach, whereas they may actually still be alive but remain undetected (detection probability varied among years, from 0.32 to 0.69; see appendix table A2 for annual estimates of detection probabilities). Senescence in roe deer survival occurred according to both analyses. Most interestingly, we found consistent patterns between sexes in parameter estimates of the Gompertz curve (table 2). The estimated slope b, which is often considered to be a measure of the rate of senescence, was underestimated using the naive analysis by up to 28% in females and 10% in males. In addition, the estimated intercept A, which corresponds to initial mortality, was overestimated by the naive analysis by up to 45% in females and 30% in males.
Discussion
Our study provides clear evidence that flawed evolutionary inferences may occur when the value of individual de-tectability is!1 (see also Clobert 1995; Martin et al. 1995).
We acknowledge that our case studies are based on field data in which the truth is unknown. Although our inter-pretation of the results seems reasonable, there is no a priori reason that it is actually correct. However, we have shown that detection probabilities in both case studies were !1 and were time varying, and that the incorrect
assumption of perfect detection resulted in (i) changing the estimate of the form of natural selection acting on weavers’ body mass and (ii) underestimating roe deer rate of survival senescence and overestimating the initial mor-tality. In agreement with Nichols et al. (1997), we do not claim that the evolutionary studies that formed this as-sumption are all incorrect, but rather that it is difficult to know whether we should rely on their results if the data have not been reanalyzed using MR models. In addition to assessing the action of natural selection and investi-gating senescence trends that we have addressed here, MR models can prove to be useful in studying problems such as the fitness associated with alternative reproductive tac-tics (e.g., Brown and Brown 2004), the evolution of dis-persal (e.g., Serrano et al. 2005), or the nature of life-history trade-offs (e.g., Townsend and Anderson 2007).
Nevertheless, although MR models are considered to be as flexible as generalized linear models or survival models that are used when the detection probability value is 1, some specific problems exist in MR models for which particular attention or further research is needed. First, MR models cannot distinguish between survival and em-igration (Lebreton et al. 1992), which may lead to biased
Table 2: Parameter estimates (and SEs) of the Gompertz mortality curve of
female and male roe deer: naive approach assuming perfect detectability versus mark-recapture (MR) approach
Gompertz parameters
Females Males
Naive analysis MR analysis Naive analysis MR analysis
A .053 (.008) .029 (.007) .123 (.015) .086 (.016)
b .155 (.021) .199 (.027) .145 (.026) .160 (.033)
Note: A, initial mortality rate; b, exponential rate of mortality increase (i.e., rate of senescence).
estimates of selection if emigration is related to phenotypic trait values (e.g., Letcher et al. 2005). Monitoring indi-viduals in multiple sites (so-called multistate MR models; Lebreton and Pradel 2002) can solve this problem by es-timating phenotype-dependent movement among sites. Bias may also arise in the calculated strength and form of selection due to covariation between detection probability and the trait under selection (e.g., Janzen et al. 2000). MR models can cope with this issue by relating the detection probabilities to the phenotypic trait values (Kingsolver and Smith 1995).
Second, a challenge lies in possible heterogeneity in sur-vival among individuals. If there are two classes of indi-viduals with low and high survival probabilities, the overall survival rate will be increasingly influenced by the indi-viduals with the highest survival over ages, leading to un-derestimated or even masked senescence at the population level (Vaupel and Yashin 1985). In the roe deer case study, for example, we removed some individual heterogeneity by analyzing males and females separately, but residual individual variance might still be present. This can be gen-erated by heterogeneity in phenotypic quality (e.g., body mass at independence) but can also be seen as an intrinsic property of a given individual (Link et al. 2002). In stan-dard MR models, assessing the influence of individual co-variates on age-specific survival probabilities is possible, but individual random effects are not yet implemented routinely when detectability is!1 (Cam et al. 2002; see,
however, Gimenez et al. 2006 and Royle 2008). A new formulation of MR models that disentangle demographic processes (e.g., survival) from their observation (i.e., de-tection; Pradel 2005; Gimenez et al. 2007) makes us con-fident that those tools will soon become available.
A further complexity may arise when relationships be-tween traits are neither linear nor quadratic. The form of selection may not be consistent with directional,
stabiliz-ing, or disruptive selection (Conner and Hartl 2004). In the sociable weaver case study, we assumed simple rela-tionships between survival and body mass, although more complex functions might have been more appropriate. When the detection value is assumed to be 1, the use of spline smoothing allows for maximum flexibility in de-scribing the relationship between fitness components and phenotypic traits (Schluter 1988; Schluter and Nychka 1994). Although progress has been made to implement this approach in MR models (Gimenez et al. 2006), new tools are needed to allow for visualization and quantifi-cation of natural selection involving multiple traits (O. Gimenez, A. Gre´goire, and T. Lenormand, unpublished data).
Overall, we advocate explicit recognition that detection probabilities are often !1, which can greatly affect
con-clusions. As a consequence, we believe that the use of an MR modeling framework can be important for proper biological inference. We realize that implementing MR models may be a costly time investment for evolutionary ecologists who have never used these models, but this can be made easier with the use of existing literature (e.g., Lebreton et al. 1992; Williams et al. 2002) and user-friendly software that is available for free (M-SURGE: Choquet et al. 2004; SURPH: Smith et al. 1994; MARK: White and Burnham 1999).
Acknowledgments
We thank V. Grosbois for helpful discussions. This article was written while O.G. was visiting E. Kazakou and K. Theodorou at the University of the Aegean (Mytilini, Greece). C.R.B. and M.B.B. were supported by the Na-tional Science Foundation (DEB-0075199, DEB-0514824). This is a contribution of the “Comparative Evolutionary Demography” French working group.
446 The American Naturalist
APPENDIX
The Risk of Flawed Inference in Evolutionary Studies When Detectability Is Less than One
Table A1: Estimated time-dependent
detec-tion probabilities of sociable weavers (qua-dratic model) Year Estimated detection probability SE 1994 .525 .079 1995 .347 .052 1996 .169 .036 1997a 0 … 1998 .124 .045 1999 .829 .085 2000 .790 .075
a Detection probability in 1997 was fixed to 0
because the birds did not breed at any time in that year and, consequently, no mark-recapture work was performed.
Table A2: Estimated time-dependent detection probabilities of roe deer
(Gompertz model) Year Females Males Estimated detection probability SE Estimated detection probability SE 1979 .320 .154 .527 .143 1980 .465 .104 .488 .106 1981 .520 .088 .454 .097 1982 .315 .076 .620 .089 1983 .497 .073 .394 .084 1984 .468 .071 .527 .086 1985 .436 .065 .494 .091 1986 .680 .060 .646 .100 1987 .503 .062 .513 .082 1988 .556 .059 .603 .076 1989 .558 .058 .603 .070 1990 .522 .063 .598 .072 1991 .549 .063 .536 .081 1992 .687 .056 .520 .078 1993 .549 .066 .448 .078 1994 .505 .070 .564 .084 1995 .557 .071 .444 .074 1996 .537 .069 .505 .072 1997 .567 .063 .531 .067 1998 .632 .060 .623 .061 1999 .462 .061 .525 .062 2000 .341 .056 .333 .056 2001 .572 .061 .449 .066 2002 .524 .064 .396 .065 2003 .584 .061 .357 .059 2004 .583 .066 .430 .065 2005 .531 .063 .346 .061
Literature Cited
Bjo¨rklund, M., and J. C. Sen˜ar. 2001. Sex differences in survival selection in the serin, Serinus serinus. Journal of Evolutionary Bi-ology 14:841–849.
Bronikowski, A. M., and D. E. L. Promislow. 2005. Testing evolu-tionary theories of aging in wild populations. Trends in Ecology & Evolution 20:271–273.
Brown, C. R., and M. B. Brown. 2004. Mark-recapture and behavioral ecology: a case study of cliff swallows. Animal Biodiversity and Conservation 27:23–34.
Burnham, K. P., and D. R. Anderson. 2002. Model selection and multimodel inference: a practical information-theoretic approach. Springer, New York.
Calsbeek, R., and T. B. Smith. 2007. Probing the adaptive landscape using experimental islands: density-dependent natural selection on lizard body size. Evolution 61:1052–1061.
Cam, E., W. A. Link, E. G. Cooch, J.-Y. Monnat, and E. Danchin. 2002. Individual covariation in life-history traits: seeing the trees despite the forest. American Naturalist 159:96–105.
Choquet, R., A.-M. Reboulet, R. Pradel, O. Gimenez, and J.-D. Le-breton. 2004. M-SURGE: new software specifically designed for multistate capture-recapture models. Animal Biodiversity and Conservation 27:207–215.
Clobert, J. 1995. Capture-recapture and evolutionary ecology: a dif-ficult wedding? Journal of Applied Statistics 22:989–1008. Conner, J. K., and D. L. Hartl. 2004. A primer of ecological genetics.
Sinauer, Sunderland, MA.
Cooch, E. G., E. Cam, and W. Link. 2002. Occam’s shadow: levels of analysis in evolutionary ecology—where to next? Journal of Applied Statistics 29:19–48.
Covas, R., C. R. Brown, M. D. Anderson, and M. B. Brown. 2002. Stabilizing selection on body mass in the sociable weaver
Phile-tairus socius. Proceedings of the Royal Society B: Biological Sciences
269:1905–1909.
Gaillard, J.-M., D. Delorme, J.-M. Boutin, G. Van Laere, B. Bois-aubert, and R. Pradel. 1993. Roe deer survival patterns: a com-parative analysis of contrasting populations. Journal of Animal Ecology 62:778–791.
Gaillard, J.-M., A. Viallefont, A. Loison, and M. Festa-Bianchet. 2004. Assessing senescence patterns in populations of large mammals. Animal Biodiversity and Conservation 27:47–58.
Gimenez, O., R. Covas, C. R. Brown, M. D. Anderson, M. B. Brown, and T. Lenormand. 2006. Nonparametric estimation of natural selection on a quantitative trait using mark-recapture data. Evo-lution 60:460–466.
Gimenez, O., V. Rossi, R. Choquet, C. Dehais, B. Doris, H. Varella, J.-P. Vila, and R. Pradel. 2007. State-space modelling of data on marked individuals. Ecological Modelling 206:431–438.
Hoekstra, H. E., J. M. Hoekstra, D. Berrigan, S. N. Vignieri, A. Hoang, C. E. Hill, P. Beerli, and J. G. Kingsolver. 2001. Strength and tempo of directional selection in the wild. Proceedings of the National Academy of Sciences of the USA 98:9157–9160.
Husak, J. F. 2006. Does survival depend on how fast you can run or how fast you do run? Functional Ecology 20:1080–1086. Ihaka, R., and R. Gentleman. 1996. R: a language for data analysis
and graphics. Journal of Computational and Graphical Statistics 5:299–314.
Janzen, F. J., and H. S. Stern. 1998. Logistic regression for empirical studies of multivariate selection. Evolution 52:1564–1571.
Janzen, F. J., J. K. Tucker, and G. L. Paukstis. 2000. Experimental analysis of an early life-history stage: selection on size of hatchling turtles. Ecology 81:2290–2304.
Kingsolver, J. G., and S. G. Smith. 1995. Estimating selection on quantitative traits using capture-recapture data. Evolution 49:384– 388.
Kingsolver, J. G., H. E. Hoekstra, J. M. Hoekstra, D. Berrigan, S. N. Vignieri, C. E. Hill, A. Hoang, P. Gibert, and P. Beerli. 2001. The strength of phenotypic selection in natural populations. American Naturalist 157:245–261.
Klein, J. P., and M. L. Moeschberger. 2003. Survival analysis: tech-niques for censored and truncated data. Springer, New York. Lande, R., and S. J. Arnold. 1983. The measurement of selection on
correlated characters. Evolution 37:1210–1226.
Lebreton, J.-D., and R. Pradel. 2002. Multistate recapture models: modelling incomplete individual histories. Journal of Applied Sta-tistics 29:353–369.
Lebreton, J.-D., K. P. Burnham, J. Clobert, and D. R. Anderson. 1992. Modeling survival and testing biological hypotheses using marked animals—a unified approach with case studies. Ecological Mono-graphs 62:67–118.
Letcher, B. H., G. E. Horton, T. L. Dubreuil, and M. J. O’Donnell. 2005. A field test of the extent of bias in selection estimates after accounting for emigration. Evolutionary Ecology Research 7:643– 650.
Link, W. A., E. G. Cooch, and E. Cam. 2002. Model-based estimation of individual fitness. Journal of Applied Statistics 29:207–224. Martin, T. E., J. Clobert, and D. R. Anderson. 1995. Return rates in
studies of life-history evolution: are biases large? Journal of Applied Statistics 22:863–875.
Morbey, Y. E., C. E. Brassil, and A. P. Hendry. 2005. Rapid senescence in Pacific salmon. American Naturalist 166:556–568.
Moya-Laran˜o, J. 2002. Senescence and food limitation in a slowly ageing spider. Functional Ecology 16:734–741.
Nichols, J. D., J. E. Hines, and P. Blums. 1997. Tests for senescent decline in annual survival probabilities of common pochards,
Ay-thya ferina. Ecology 78:1009–1018.
Phillips, P. C., and S. J. Arnold. 1989. Visualizing multivariate selec-tion. Evolution 43:1209–1222.
Pletcher, S. D. 1999. Model fitting and hypothesis testing for age-specific mortality data. Journal of Evolutionary Biology 12:430– 439.
Pradel, R. 2005. Multievent: an extension of capture-recapture mod-els to uncertain states. Biometrics 61:442–447.
Royle, J. A. 2008. Modeling individual effects in the Cormack-Jolly-Seber model: a state-space formulation. Biometrics 64:364–370. Schluter, D. 1988. Estimating the form of natural selection on a
quantitative trait. Evolution 42:849–861.
Schluter, D., and D. Nychka. 1994. Exploring fitness surfaces. Amer-ican Naturalist 143:597–616.
Serrano, D., D. Oro, U. Esperanza, and J. L. Tella. 2005. Colony size selection determines adult survival and dispersal preferences: Allee effects in a colonial bird. American Naturalist 166:E22–E31. Service, P. M. 2004. Heterogeneity in individual mortality risk and
its importance for evolutionary studies of senescence. American Naturalist 156:1–13.
Skalski, J. R., K. E. Ryding, and J. J. Millspaugh. 2005. Wildlife de-mography: analysis of sex, age, and count data. Elsevier Academic, Burlington, MA.
448 The American Naturalist
Cassen. 1994. Statistical survival analysis of fish and wildlife tagging studies. Project no. 1989–10700, BPA report DOE/BP-02341-2. Portland, OR.
Townsend, H. M., and D. J. Anderson. 2007. Assessment of cost of reproduction in a pelagic seabird using multistate mark-recapture models. Evolution 61:1956–1968.
Vaupel, J. W., and A. I. Yashin. 1985. Heterogeneity’s ruses: some surprising effects of selection on population dynamics. American Statistician 39:176–185.
White, G. C., and K. P. Burnham. 1999. Program MARK: survival
estimation from populations of marked animals. Bird Study 46: 120–139.
Williams, B. K., J. D. Nichols, and M. J. Conroy. 2002. Analysis and management of animal populations. Academic Press, San Diego, CA.
Williams, P. D., T. Day, Q. Fletcher, and L. Rowe. 2006. The shaping of senescence in the wild. Trends in Ecology & Evolution 21:458– 463.
Associate Editor: Fredric J. Janzen Editor: Michael C. Whitlock