ENVIRONMENTAL MICROBIOLOGY
To What Extent Do Food Preferences Explain the Trophic
Position of Heterotrophic and Mixotrophic Microbial
Consumers in a Sphagnum Peatland?
Vincent E. J. Jassey&Caroline Meyer&Christine Dupuy&
Nadine Bernard&Edward A. D. Mitchell&Marie-Laure Toussaint& Marc Metian&Auriel P. Chatelain&Daniel Gilbert
Received: 9 April 2013 / Accepted: 21 June 2013 / Published online: 10 July 2013 # Springer Science+Business Media New York 2013
Abstract Although microorganisms are the primary drivers of biogeochemical cycles, the structure and functioning of micro-bial food webs are poorly studied. This is the case in Sphagnum peatlands, where microbial communities play a key role in the global carbon cycle. Here, we explored the structure of the microbial food web from a Sphagnum peatland by analyzing (1) the density and biomass of different microbial functional groups, (2) the natural stable isotope (δ13
C andδ15N) signatures of key microbial consumers (testate amoebae), and (3) the digestive vacuole contents of Hyalosphenia papilio, the dom-inant testate amoeba species in our system. Our results showed
that the feeding type of testate amoeba species (bacterivory, algivory, or both) translates into their trophic position as assessed by isotopic signatures. Our study further demon-strates, for H. papilio, the energetic benefits of mixotrophy when the density of its preferential prey is low. Overall, our results show that testate amoebae occupy different trophic levels within the microbial food web, depending on their feeding behavior, the density of their food resources, and their metabolism (i.e., mixotrophy vs. heterotrophy). Combined analyses of predation, community structure, and stable isotopes now allow the structure of microbial food webs to be more completely described, which should lead to improved models of microbial community function.
Introduction
The way in which community structure and species attributes determine fluxes of energy in ecosystems is an important topic in ecology. The study of food webs provides a quanti-tative framework in our understanding of links between community structure and ecosystem functioning [1]. Food webs are networks determining the number and direction of trophic interactions in ecosystems and provide a natural framework for understanding the ecological role of species. Identifying how and to what extent these webs are structured is necessary if we hope to move beyond a “black box” approach and toward a more mechanistic understanding of the ecosystem processes and functions that they drive [2–6]. However, the presence of incompletely described feeding relationships hampers our understanding of complex and dynamic food webs in nature [7]. A clear example is the scarcity of existing data on microbial food webs, which, for
Vincent E. J. Jassey and Caroline Meyer contributed equally to this work. V. E. J. Jassey
:
C. Meyer:
N. Bernard:
M.<L. Toussaint:
D. Gilbert
UMR CNRS/UFC 6249, Laboratoire Chrono-Environnement, Université de Franche-Comté, 25211 Montbéliard Cedex, France V. E. J. Jassey
Ecological Systems Laboratory (ECOS), School of Architecture, Civil and Environmental Engineering (ENAC),
Ecole Polytechnique Fédérale de Lausanne (EPFL), Station 2, 1015 Lausanne, Switzerland
V. E. J. Jassey (*)
Swiss Federal Institute for Forest, Snow and Landscape Research (WSL), Site Lausanne, Station 2, 1015 Lausanne, Switzerland e-mail: vincent.jassey@epfl.ch
C. Dupuy
:
M. MetianUMR CNRS 7266, Laboratoire Littoral Environnement et Sociétés, Université de La Rochelle, 17000 La Rochelle, France
E. A. D. Mitchell
:
A. P. ChatelainLaboratory of Soil Biology, University of Neuchâtel, Rue Emile-Argand 11, CH-2000 Neuchâtel, Switzerland DOI 10.1007/s00248-013-0262-8
practical reasons, are often limited to experimental studies using a very limited number of taxa and often in combina-tions that do not reflect any natural system [8–11].
A major impediment in determining microbial food web structure probably stems from the difficulty in identifying interspecific links and collecting the required quantitative dietary data. Microbial communities are composed of nu-merous (and often poorly described or altogether unknown) species that can form complex food webs with numerous feeding links. Discovering the structure of these food webs is important because they may affect processes occurring at the population, community, and ecosystem levels [7]. The true trophic position (TP) and diversity in trophic roles of differ-ent microbial species and/or species group of differdiffer-ent spe-cies were, until recently, all but impossible to determine. The increasing sensitivity of analytical tools now makes it possi-ble to study ever-smaller organisms using stapossi-ble isotope probing [8,12]. Stable isotope ratios of carbon and nitrogen are increasingly used to provide time-integrated information about feeding relationships and food web structure, as showed for aquatic food webs [13–15]. By providing a temporally and spatially averaged estimate of carbon and nitrogen that is actually assimilated by organisms [16], stable isotopes can improve our estimates of the major pathways of energy flows through microbial food webs [17].
We focused here on microbial communities living in Sphag-num peatlands. In this diverse community, a group of protozoa, the testate amoebae, is especially abundant. Testate amoebae represent an ideal model group for microbial food web studies in terrestrial ecosystems owing to their abundance, diversity, and ubiquity [18]. Testate amoebae are usually considered as feeding on a wide range of food sources, such as bacteria, fungi, microalgae, ciliates, rotifers, and nematodes [12,19–22]. As a result, they are considered top predators in microbial food webs [23–25]. As such, they play an important role in carbon and nutrient cycling in soils [26–29]. However, in order to under-stand the role of testate amoebae in carbon and nutrient cycling, key aspects of their ecology need to be understood, including how they obtain energy and nutrients. Precise information on the feeding habits of testate amoebae is limited to a few species [29]. The broad range of sizes (approximately 5–500 μm in
length, corresponding to volumes spanning six orders of mag-nitude) and high diversity of morphologies and functional traits found among testate amoebae [18,30] suggest that they play different functional roles in microbial food webs. Species com-monly described as omnivores probably occupy a different trophic level in the microbial network than specific feeders such as bacterivores or predators. Furthermore, many pigmented (photosynthetic) microorganisms are known or suspected to be mixotrophic (i.e., organisms that combine autotrophy and heterotrophy using endosymbiotic zoochlorellae); these include several testate amoeba species such as Hyalosphenia papilio and Archerella flavum [31, 32], species that are commonly
found in northern Sphagnum peatlands (e.g., [18, 33–36]). The mixotrophic life trait has significant functional and physi-ological implications [10, 37, 38] and should theoretically translate into distinct isotopic ratios. Hence, the use of isotopic analyses may provide a mechanistic understanding on how testate amoebae are trophically structured, highlighting the strategy and functional role of dominant species in the food web.
Here, we aim to track energy flow through microbial food chains from lower to higher trophic levels to dis-entangle the trophic structure of testate amoeba popula-tions in the microbial food web and to elucidate the role of the mixotrophic strategy in microbial food web func-tioning. We hypothesize that the trophic level—based on isotopic enrichment—of testate amoebae within the mi-crobial network relates to their feeding habit (bacterivory, algivory, and predation) and metabolism (heterotrophy vs. mixotrophy). Considering the key role of foraging traits such as density of prey in the feeding habit of testate amoebae [12], we also hypothesize that prey density affects the TP of testate amoebae. For this, we explored the microbial food web associated with Sphagnum moss by combining predation of testate amoebae (digestive vacuole contents and predator–prey associations), analy-ses of community density and biomass, and isotopic signatures (δ13
C and δ15N) of testate amoebae and their potential prey, including microalgae, cyanobacteria, roti-fers, and nematodes.
Materials and Methods
Study Area and Experimental Design
We sampled one peat monolith (43.5×33.5 cm, 22 cm in depth) in a macroscopically homogeneous Sphagnum fallax lawn in a peatland in the Jura Mountains (Sur-les-Seignes, Frambouhans-Les Ecorces, France; 47°18′ N, 6°79′ E) in late November 2010. The core was then placed under controlled conditions to quickly reactivate microbial life: an average temperature of 22 °C (day) and 18 °C (night), a light cycle of 16/8 h (light/dark), and a light intensity of 0.029 kW m−2. The depth to water table was maintained at constant level (6.5 cm below the top of the moss carpet) by adding stan-dardized solution (Volvic water =0.8 L every 2 days). We measured the physicochemical conditions of the peat core when the container was placed under controlled conditions. The temperature of the water table and at the surface was 5 and 12 °C, respectively; pH 4.4; and conductivity = 20.1 μS cm−1. After 15 days, these values increased (average temperature of the water table and at the surface was 17 and 20 °C, respectively; pH 4.9; and conductivity = 44.1μS cm−1) and stabilized.
After 15 days, the Sphagnum carpet from the peat monolith was subdivided into three subsamples. For each subsample, the totality of the living apical green segments of Sphagnum shoots (top 3 cm) was collected. We randomly sampled 5 g of fresh material (approximately 15 shoots) in each subplot and fixed it in 20 mL of glutaraldehyde (2 % final concentration) for microbial community analysis (density, biomass, and di-versity). The remaining material was used for isotopic analy-ses. Fully opened healthy capitula of Sphagnum (top 3 cm) were also sampled and lyophilized for isotopic analyses. No moss was taken from the marginal 5-cm border zone of the peat monolith to avoid possible border effects.
Microscopic and Isotopic Analyses
All microorganisms were extracted from S. fallax following the method used by Jassey et al. [12]. Microalgae, cyanobacteria, protozoa, rotifers, nematodes, and fungi were identified and quantified at ×400 magnification by means of inverted micros-copy (Olympus IX71) and following Uthermöhl's method [39]. Bacterial density was estimated by flow cytometry (FACSCalibur flow cytometer, Becton Dickinson). Fluorescent microbeads (molecular probes) 1μm in diameter were added to each sample as an internal standard. Bacteria were stained with SYBR Green I (1/10,000 final concentration) for 15 min in the dark and samples run at medium speed (40μl min−1). Bacterial size was estimated by epifluorescence microscopy using image analysis. The feeding habit of the dominant testate amoeba species, H. papilio, was studied in detail. To this aim, a total of 670, 715, and 500 specimens of H. papilio were observed by inverted microscopy in the three subsamples, respectively. Among active specimens, we distinguished between individ-uals with a prey within the shell and those that were actively feeding (determined as attached to prey or organic matter particles) to determine the feeding habit of this species, as described in Gilbert et al. [20]. Such an analysis was not possible for other testate amoeba species due to their low abundance.
The biovolume of each morphospecies or group was esti-mated using geometrical shapes and then converted to carbon using the following conversion factors: heterotrophic bacteria, 1 μm3=5.6×10⁻⁷ μgC [40]; cyanobacteria and microalgae, 1 μm3=1.2×10⁻⁷ μgC; ciliates and testate amoebae,
1-μm3
=1.1×10⁻⁷μgC [41]; fungi 1μm3=2.5×10⁻⁷μgC; and nematodes and rotifers, 1μm3=1.25×10⁻⁷μgC [42]. These data were expressed as microgram C per gram of S. fallax dry mass (DM).
Collection and preparation of microbial samples for isoto-pic analyses follow Jassey et al. [12]. We measured the isoto-pic signatures of cyanobacteria + microalgae (CA), fine or-ganic matter including bacteria (FOMB), two abundant groups of micrometazoa, small nematodes (<200 μm) and rotifers, and the dominant testate amoeba species Arcella
vulgaris, A. flavum, Bullinularia indica, Euglypha compressa, H. papilio, and Nebela tincta. Microorganisms were extracted from fresh moss by six successive rinsing of S. fallax using distilled water and successively filtered at 150, 120, 70, 50, 30, 20, and 11 μm (SEFAR NITEX®). The fraction under 11μm was used for FOMB and CA. For FOMB, the fraction was centrifuged at 15,000 rpm for 20 min. Then, the superna-tant was centrifuged again at 10,000 rpm for 10 min and the pellet was used for isotopic measurements. All other catego-ries were handpicked randomly and individually using micro-pipettes. Between 50 and 1,500 living testate amoeba speci-mens of the selected species were collected in each subsample, depending on their size (Table1). In order to obtain reliable measurements, 0.1 mg of matter is required for isotopic mea-surement. To reach this amount, some samples had to be pooled from the three subplots, A. vulgaris, A. flavum, B. indica, E. compressa, N. tincta, rotifers, and nematodes, and for these, no replicated measurements could be obtained. After 3 days, we also collected the CA biofilm using a micropipette. We estimated trophic positions (TP) following the method of Post [43]. We used S. fallax capitula as the baseline of the network for estimating TPs usingδ15N because we focused on microbial communities living in Sphagnum moss, and Sphag-num integrates temporal and spatial variations in isotopic signatures of basal resources [43].
Data Analysis
We used linear mixed effects models to test for relationships between (1) δ13C and δ15N signatures of microbial species/groups and between (2)δ15N and testate amoeba mor-phological traits (i.e., body size—length or diameter—shell aperture size and biovolume). These models were built while accounting for the pseudoreplication measurements in the peat monolith. We fitted all models including subplot as a random effect on the intercept, i.e., we corrected for the inflation of the residual degrees of freedom that would occur if we were using repeated measurements as true replicates. Regression diagnos-tics (leverage and outliers effects) and global validations of linear model assumptions (normality of the data distribution and homogeneity of variance) were examined and tested as described by Fox and Weisberg [44].
Differences in TP of the identified groups or species were assessed using nonparametric Mann–Whitney tests. A hier-archical cluster analysis using the Ward distance method and Bray–Curtis dissimilarity index were computed on δ13
C and δ15
N, isotopic nitrogen over carbon ratio, and trophic level values in order to identify feeding types of species and/or microbial groups. The robustness and the significance of the cluster were tested using bootstrap resampling (i.e., 1,000 resampling from the data).
All statistical analyses were performed with R 2.15.1 using the ade4, car, and pvclust packages [44–46].
Results
Microbial Community Structure
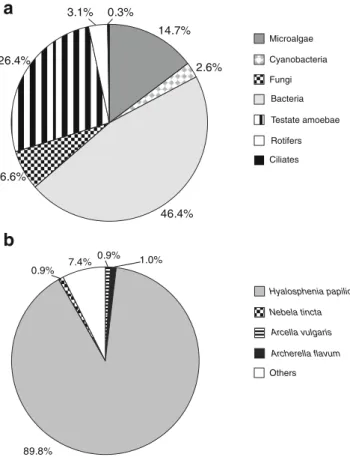
In terms of biomass, the microbial community was composed of 53 % decomposers (bacteria and fungi), 17.3 % microbial pri-mary producers (microalgae and cyanobacteria), and 29.8 % consumers (all other groups; Fig.1a). Bacteria accounted for almost half of the total biomass (726 ± 232 μgC g−1 DM), while fungi represented only 6.6 % (103 ± 53 μgC-g−1 DM; Fig. 1). Testate amoebae represented about one quarter of the total biomass (413 ± 176 μgC g−1 DM) and were the dominant group of consumers, while rotifers made up only 3.1 % of the total biomass (49±37μgC g−1DM; Fig.1a). Ciliates and nematodes together represented less than 1 % of the total biomass (3±1 and 2±0μgC g−1DM, respec-tively). Primary producers were dominated by microalgae (14.7 % of the total biomass), while cyanobacteria accounted for a much lower fraction of the total biomass (approximately 2.6 %). The green alga Cylindrocystis brebissonii was the more abundant species of microalgae with more than 90 % of the microalgal biomass, whereas Aphanothece nidulans and Anabaena cylindrica were the most abundant species of cyanobacteria (54 and 34 % of cyanobacteria biomass, respec-tively). H. papilio strongly dominated the testate amoeba community and accounted for 89.8 % of its biomass (Fig.1b).
Feeding Habit of H. papilio: Digestive Vacuole Contents Approach
On average, 25 % of the observed H. papilio specimens were associated with prey. Among the identified food sources, 80 % were microbial primary producers (CA=microalgae and cyanobacteria, e.g., A. nidulans), 12 % were fungi (including hyphae of ascomycetes and spores of Helicoon pluriseptatum), and 6 % were ciliates (e.g., Platyophrya sphagni) (Table 2). Predation on other testate amoebae (e.g., A. flavum), rotifers (e.g., Habrotrocha sp. and Colurella sp.), and nematodes was observed only rarely (<1 % of the total identified predator–prey associations). These proportions matched very closely the density of these organisms in the environment (Table2). These frequen-cies represented, in terms of grazed biomass, 9.8 % of the biomass of CA, 20.1 % of that of fungi, and 49.3 % of that of ciliates. Isotopic Composition of the Microbial Food Web
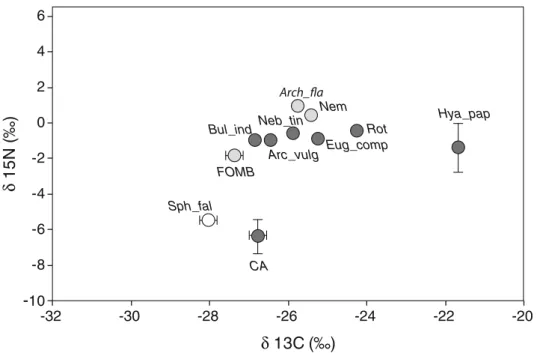
The isotopic values of cyanobacteria and microalgae (CA) (δ13C=−26.8 ‰; δ15N=−6.7 ‰) were almost identical to that of Sphagnum (δ13C=−28.0 ‰; δ15N=−5.4 ‰), which is there-fore used as a baseline for further interpretation. By contrast, all other microbial groups yielded enrichedδ13C and δ15N values relative to the baseline value determined from S. fallax shoots (Fig.2; Table1).
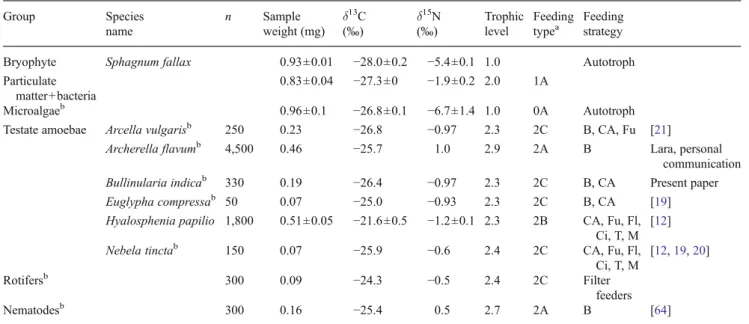
Table 1 Number of specimen sampled (n); weight of species sampled (in milligrams, mean ± standard error); isotopic ratios (in per mille, mean ± standard error) of carbon and nitrogen in S. fallax, microbial groups, and
testate amoeba species; trophic level; feeding type; and strategy of mi-crobial groups and testate amoeba species
Group Species name n Sample weight (mg) δ13 C (‰) δ 15 N (‰) Trophiclevel Feeding typea Feeding strategy Bryophyte Sphagnum fallax 0.93±0.01 −28.0±0.2 −5.4±0.1 1.0 Autotroph Particulate
matter+bacteria
0.83±0.04 −27.3±0 −1.9±0.2 2.0 1A
Microalgaeb 0.96±0.1 −26.8±0.1 −6.7±1.4 1.0 0A Autotroph Testate amoebae Arcella vulgarisb 250 0.23 −26.8 −0.97 2.3 2C B, CA, Fu [21]
Archerella flavumb 4,500 0.46 −25.7 1.0 2.9 2A B Lara, personal
communication Bullinularia indicab 330 0.19 −26.4 −0.97 2.3 2C B, CA Present paper
Euglypha compressab 50 0.07 −25.0 −0.93 2.3 2C B, CA [19]
Hyalosphenia papilio 1,800 0.51±0.05 −21.6±0.5 −1.2±0.1 2.3 2B CA, Fu, Fl, Ci, T, M
[12] Nebela tinctab 150 0.07 −25.9 −0.6 2.4 2C CA, Fu, Fl,
Ci, T, M
[12,19,20]
Rotifersb 300 0.09 −24.3 −0.5 2.4 2C Filter
feeders
Nematodesb 300 0.16 −25.4 0.5 2.7 2A B [64]
Food sources: B bacteria, Fu fungi, CA cyanobacteria and microalgae, Fl flagellates, Ci ciliates, T testate amoebae, M micrometazoan (rotifers, nematodes). Feeding type: 0A photosynthetic organism (protist), 1A OM feeders, 2A bacterivores, 2B primary producer feeders, 2C bacteria and primary producer feeders
a
Adaptive from [8]
b
Theδ13C andδ15N signatures of consumers covered a broad range of values, from−27.3 to −21.6 ‰ and from −1.9 to +1 ‰, respectively. Isotopic values were significantly higher in con-sumers (testate amoebae, rotifers, and nematodes) as compared to primary producers (S. fallax and CA; P=0.04, r=0.5). For instance, the isotopic diagram showed that A. flavum was more enriched in δ13C (+1.6 ‰) and δ15N (+2.9‰) than FOMB (Fig.2). Isotopic values of A. vulgaris (δ13C=+0.3‰; δ15N= +2.1‰), B. indica (δ13C=+0.7‰; δ15N=+3‰), and N. tincta (δ13C=+0.3‰; δ15N=+1.7‰) were also consistently enriched relative to those of their supposed diet (CA) (Fig.2; Table1).
Our results also showed that the mixotrophic species H. papilio was highly enriched inδ13C (+5.2‰), as compared to its diet (CA) (Fig. 2; Table 2). This was not the case for the other mixotrophic species studied (A. flavum).
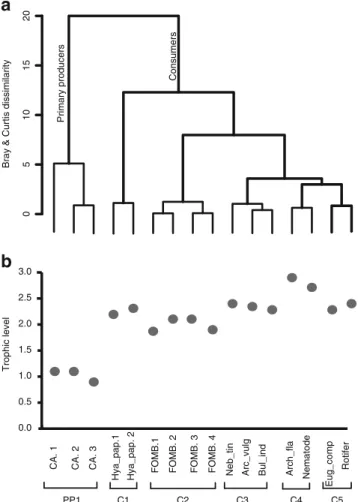
Translating these results into TP, primary producers (CA) had the same trophic level as S. fallax in the microbial food web (TP=1), while FOMB (TP=2) and consumers (TP ranged from 2.3 to 2.9) had significant higher trophic level than primary producers (P<0.05) (Table1; Fig. 3b). In the cluster analysis, microbial groups were split into primary producers and consumers. The microbial consumers were further split into five subgroups corresponding to different feeding strategies (Fig. 3a, b; Table 1). The first subgroup corresponded to mixotrophic algivores (C1) composed of H. papilio (Fig.3). The second subgroup included decomposers (FOMB; C2), while the third and fourth subgroups corresponded to bacterivores (C3), including A. flavum and nematodes, and heterotrophic algivores (C4), including A. vulgaris, B. indica, and N. tincta (Fig.3; Table1). The fifth subgroup (C5) included E. compressa and rotifers and corresponded to a mix between algivores and bacterivores (Fig. 3; Table 1). Furthermore, we found that the trophic level of H. papilio was linked to the contribution of ciliates and CA to its total diet (Fig. 4). We found that the trophic level of H. papilio increased with the rise of ciliates and the decrease of CA in its total diet (Fig.4a, b).
Theδ15N values of testate amoebae were negatively cor-related to simple morphological traits such as the size of their shell aperture (r=−0.86, P=0.02) and their biovolume (r=−0.88, P=0.01), while no significant correlation was found with their body size (length or diameter) (r=−0.72, P=0.07, ANOVA).
Discussion
We investigated the trophic structure of the microbial food web associated to Sphagnum moss by combining the analyses of microbial density and biomass, stable isotopes (δ13
C and δ15
N) of microbial groups, and digestive vacuole content of Ciliates Microalgae Cyanobacteria Fungi Testate amoebae Rotifers Bacteria 0.9% 1.0% 89.8% 0.9% 7.4% Hyalosphenia papilio Nebela tincta Others Archerella flavum Arcella vulgaris
a
b
14.7% 2.6% 46.4% 6.6% 26.4% 3.1% 0.3%Fig. 1 a Relative biomass of different microbial groups (percent of the total microbial community) in a S. fallax carpet. b Relative abundance (in percent) of the main testate amoeba species (percent of the total testate amoeba community)
Table 2 Relative proportion of the identified prey ingested by H. papilio. Relative proportion of the abundance of microbial groups in S. fallax, excluding bacteria. Relative proportion of the biomass of the identified prey ingested by H. papilio. CA microalgae and cyanobacteria
Frequency of the preys ingested by H. papilio (%) Frequency of identified prey (%) Frequency of ingested organisms in terms of biomass (%) CA 80 82.4 9.8 Fungi 12 11.8 20.1 Ciliates 6 0.4 49.3 Testate amoebae 0 4.7 <0.1 Rotifers 0.6 0.5 0.8 Nematodes 0 0.2 <0.1
key microbial consumers. We found that the trophic level of microbial organisms inferred from stable isotopes was in line with expectations; bacteria (FOMB) have a higher trophic level than autotrophs (S. fallax, CA), and microbial consumers have a higher trophic level than both decomposers and auto-trophs. We further showed that isotopic signatures of moss and CA did not differ and that both autotrophic microorgan-isms and Sphagnum mosses have similar directional shifting in food web space. This agrees with our assumption that autotrophs can be used as the baseline of the microbial food web associated to Sphagnum moss.
Trophic Structure of the Microbial Food Web
In most cases, we found isotopic enrichments in line with those of aquatic and soil food web in which consumerδ15N signatures were higher than 3‰ [43, 47]. Based on these isotopic enrichments and identified feeding habit, we showed two trophic pathways in our microbial network: an herbivorous pathway and a detritivorous pathway. Firstly, we found a significant enrichment in δ15N between microbial autotrophs (CA) and microbial consumers such as N. tincta, E. compressa, H. papilio, A. vulgaris, and rotifers, charac-terizing the herbivorous pathway. These isotopic enrich-ments indicated that these consumers mainly fed on CA in the current study. This agrees with our feeding observations on H. papilio, as well as with previous observations of feeding habits for A. vulgaris, E. compressa, and rotifers [19,21,48,49]. Secondly, the significantδ15N enrichment
between FOMB and consumers such as A. flavum and nem-atodes suggests the existence of a detritivorous pathway. A. flavum has been described as exclusively autotrophic [32], but its isotopic signature rather indicated that this species mainly fed on bacteria or fine organic particles (FOMB). Although food particles are rarely observed in A. flavum vacuoles, this does not exclude the possibility that bacteria occur in their vacuole. Indeed, bacteria are difficult to iden-tify in testate amoeba vacuoles when using direct observa-tion with epifluorescence microcopy (personal observaobserva-tion). Obviously, the recorded isotopic signatures do not exclude that microbial consumers feed on additional food sources and/or intermediate trophic level [50,51], as clearly showed for H. papilio.
More surprising is the difference between the isotopic signatures of H. papilio and N. tincta between this study and the one of Jassey et al. [12]. These results reflect intersite differences, showing that the isotopic signatures of a given species can be quite variable in space and/or time depending on environmental conditions [50]. However, the similar sig-nature of the baseline (i.e., S. fallax) between the two studies also underlines differences of intersite food web functioning. The linkages between the TP of H. papilio and the contribu-tion of the main categories of prey to its total diet agree with the hypothesis that differences in prey availability influence the TP of testate amoebae. Indeed, isotopic signatures and trophic levels of top predators, H. papilio and N. tincta (TPH. papilio, 2.3 and TPN. tincta, 2.4), were significantly lower than those recently obtained by Jassey et al. [12] (TPH. papilio, 3.5
Sph_fal
-
10 -8 -6 -4 -2 0 2 4 6 -32 -30 -28 -26 -24 -22 -20δ
1
5
N (
‰
)
δ
13C (‰)
CA FOMB Hya_pap Nem Neb_tin Bul_ind Arc_vulg Eug_comp RotFig. 2 Stable isotope (δ13C andδ15N) food web diagram of the major microbial groups and testate amoeba taxa in S. fallax. Symbols are as follows:
Sph_fal, S. fallax; CA, cyanobacteria + microalgae; Rot, rotifers; Nem, nematodes; FOMB, fine organic matter in association with bacteria; Arc_vulg, A. vulgaris; Arch_fla, A. flavum; Bul_ind, B. indica; Eug_comp, E. compressa; Hya_pap, H. papilio; and Neb_tin, N. tincta. Dark gray circles represent the herbivory pathway and light gray circles the detritivory pathway
and TPN. tincta, 4.2). Such results are not surprising when we consider the low density of the potential energetic prey for H. papilio and N. tincta recorded in this study (e.g., ciliates,
rotifers, and nematodes). Because of the very low relative abundances of its preferential food sources (i.e., ciliates; [12]), our results suggest that H. papilio adapts its feeding behavior by targeting the most abundant and available food sources (e.g., CA). This agrees with the predictions of optimal foraging theory, which states that organisms forage in such a way as to maximize their net energy intake. Optimally forag-ing organisms can minimize the energy cost of food uptake by targeting the most abundant and easily captured prey [52,53]. We estimated that predation of H. papilio on ciliates repre-sented up to 50 % of the total standing biomass of ciliates. This suggests that the density of ciliates was probably lower than a threshold allowing higher active predation of H. papilio on this otherwise energetically optimal prey.
Our results reveal that testate amoeba species occupy different TPs in the microbial food web and that these dif-ferences could be related to their feeding type. Conversely, this study illustrates that it is difficult to reliably infer the TP of testate amoebae using relatively simple morphological traits without taking into account prey stocks. Food webs usually exhibit a surprisingly consistent topological archi-tecture across different ecosystem types [4,54] mediated by fundamental constraints where species feed on nearly con-tiguous ranges of mostly lower-ranked species [55]. In gen-eral, species with large body size occupy high trophic levels and consume many food sources, whereas smaller species share low trophic levels with more specific food strategies (e.g., bacterivory; [56]). Body size is thus a fundamental indicator of trophic level in food webs because it places constraints on many biological variables, including crucial foraging traits (energy content of resources, handling times, attack rates, and prey density) [57–60]. However, a strong relationship between body size (here, testate amoebae shell length or diameter) and TP cannot be found for consumers that exploit a wide range of prey body sizes [7,59], as shown here with H. papilio and N. tincta. Nevertheless, we found
0 20 40 60 80
CA Fungi Ciliates Others
H. papilio
(present study)
H. papilio
(Jassey et al. 2012)
Contribution to total diet (%)
a
b
0 1 2 3 4 0.1 1.7 ratio ciliate / CA in diet of H. papilio T rophic position present study Jassey et al. 2012 Fig. 4 a Contribution of foodsources to the diet of H. papilio. Error bars SE, CA microalgae + cyanobacteria. b Trophic level of H. papilio vs. the contribution of ciliates and CA to total diet of H. papilio. This figure includes some results from Jassey et al. [12]
Eug_comp
Rotifer
CA. 1 CA. 2 CA. 3
PP1
Hya_pap.1 Hya_pap. 2 FOMB.1 FOMB. 2 FOMB. 3 FOMB. 4
C1 C2
Arc_vulg Bul_ind Neb_tin Arch_fla Nematode
C4 C5 C3 0.0 0.5 1.0 1.5 2.0 2.5 3.0 Trophic level
b
Bray & Curtis dissimilarity
0 5 10 15 20 Primary producers Consumers
a
Fig. 3 a Hierarchical clustering (Bray and Curtis index method) of microbial groups and testate amoeba species from S. fallax based on theirδ13C andδ15N, isotopic nitrogen and carbon ratio, and trophic level (see text for details). b Trophic level of the different testate amoeba species and microbial groups
that the size of shell aperture and biovolume were inversely proportional to the TP of testate amoebae in the microbial network, while usually these morphological traits are con-sidered as indicators of high trophic level [12, 25, 27]. Again, such results illustrate the importance of foraging traits such as the density of preferential food sources on the TP of consumers such as H. papilio and N. tincta and, therefore, on the food web structure. Indeed, if we compare these results to those of Jassey et al. [12], these data indicate that two morphologically similar populations of the same species (e.g., H. papilio) may occupy very different TPs, thus alter-ing any overall relationship between morphology and TP in Sphagnum-associated food web. Furthermore, the inverse relationship between morphological trait sizes and trophic levels showed that smaller testate amoeba species such as A. flavum—found as a consumer of FOMB—occupied the top of the food web. This suggested that bacterivores received more translocated nitrogen from the detritivorous pathway than herbivores from the herbivorous pathway, giving a greater functional role to bacterivores. This isotopic signa-ture of bacteria—and thus their trophic level—depends on the signature of the detrital source, which may sometimes be higher than that of autotrophs [50]. Therefore, a switch from an herbivorous- to a detritivorous-dominant pathway could break down the morphological relationships between trait size and trophic level.
Algal Endosymbiont Contribution to Host H. papilio Diet The highly enrichedδ13C content of H. papilio (i.e.,−22 ‰ on average) suggested that this species used another non-identified δ13
C baseline than other testate amoeba species (i.e., for which the average was−26 ‰), explaining why this species showed such distinct isotopic patterns. An alternative hypothesis is that H. papilio used another source of carbon than CA and ciliates such as their endosymbiotic algae. Few studies have attempted to quantify the energetic benefits of endosymbiotic algae of mixotrophic species, but Schönborn [32] suggested that H. papilio could probably live without food sources using these endosymbiotic algae as alternate energy source. The low avail-ability of energetic resources probably led H. papilio to use its endosymbionts as complementary energy source and, thus, to receive more translocated carbon from the stimulated activity of its endosymbionts than from CA, explaining why the δ13C signature of H. papilio was so high. By analogy to our results, Bergschneider and Muller-Parker [61] showed that the δ13C signature of zoochlorellae increased from−25 to −20 ‰ when they were used as complementary energy source in Anthopleura elegantissima. These authors also showed that zoochlorellae anemone exhibited distinctly lower patterns ofδ15N values than non-zoochlorellae anemone, indicating that symbiotic anemones received nutrition from both external (heterotrophic) and internal (translocated algal products) sources. Although our results do not
allow drawing strong conclusions about the use of endosymbi-onts as a complementary source of energy in H. papilio speci-mens, they suggest that resource availability may play a funda-mental role in the use of endosymbionts as energy source.
The difference between the isotopic signatures of the two mixotrophic species studied (H. papilio and A. flavum) pro-vides evidence in support of the hypothesis that resource availability may play a fundamental role in the use of endo-symbionts as energy source. Although obvious morphological differences in overall size and size of shell aperture occur between these mixotrophic species, their range of prey avail-able is likely to explain their different isotopic signatures. These results suggest that mixotrophic species may become more heterotrophic with abundant and available food sources, which alters their functional role in food webs and the carbon cycle. Indeed, a shift toward more heterotrophic nutrition may change the isotopic signature of mixotrophic specimens and, therefore, their functional role from primary production to-ward consumers [11]. Such results highlight that dynamics in prey–predator abundance could modify the functional role of mixotrophic species in the microbial food web. Furthermore, these results also suggest that mixotrophic species can easily outcompete other competitors when food sources are rare in networks by shifting on their endosymbionts [10]. Hence, our results provide reason to expect that mixotrophic life history trait plays a key role for both prey abundance and microbial food web structure associated to Sphagnum.
In conclusion, our study demonstrates that nitrogen and carbon isotopic signatures of microorganisms are useful for estimating the food web structure of the microbial network associated to Sphagnum. These results show that testate amoeba consumers occupy different trophic levels within the microbial food web, depending on their feeding behavior, the density of their food resources, and their metabolism (i.e., mixotrophy vs. heterotrophy). Our findings provide experi-mental support for the novel hypothesis that mixotrophy has key implications in food web structure and functioning [62,
63]. Given the key position of mixotrophs in the microbial community in peatlands, changes in their functional role from primary producers to consumers (or vice versa) may cascade through food webs, altering species interactions as well as the magnitude and direction of carbon fluxes.
Acknowledgments This research is a contribution of the ANR PEATWARM project (Effect of moderate warming on the functioning of Sphagnum peatlands and their function as carbon sink) and the μPOL-AIR project (Use of Sphagnum-peatlands to quantify the deposition of long-range air pollutants and to evaluate their impact on environment). PEATWARM is supported by the French National Agency for Research under the “Vulnerability, Environment—Climate” Program (ANR-07-VUL-010) andμPOL-AIR by PRIMEQUAL program (support of French Ministry of Environment and ADEME) (2010-Q.3-Chorus2100082984). Further funding was provided to V.E.J.J. by the Franche-Comté Region, to C.M. by μPOL-AIR project, and to E.A.D.M. and A.P.C. by the
University of Neuchâtel. The authors would like to thank T. Sime-Ngando and J. Colombet (University of Clermont-Ferrand, France) for their help with the flow cytometry and two anonymous reviewers for their valuable comments on the manuscript.
References
1. Thompson RM, Brose U, Dunne JA, Hall RO Jr, Hladyz S, Kitching RL, Martinez ND, Rantala H, Romanuk TN, Stouffer DB, Tylianakis JM (2012) Food webs: reconciling the structure and function of biodiversity. Trends Ecol Evol 27:689–697 2. Bascompte J (2010) Structure and dynamics of ecological
net-works. Science 329:765–766
3. De Deyn GB, Raaijmakers CE, van Ruijven J, Berendse F, van der Putten WH (2004) The response of nematodes from different tro-phic levels in the soil food web to the identity and diversity of plant species. Oikos 106:576–586
4. Ings TC, Montoya JM, Bascompte J, Blüthgen N, Brown L, Dormann CF, Edwards F, Figueroa D, Jacob U, Jones JI, Lauridsen RB, Ledger ME, Lewis HM, Olesen JM, Van Veen FJF, Warren PH, Woodward G (2009) Ecological networks—beyond food webs. J Anim Ecol 78:253–269
5. Rooney N, McCann KS (2012) Integrating food web diversity, structure and stability. Trends Ecol Evol 27:40–46
6. Stouffer DB, Sales-Pardo M, Sirer MI, Bascompte J (2012) Evolutionary conservation of species’ roles in food webs. Science 335:1489–1492 7. Kuwae T, Miyoshi E, Hosokawa S, Ichimi K, Hosoya J, Amano T,
Moriya T, Kondoh M, Ydenberg RC, Elner RW (2012) Variable and complex food web structures revealed by exploring missing trophic links between birds and biofilm. Ecol Lett 15:347–356 8. Pascal PY, Dupuy C, Richard P, Rzeznik-Orignac J, Niquil N
(2008) Bacterivory of a mudflat nematode community under dif-ferent environmental conditions. Mar Biol 154:671–682
9. Petchey OL, McPhearson PT, Casey TM, Morin PJ (1999) Environmental warming alters food-web structure and ecosystem function. Nature 402:69–72
10. Tittel J, Bissinger V, Zippel B, Gaedke U, Bell E, Lorke A, Kamjunke N (2003) Mixotrophs combine resource use to outcompete specialists: implications for aquatic food webs. Proc Natl Acad Sci U S A 100:12776–12781
11. Wilken S, Huisman J, Naus-Wiezer S, Donk E (2013) Mixotrophic organisms become more heterotrophic with rising temperature. Ecol Lett 16:225–233
12. Jassey VEJ, Shimano S, Dupuy C, Toussaint ML, Gilbert D (2012) Characterizing the feeding habits of the testate amoebae Hyalosphenia papilio and Nebela tincta along a narrow “Fen-Bog” gradient using digestive vacuole content and13
C and15N isotopic analyses. Protist 163:451–464
13. Anderson C, Cabana G (2009) Anthropogenic alterations of lotic food web structure, evidence from the use of nitrogen isotopes. Oikos 118:1929–1939
14. Carscallen WMA, Vanderberg K, Lawson JM, Martinez ND, Romanuk TN (2012) Estimating trophic position in marine and estuarine food webs. Ecosphere 3:1–20
15. Mao ZG, Gu XH, Zeng QF, Zhou LH, Sun MB (2012) Food web structure of a shallow eutrophic lake (Lake Taihu, China) assessed by stable isotope analysis. Hydrobiol 683:173–183
16. Schmidt SN, Olden JD, Solomon CT, Vander Zanden MJ (2007) Quantitative approaches to the analysis of stable isotope food web data. Ecology 88:2793–2802
17. Vander Zanden MJ, Rasmussen JB (1999) Primary consumer delta C-13 and delta N-15 and the trophic position of aquatic consumers. Ecology 80:1395–1404
18. Mitchell EAD, Charman DJ, Warner BG (2008) Testate amoebae analysis in ecological and paleoecological studies of wetlands, past, present and future. Biodivers Conserv 17:2115–2137
19. Gilbert D, Amblard C, Bourdier G, Francez AJ, Mitchell EAD (2000) Le régime alimentaire des thécamoebiens (Protista, Sarcodina). Année Biol 3:57–68
20. Gilbert D, Mitchell EAD, Amblard C, Bourdier G, Francez AJ (2003) Population dynamics and food preferences of the testate amoeba Nebela tincta major–bohemica–collaris complex (Protozoa) in a Sphagnum peatland. Acta Protozool 42:99–104 21. Laybourn J, Whymant L (1980) The effect of diet and temperature
on reproductive rate in Arcella vulgaris Ehrenberg (Sarcodina, Testacida). Oecologia 45:282–284
22. Yeates GW, Foissner W (1995) Testate amoebae as predators of nematodes. Biol Fertil Soils 20:1–7
23. Meyer C, Bernard N, Moskura M, Toussaint ML, Denayer F, Gilbert D (2010) Effects of urban particulate deposition on micro-bial communities living in bryophytes, an experimental study. Ecotoxicol Environ Saf 73:1776–1784
24. Meyer C, Gilbert D, Gillet F, Moskura M, Franchi M, Bernard N (2012) Using bryophyte–testate amoebae microsystems as indica-tors of atmospheric pollution at three different sites (rural, urban and industrial). Ecol Indic 13:144–151
25. Meyer C, Desalme D, Bernard N, Binet P, Toussaint ML, Gilbert D (2013) Using testate amoebae as potential biointegrators of atmo-spheric deposition of phenanthrene (polycyclic aromatic hydrocar-bon) on “moss/soil interface–testate amoebae community” microecosystems. Ecotoxicology 22:287–294
26. Aoki Y, Hoshino M, Matsubara T (2007) Silica and testate amoebae in a soil under pine-oak forest. Geoderma 142:29–35
27. Jassey VEJ, Chiapusio G, Binet P, Buttler A, Laggoun-Défarge F, Delarue F, Bernard N, Mitchell EAD, Toussaint ML, Francez AJ, Gilbert D (2013) Above- and belowground linkages in Sphagnum-peatland: warming affects plant–microbial interactions. Glob Chang Biol 19:811–823
28. Schröter D, Wolters V, De Ruiter PC (2003) C and N mineralization in the decomposer food webs of a European forest transect. Oikos 102:294–308
29. Wilkinson DM, Mitchell EAD (2010) Testate amoebae and nutrient cycling with particular reference to soils. Geomicrobiol J 27:520–533 30. Fournier B, Malysheva E, Mazei Y, Moretti M, Mitchell EAD (2012) Toward the use of testate amoeba functional traits as indi-cator of floodplain restoration success. Eur J Soil Biol 49:85–91 31. Chacharonis P (1956) Observations on the ecology of protozoa
associated with Sphagnum. J Protozool 3:11
32. Schönborn W (1965) Untersuchungen über die Zoochlorellen-Symbiose der Hochmorr-Testacean. Limnology 5:173–176 33. Booth RK, Sullivan ME, Sousa VA (2008) Ecology of testate
amoebae in a North Carolina pocosin and their potential use as environmental and paleoenvironmental indicators. Ecoscience 15:277–289
34. Heal OW (1962) Abundance and microdistribution of testate amoe-bae (Protozoa: Rhizopoda) in Sphagnum. Oikos 13:35–47 35. Heal OW (1964) Observations on the seasonal and
spatial-distribution of Testacea (Protozoa, Rhizopoda) in Sphagnum. J Anim Ecol 33:395–412
36. Heal OW (1961) The distribution of testate amoebae (Rhizopoda: Testaecea) in some fens and bogs in Northern England. Zool J Linnean Soc 44:369–382
37. Flynn KJ, Stoecker DK, Mitra A, Raven JA, Glibert PM, Hansen PJ, Graneli E, Burkholder JM (2012) Misuse of the phytoplankton –zoo-plankton dichotomy: the need to assign organisms as mixotrophs within plankton functional types. J Plankton Res. doi:10.1093/plankt/fbs062
38. Hartmann M, Grob C, Tarran GA, Martin AP, Burkill PH, Scanlan DJ, Zubkov MV (2012) Mixotrophic basis of Atlantic oligotrophic ecosystems. Proc Natl Acad Sci U S A 109:5756–5760
39. Uthermölh H (1958) Zur vervollkommnung der quantative phytoplankton-methodik. Mitteilungen aus Institut Verhein Limnology 3:1–38
40. Bratbak G (1985) Bacterial biovolume and biomass estimations. Appl Environ Microbiol 49:1488–1493
41. Weisse T, Muller H, Pintocoelho RM, Schweizer A, Springmann D, Baldringer G (1990) Response of the microbial loop to the phyto-plankton spring bloom in a large prealpine lake. Limnol Oceanogr 35:781–794
42. Gilbert D, Amblard C, Bourdier G, Francez AJ (1998) The micro-bial loop at the surface of a peatland, structure, function, and impact of nutrient input. Microb Ecol 35:83–93
43. Post DM (2002) The long and short of food-chain length. Trends Ecol Evol 17:269–277
44. Fox J, Weisberg S (2011) An R companion to applied regression, 2nd edn. Sage, Thousand Oaks
45. Oksanen J, Blanchet G, Kindt R, Legendre P, O’Hara RG, Simpson GL, Solymos P, Stevens MHH, Wagner H (2010) Vegan, commu-nity ecology package. R package version 1.17-1. Available athttp:// CRAN.R-project.org/package=vegan
46. R Development Core Team (2012) R, a Language and Environment for Statistical Computing. R Foundation for Statistical Computing, Vienna 47. Kohzu A, Iwata T, Kato M, Nishikawa J, Wada E, Amartuvshin N, Namkhaidorj B, Fujita N (2009) Food webs in Mongolian grass-lands: the analysis of13C and15N natural abundances. Isot Environ Health Stud 45:208–219
48. Segers H (2008) Global diversity of rotifers (Rotifera) in freshwa-ter. Hydrobiol 595:49–59
49. Sharma BK (2005) Rotifer communities of floodplain lakes of the Brahmaputra basin of lower Assam (NE India), biodiversity, distri-bution and ecology. Hydrobiol 533:209–221
50. Ponsard S, Arditi R, Jost C (2000) Assessing top-down and bottom-up control in a litter-based soil macroinvertebrate food chain. Oikos 89:524–540
51. Scheu S, Falca M (2000) The soil food web beech forests (Fagus sylvatica) of contrasting hulus type: stable isotope analysis of a
macro- and a mesofauna-dominated community. Oecol 123:285– 296
52. Akin S, Winemiller KO (2008) Body size and trophic position in a temperature estuarine food web. Acta Oecol 33:144–153 53. Stephens DW, Krebs JR (1986) Foraging Theory. Princeton
University Press, Princeton
54. Schneider FD, Scheu S, Brose U (2012) Body mass constraints on feeding rates determine the consequences of predator loss. Ecol Lett 15:436–443
55. Stouffer DB, Camacho J, Amaral LAN (2005) Quantitative analy-sis of the local structure of food webs. Ecology 86:1301–1311 56. Brose U, Dunne JA, Montoya JM, Petchey OL, Schneider FD,
Jacob U (2012) Climate change in size-structured ecosystems in-troduction. Phil Trans R Soc Biol Sci 367:2903–2912
57. Barnes C, Maxwell D, Reuman DC, Jennings S (2010) Global patterns in predator–prey size relationships reveal size dependency of trophic transfer efficiency. Ecology 91:222– 232
58. Heckmann L, Drossel B, Brose U, Guill C (2012) Interactive effects of body-size structure and adaptive foraging on food-web stability. Ecol Lett 15:243–250
59. Layman CA, Winemeller KO, Arrington DA, Jepsen DB (2005) Body size and trophic position in a diverse tropical food web. Ecology 86:2530–2535
60. Thierry A, Petchey OL, Beckerman AP, Warren PH, Williams RJ (2011) The consequences of size dependent foraging for food web topology. Oikos 120:493–502
61. Bergschneider H, Muller-Parker G (2008) Nutritional role of two algal symbionts in the temperate sea anemone Anthopleura elegantissima Brandt. Biol Bull 215:73–88
62. Lopez-Urrutia A, San Martin E, Harris RP, Irigoien X (2006) Scaling the metabolic balance of the oceans. Proc Natl Acad Sci U S A 103:8739–8744
63. Yvon-Durocher G, Jones JI, Trimmer M, Woodward G, Montoya JM (2010) Warming alters the metabolic balance of ecosystems. Philos Trans R Soc B Biol Sci 365:2117–2126
64. 2Yeates GW, Bongers T, Degoede RGM, Freckman DW, Georgieva SS (1993) Feeding-habits in soil nematode families and genera—an outline for soil ecologists. J Nematol 25:315–331