Tax morale in Latin America∗
BENNO TORGLER
Georgia State University, Andrew Young School of Policy Studies, Atlanta, U.S.A.; University of Basel, Wirtschaftswissenschaftliches Zentrum (WWZ), Basel, and CREMA Center for Research in Economics, Management and the Arts, Switzerland; E-mail:
ecobtx@langate.gsu.edu and benno.torgler@unibas.ch
Accepted 22 October 2003
Abstract. In the tax compliance literature, there is a lack of empirical evidence on the degree of tax morale in developing countries. As a novelty, this paper focuses thus on Latin America, analysing tax morale as a dependent variable and searching for factors that systematically affect tax morale, working with the two data sets Latinobarómetro and World Values Survey. Our findings indicate that there is a significant correlation between tax morale and the size of shadow economy. Furthermore, people who said they knew/have heard about practised tax avoidance have a significantly lower tax morale than others. Looking at individuals’ perception of reasons for tax evasion we found that the tax burden, lacking honesty, and corruption are seen as the main factors. We observed a significantly lower tax morale in South Amer-ica/Mexico than in the Central American/Caribbean area. Furthermore, trust in the president and the officials, the belief that other individuals obey the law and a pro democratic attitude have a significant positive effect on tax morale.
1. Introduction
Tax morale and tax compliance are important factors for guaranteeing an adequate provision of public goods. Especially in times when the costs of run-ning public office have strongly increased, governments search for strategies to generate revenues. A high degree of tax evasion creates misallocations in resource use (see Alm and Martinez-Vazquez, 2001). In developing countries tax evasion is often widespread (see, e.g., de Soto, 2000). Such a high level of tax evasion reduces government’s ability to work and thus to provide ad-equate services. Over the last decades, developing countries as, e.g., in Latin America have made considerable efforts to implement major reforms in tax policies and to improve the effectiveness of their tax administrations:
“These efforts frequently took place under unfavourable macroeconomic circumstances. Tax administrators often had to cope with a barrage of
∗ For advice and suggestions thanks are due to Doris Aebi, Ren´e L. Frey and an
an-onymous referee. Financial support from the Swiss National Science Foundation is gratefully acknowledged.
tax reforms, interspersed with numerous ad hoc changes in tax rates, ex-emptions, and payment periods introduced largely for revenue reasons” (Casanegra de Jantscher and Bird, 1992: 1–2).
Empirical evidence is rare in the tax compliance literature. Pyle (1993) points out in a survey: “The solution should lie in the results of empirical studies. Alas, the current harvest of such studies is remarkably thin” (p. 73).
However, it is interesting to notice that there is hardly any empirical evid-ence about the degree of tax morale in developing countries. Thus, the focus on Latin America in this paper is novel. We analyse tax morale as a depend-ent variable and search for factors that systematically affect tax morale. It is important to analyse the determinants that influence tax morale in devel-oping countries, as the environment is different from developed countries. On the other hand, if we observe similar tendencies, some effects might be independent of cultural environments. To get a robust picture we are going to analyse two different data sets: the World Values Survey (WVS) and the Latinobarómetro. The WVS covers the years from 1981 to 1997 and the Lat-inobarómetro the year 1998. In Section 2 we are going to give an overview of the tax system and tax administration in Latin America. Section 3 starts with a descriptive analysis evaluating the degree of tax morale in different Latin American countries and checking if there is a correlation between tax morale, tax avoidance and the size of shadow economy. In a second step, a cross-section analysis will be made with multiple regressions pooling developing countries and differentiating between Middle and South America. The paper finishes with some concluding remarks.
2. Tax morale, tax evasion, and the state
Taxation in developing countries is a challenging topic and has attracted in-creasing attention in the last two decades. Many problems observed as, for example, poor administration performance resulting in a lack of tax revenues, tax structures where considerations of horizontal and vertical tax equity are not integrated, governmental and economic instability. The levels of tax rev-enues in percent of the GDP are much lower than in OECD countries (around 18 percent compared to around 40 in OECD countries, see, e.g., Tanzi and Zee, 2000: 303).
Most countries traditionally have no self-filling procedure but apply de-ductions. Bahl and Martinez-Vazquez (1992) criticise that developing coun-tries imitate the complex tax structures of developed councoun-tries despite their disadvantage of having lower tax administration capabilities. Tax reforms in the 80s had the intention to increase the stability in the revenue
sys-tem. The 90s fiscal crises might have been motivating factors for reforms (see Das-Gupta and Mookherjee, 1995). Jenkins (1995) points out that the income tax has performed very badly in Latin America, tending to yield modest amounts of revenue. Characteristics as, for example, a large agri-cultural sector, a high degree of shadow economy, small firms, and a small proportion of wage income according to Tanzi and Zee (2000) make it dif-ficult for developing countries to rely on modern taxeslike personal income taxes (see also, Burgess and Stern, 1993). The uneven income distribution and the political and financial power being concentrated in the top prevents modern tax reforms introducing personal income or property taxes. Thus, it is not surprising that radical reforms can hardly be seen in such countries (for a reform overview see, e.g., Bejakovi´c, 2000; Cabezas, 1992; Burgess and Stern, 1993; Martinez-Vazquez, 2001; McLure and Pardo, 1992; Silvani and Radano, 1992).
An important aim of a tax reform is in general to find a good way to raise revenues, promote equity and efficiency, without crowding out tax morale.
2.1. Tax morale and tax evasion
There is a lively discussion on how tax attitudes are related to individuals’ action. Is there a correlation between tax morale and tax evasion? In a gen-eral context, social psychology literature has intensively focused on this topic (see, e.g., Ajzen and Fishbein, 1980). Lewis (1982) points out that “it could be that tax evasion is the only channel through which taxpayers can express their antipathy (. . . ) we can be confident in our general prediction that if tax attitudes become worse, tax evasion will increase” (p. 165, 177).
The connection between attitude and behaviour is an interesting question which can be analysed empirically. Weck (1983) found in an empirical ana-lysis that there is a negative correlation between tax morale and the size of shadow economy. Compared to other variables tax morale had the most significant impact on the size of shadow economy. Torgler (2003) shows in a multivariate analysis for the United States, using the Taxpayer Opinion Sur-vey, that tax morale and tax evasion are negatively correlated. Furthermore, integrating European and Transition countries, Torgler (2001a) observed a significant negative correlation between tax morale and shadow economy.
The informal sector plays an important role in developing countries. Employment in the informal sector seems to be a relevant income source for many people. Tanzi (2000) points out that it is realistic to assume that informal activities are more important in developing than in developed coun-tries because it is easier to be underground as the exemption levels for income and value added taxes are lower, social security taxes higher and
the obstacles to start activities in the formal economy also higher than in developed countries.
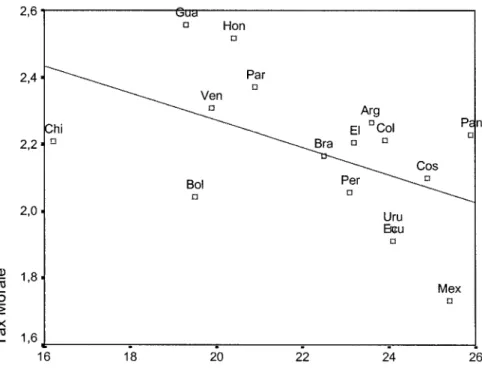
We are going to analyse whether there is a correlation between the size of shadow economy, measured as the degree of informal employment in percent of the total population (average 200/2001, estimated in Schneider, 2002: 6), and tax morale, which we define as the intrinsic motivation to pay taxes .The general question for assessing the level of tax morale in a society is:
On a scale of 1 to 10, where 1 means not at all justifiable and 10 means totally justifiable, how justifiable do you believe it is to: Manage to avoid paying all his tax.
The question is developed from the Latinobarómetro, an annual public opin-ion survey carried out in 17 Latin American countries (data from 1998). It reports the opinions, attitudes, and behaviours of the around 400 million inhabitants of the region, covering most of Latin America with the excep-tion of Cuba, the Dominican Republic, and Puerto Rico. Figure 1 gives the mean value for all countries based on a scale from 0 to 3, were 3 is the highest tax morale and 0 the lowest (value 0 integrates the values 4 to 10). The results indicate a strong negative correlation between both variables (-0.511) significant at the 0.05 level (sign. 2-tailed: 0.043). Countries with a low tax morale show a clear tendency to have a big size of shadow economy. However, it should be noticed that in some developing countries lawbreaking helps survive as transaction costs of behaving honestly are too high. The key problem is that the government is not able to sufficiently secure the property rights. On the other hand a combination of interventionism and bureaucracy is observed. Thus, a situation of “over-government” and “under-government” arises, as Frey and Eichenberger (1999: 89) point out. The government and the administration have a strong discretionary power over the allocation of resources which enhances corruption. Thus, individuals’ tax evasion can be seen as an “exit” option, a signal through which taxpayers can express their disagreement. De Soto (1989) and his research team conducted an experi-ment, setting up a small garment factory in Lima, with the aim to comply with the bureaucratic procedures and thus behave in accordance with the law. He reports that 10 times they were asked for a bribe to speed up the process and twice it was the only possibility to continue the experiment. It took 10 months in total to start the business (see also de Soto, 2000).
2.2. Government and the administration
The way people are treated by the authorities affects their evaluation of these authorities and thus their willingness to co-operate (see, e.g., Lind and Tyler, 1988; Tyler, Casper and Fisher, 1989; Tyler and McGraw, 1986). Whether
Figure 1. Correlation between tax morale and the size of shadow economy
Notes. Arg = Argentina, Bol = Bolivia, Bra = Brazil, Col = Columbia, Cos = Costa
Rica, Chi = Chile, Ecu = Ecuador, El = El Salvador, Gua = Guatemala, Hon = Honduras, Mex = Mexico, Nic = Nicaragua, Pan = Panama, Par = Paraguay, Per = Peru, Uru = Uruguay, Ven = Venezuela.
they feel treated fairly or not influences their willingness to pay taxes. An unfair tax system could enhance the incentives to rationalise cheating. Based on the equity theory, it can be argued that taxpayers perceive their relationship with the state not only as a relationship of coercion, but also as one of ex-change (for an overview see Torgler, 2001b). Taxpayers are more inclined to comply with the law if the exchange between the paid tax and the performed government services are found to be equitable. Thus, positive actions by the state are intended to increase taxpayers’ positive attitudes and commitment to tax system and tax-payment, and thus to enhance compliant behaviour. If the taxpayers are concerned about the burden of taxation and the way the government uses the taxes, this might indicate that the relationship between input (paid taxes) and output (what comes back from the government) is not in equilibrium. An individual’s tax compliance might thus be influenced by the
relation between the benefits received from the government in form of public goods and the price paid for them. Individuals might feel cheated if taxes are not spent adequately. Moral costs of evading taxes decrease and tax morale is crowded out. Table 1 indicates that over 46 percent of the respondents in Latin America believe a high tax burden to be the reason why people do not pay taxes: “because taxes are too high” has the highest percentage of all reasons mentioned. Thus, anti-tax feelings arise if the tax burden is perceived as too heavy. Especially, self-employed people might sense the tax burden more distinctly as taxes become more perceptible to them. Furthermore, on average, 32.4 percent mention that people evade taxes “because taxes are ill spent” The highest value is measured in Mexico (50.3 percent), followed by El Salvador (46.4) and Ecuador (45.8), and the lowest values are observed in Guatemala (20.1), Chile (22.6) and Peru (23.2).
We are going to analyse in the empirical part whether more trust in the authority tend to increase tax morale and thus taxpayers’ intrinsic motiva-tion to pay taxes. If the state acts trustworthily, taxpayers might be more willing to comply with the taxes. On the other hand, perceived unfairness increases the incentive to act against the tax law as psychological costs are reduced. The relationship between taxpayers and state can be seen as a re-lational or psychological contract, which involves strong emotional ties and loyalties (see Feld and Frey, 2002a). Such a psychological tax contract can be maintained by positive actions, based on trust. More trust might enhance citizens’ incentive to commit themselves to obedience. Governments with an authoritarian political structure are quite typical for developing countries. The presidents often have a strong political role, and active democratic political participation is often inexistent. Thus, the government plays an important role in developing countries, where greater difficulties must be confronted than in developed countries. Taxes can be seen as a price paid for government’s positive actions. If the president acts trustworthily, people might be more inclined to pay their taxes. However, we will not only analyse the trust in the president, but also whether a higher satisfaction with officials has a positive effect on tax morale. This allows to check the robustness of the trust variable expanding it to other state agents. Furthermore, the administration (in our case the tax administration) plays an essential role in the tax policy, especially in those countries where formal institutions are less stable and credible. In many developing countries we observe a low capacity of the tax administration to monitor taxpayers’ compliance. Tanzi (2000) reports a case in Peru where corruption in the tax administration was so common that the government
had to close down the existing administration to replace it completely1. In
many countries there was a very high demand for poorly paid jobs in the tax administration, which indicates that applicants were aware of the possibility
to get extra incomes. Furthermore, in some countries these jobs can be bought (see also Tanzi, 2000). There are many opportunities for a tax official to de-mand bribes. The effective tax burden might therefore be much higher than the official tax burden, e.g., due to the “special payments” to the tax officials. Tanzi (2000) offers a set of arguments why corruption is likely to be a major problem in tax administrations (p. 113):
“1. the laws are difficult to understand and can be interpreted differently so that taxpayers need assistance in complying with them;
2. the payment of taxes requires frequent contacts between taxpayers and tax administrators;
3. the wages of the tax administrators are low;
4. acts of corruption on the part of the tax administrators are ignored, not easily discovered or, when discovered, are penalized only mildly;
5. the administrative procedures (for example, the criteria for the selection of taxpayers for audits) lack transparency and are not closely monitored within the tax or customs administrations;
6. tax administrators have discretion over important decisions, such as those related to the provision of tax incentives, determination of tax liab-ilities, selection of audits, litigations, and so on; and
7. more broadly, when the controls of the state (the principal) over the agents charged with carrying out its functions are weak”.
Corruption generally undermines the tax morale of the citizens who become frustrated. Furthermore, there might be a crowding-out effect of moral-ity among the tax administrators when there is a great number of corrupt colleagues. Corruption can be reduced with fair procedures. In the tax com-pliance literature, most studies include the assumption that tax collectors are intrinsically motivated (see, e.g., Hindriks, Keen and Muthoo, 1999). Discre-tionary power over resource allocation can induce corruption. Especially in developing countries, agents as the political elite, administration staff, and le-gislators have a discretionary power, because institutions are neither credible nor working well. Over-regulation on the one hand and a lack of democratic procedures on the other offer a good ground for illegal activities. Corruption reduces the efficiency of allocation and produces delays in transactions to acquire additional payments (see, e.g., Rose-Ackerman, 1997; Jain, 2001). In some countries tax collectors’ wages have been raised to reduce the incentive for them to engage in corruption. Interestingly, such a strategy can also be reported from Ancient Egypt, where pharaohs increased the salary of tax agents (scribes) or trained special agents to check corruption in the revenue bureaus (see Adams, 1993).
Hindriks et al. (1999) searched for anecdotal evidence in the literature and report that in Taiwan 94% of interviewed tax administrators admit having let themselves be bribed and that in India 76% of all government tax inspectors took bribes. Similar to these findings our descriptive analyses indicate that people believe corruption to be a real problem in Latin America. As we can see in Table 1, on average 44.2 percent of the individuals in Latin America state that individuals evade taxes because there is corruption. Ecuador, Mex-ico, and El Salvador have the highest values, Argentina, Chile, and Peru the lowest.
A further important factor mentioned in Table 1 is the lack of civic con-science and honesty. Honesty restricts the possibility set of an individual to act illegally. Taxpayers may be aware that their evasion could damage the welfare of the community they live in. As a consequence, evasion can pro-duce psychological costs. People may not be comfortable with dishonesty (see Spicer, 1986). The findings of Orviska and Hudson (2002) evaluating the British Social Attitudes Survey 1996 indicate that civic conscience has an impact on individuals’ perceptions of whether tax evasion is right or wrong . Furthermore, Torgler (2003) shows with the Taxpayer Opinion Survey that a higher obedience and respect for the authority leads to a significantly higher tax morale.
On the other hand, people in Latin America do not believe that the de-terrence instruments are not good enough, which is measured with “because those that evade taxes go unpunished”. This reason has been mentioned less often than the other factors, having with 23.1 percent the lowest average value of all the reasons (Table 1). Thus, this result indicates that an increase in detection and punishment should not be the only strategy to increase tax morale and tax compliance. As Frey (1997: 44) points out: “the spirit of law, including specific rules, should acknowledge the citizens’ basic good will”.
3. Empirical evaluation
In our analysis we are going to use two data sets: the World Values Sur-vey and the Latinobarómetro. The World Values SurSur-vey (WVS) data covers 10 countries (1995–1997), including countries such as Puerto Rico and the Dominican Republic, which are not available in the Latinobarómetro data set. In the WVS the general question for assessing the level of tax morale in a society is:
Please tell me for each of the following statements whether you think it can always be justified, never be justified, or something in between: (. . . )
Cheating on tax if you have the chance (% “never justified” – code 1 from a ten-point scale where 1 = never and 10 = always).
Both data sets help get a relatively robust picture of the degree of tax morale and the determinants that shape tax morale in Latin America. Certainly, sub-jective surveys are always prone to significant reporting errors. Thus, the way tax morale is measured in this study is not free of biases. It can be argued that a taxpayer who has incurred in some illegal behaviour in the past will tend to excuse this kind of behaviour declaring a high tax morale. Furthermore, people might overstate their willingness to pay taxes, as there are no sanc-tions involved. However, our results have indicated previously that there is a negative correlation between the degree of tax morale and the size of shadow economy. A further point might be the delicate nature of tax compliance. However, the way we define tax morale is less delicate than if we would ask whether a person has evaded taxes or not. A further advantage is the fact that both data sets cover a broad variety of questions on different topics, which reduces framing effects compared to a survey based only on tax compliance questions. The use of different data sources combined with a huge range of countries reduces biases that could arise from an momentary mood at the time of the survey. Certainly, it can be criticised that a tax morale variable deduced from more than one question would be more reliable and valid. On the other hand, it might be important to focus on a specific tax compliance question to constitute a reliable measure of tax morale. Using a single question has also the advantage that problems associated with the construction of an index can be reduced, such as complexity, especially regarding the measurement procedure or a feeble correlation between the items.
The descriptive analysis shows that the average tax morale values in both data sets are similar. 63.2 percent of the individuals stated that “manage to avoid paying all his tax” is never justified, with a mean value of 2.19 using the scale from 0 to 3 (3 = highest tax morale) in the Latinobarómetro. On the other hand, the WVS reports that 66.8 percent argue that cheating on tax if you have the chance is never justified, with a mean value of 2.22.
In this subsection we will made a multivariate regression analysis in order to get deeper insights. First we are going to present some theoretical con-siderations about key determinants that may influence tax morale and thus allow to develop hypotheses. After that, weighted ordered probit estimations are going to be presented, using both data sets (Latinobarómetro and World Values Survey) pooling the countries, but differentiating between regions.
The descriptive analysis shows that Mexico is a special case, indicating a very low tax morale in both data sets. Furthermore, Mexico can be classi-fied as region on its own, building the bridge between the United States and
general, a cross-country analysis with attitude survey questions might cause difficulties. Because of the biases connected with cross-country comparisons, we restrict our analysis to a relatively homogeneous region as Latin America, building dummy variables to catch regional differences. We start with the Latinobarómetro, as this data set with 17 countries offers a broader picture of Latin America than the World Values Survey. As a dependent variable we use tax morale (scale from 0 to 3, where 3 measures the highest tax morale). 3.1. Multivariate analysis with the Latinobarómetro
Research commonly treats tax evasion as an important reaction to express preferences. However, there are other possibilities as, e.g., tax avoidance. Tax avoidance and tax evasion are often not distinguished in economic studies. We have the possibility to analyse both components. Whereas the World Values Survey focuses on evasion, the Latinobarómetro puts into account tax avoidance. Tax evasion might produce higher moral costs than tax avoidance, as the latter is more broadly accepted being closer to a legal strategy to escape from tax payments.
3.1.1. Main variables
3.1.1.1. Avoid paying taxes Compared to the World Values Survey the
Latinobarómetro has the advantage to cover additional tax compliance ques-tions. We have focussed on the following variable, which we define as TAX AVOIDANCE:
Could you tell me if recently you have known someone or have heard someone you know comment about somebody who has: Managed to avoid paying all his tax (1 = yes, 0 = no).
If individuals notice that many others evade taxes, their willingness to con-tribute may decrease, crowding out their intrinsic motivation to comply with taxes. Taxpayers get the feeling that they can as well be opportunistic. The moral costs to evade taxes decrease. Thus, we would hypothesise that taxpay-ers who know or have heard about citizens who have managed to avoid taxes have a lower tax morale than others. Lewis (1982: 144) points out that there might be a “tax subculture, with its own set of unwritten rules and regula-tions. Thus I am more likely to evade not only because I have friends who, I know, have got away with it (so why shouldn’t I?) but also because evasion is ethically acceptable among my friends (. . . ) Furthermore, ‘no friends of mine can be criminals’ may come the reply: ‘What’s good enough for fine, upstanding citizens like Fred Bloggs, John Doe, Donald Campbell, Herman Schmitt and Hans Anderson is good enough for me”’.
3.1.1.2. Trust that people obey the law This variable measures the contrary effect of the previous one. If we believe that most people obey the law and
pay their taxes, moral costs of not being obedient increase.3The hypothesis
would be that an increase in the level of “trust that other people obey the law” increases tax morale.
3.1.1.3. Perceived probability of being caught Traditionally, tax
compli-ance literature stresses the relevcompli-ance of deterrence factors as the probability of being caught and fine rates. However, complying or not is not only a function of opportunity, tax rates, and probability of detection, but depends also on social and moral attitudes, institutions, and procedures. Especially when we analyse tax morale as a dependent variable, it can be doubted that the
per-ceived probability of being caught has a positive effect on tax morale.4Frey
(1997) points out that a high punishment can be an indicator that the gov-ernment distrust individuals and that compliance is not honoured, which may undermine tax morale.
3.1.1.4. Trust in the president We are going to analyse whether trust in the
president has a positive effect on tax morale.5If taxpayers trust the president,
they are more inclined to be honest. Our hypothesis is therefore that a higher degree of trust in the president leads to a higher tax morale.
3.1.2. Results
Table 2 presents the results. We have used a weighted ordered probit es-timation to correct the samples and thus to get a reflection of the national distribution. The ordered probit models are relevant in such an analysis in-sofar as they help analyse the ranking information of the scaled dependent variable tax morale. However, as in the ordered probit estimation, the equa-tion has a nonlinear form, only the sign of the coefficient can be directly interpreted and not its size. Calculating the marginal effects is therefore a method to find the quantitative effect a variable has on tax morale (see, e.g., Frey and Stutzer 2002). Only for the highest value “tax avoidance is never justified” the marginal effects are presented. We can observe that South Amer-ica and Mexico have a signifAmer-icantly lower tax morale than Central AmerAmer-ica.
Being from South America (Mexico6) rather than from Central America
re-duces the probability of stating that tax avoidance is never justified by more than 10 percentage points (20 percentage points). Knowing about individuals who avoid taxes has a significantly negative effect on tax morale. Thus, the first hypothesis cannot be rejected. It reduces the share of individuals arguing that tax morale is never justifiable by more than 6 percentage points. On the other hand if people trust that others obey the law, tax morale significantly
increases by more than 8 percentage points. These results show the relevance of maintaining a high level of social capital.
In line with our expectations, the hypothesis regarding the variable TRUST PRESIDENT cannot be rejected either, whereas not surprisingly PERCEPTION BEING CAUGHT is not significant showing a coefficient with a negative sign. Looking at the control variables we observe that all age groups from 30 to 65+ have a significantly higher tax morale than the reference group 16-29. For example, the proportion of persons of the age 65+ who report the highest tax morale is 12.5 percentage points higher than for the reference age group. Marginal effects increase with an increase of the age. Furthermore there is the tendency that married people or people who live together have a significantly higher tax morale than singles. The share of people reporting the highest tax morale is higher for self-employed persons, individuals salaried in a private company, and people in charge of a household than for people salaried in a public company. Tax administration’s collecting problems affect the monitoring of self-employed individuals, as it is very difficult and costly to gather information about them. Thus many enterprises, especially small ones, remain invisible (Burges and Stern, 1993). Regarding tax morale such a situation does not mean that those individuals’ morale is lower. On contrary, they do not feel the tax burden as the government and the administration have difficulties to capture their existence. This might also explain the difference between people salaried in a private and in a public company.
It might be interesting to integrate a proxy for income into the estimations. The Latinobarómetro has no specific information about the income of the subjects. Thus, the following proxies are integrated into further equations:
OWN HOUSE, SOCIO-ECONOMIC STATUS7and FORTUNE.8
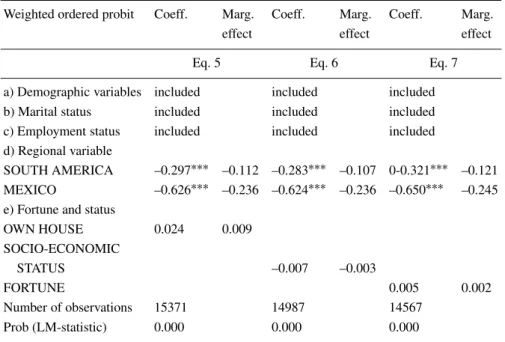
Interest-ingly, all coefficients are not significant, showing low marginal effects, but the coefficients for the regional variables remain significant (see Table 3). 3.2. Multivariate analysis with the World Values Survey
In a second step we are going to evaluate World Values Survey (WVS) data. The data set covers a wider range of questions on attitudes issues and socio-economic characteristics. We evaluate the wave 1995–1997, which covers the greatest number of Latin American countries. As before, we build regional dummy variables. The WVS has the disadvantage that Central America has not been covered sufficiently. Thus, instead of differentiating between South and Central America, we build additional dummies for Mexico and the Dominican Republic (Caribbean area). In line with the Latinobarómetro findings Table 4 indicates that Mexico has a significantly lower tax morale than the reference group (other Latin American countries).
T abl e 1 . R easons w h y indi vi dual s ev ade tax es W h y d o p eopl e not pay thei r ta x es? A rg B ol B raz C o l C os C h i E cu E l G u a H on Me x N ic Pan P ar P er U ru V en A v er age L ack of honest y 17. 7 47. 0 45. 5 31. 3 54. 0 54. 7 53. 8 58. 5 49. 6 53. 5 39. 2 36. 0 49. 8 47. 3 41. 6 20. 3 57. 5 44. 5 Because nat ional s are q u ic k -witte d an d sly 1 4 .8 1 7 .6 3 1 .8 1 7 .8 2 9 .2 4 4 .4 4 7 .2 2 5 .8 1 2 .8 2 8 .3 2 5 .4 1 6 .2 3 2 .7 8 .9 2 5 .6 3 0 .5 3 9 .9 2 6 .4 T h ey don’ t see th e poi nt in payi ng ta x es 19. 7 28. 5 25. 9 24. 4 21. 2 30. 3 37. 8 44. 8 15. 3 41. 3 49. 9 30. 4 26. 9 29. 9 21. 4 23. 4 29. 2 29. 4 L ack of ci vi c consci ence 15. 3 35. 3 32. 0 28. 9 24. 9 39. 5 49. 3 40. 4 20. 2 49. 3 38. 3 33. 4 41. 1 37. 4 34. 2 24. 2 40. 7 34. 4 Because those that ev ade ta x es g o unpuni shed 26. 0 23. 0 24. 3 16. 6 19. 2 18. 1 31. 3 36. 4 13. 4 24. 6 36. 5 21. 0 18. 6 19. 9 14. 6 26. 5 22. 3 23. 1 Because th e tax es are ill-sp en t 2 6 .7 4 0 .4 2 9 .7 4 0 .4 2 7 .8 2 2 .6 4 5 .8 4 6 .4 2 0 .1 3 5 .1 5 0 .3 3 3 .7 2 7 .5 2 9 .9 2 3 .2 2 5 .1 2 6 .6 3 2 .4 Because th e tax es are to o h ig h 65. 6 37. 1 50. 0 62. 8 37. 6 32. 0 50. 8 54. 3 24. 1 47. 2 55. 8 57. 6 38. 5 42. 9 50. 2 63. 7 25. 3 46. 8 Because th ere is cor rupt io n 32. 0 42. 4 48. 9 48. 7 43. 7 32. 5 59. 0 52. 5 43. 2 44. 4 54. 6 41. 9 40. 5 47. 0 32. 8 41. 0 45. 7 44. 2 No te . P er cent age of Indi vi dual s th at ment ioned reasons w h y p eopl e d o not pay thei r ta x es.
T abl e 2 . D et er m in ant s of ta x m or al e 1998 (L at inobar ´omet ro ) W ei ght ed or der ed p robi t E q. 1 E q. 2 E q. 3 E q. 4 V ari abl e Coef f. Mar g . C oef f. M ar g. Coef f. Mar g . C oef f. M ar g. a) D emogr aphi c fact or s A G E 30–49 0. 086 ∗∗∗ 0. 033 0. 061 ∗∗ 0. 023 0. 068 ∗∗∗ 0. 026 0. 070 ∗∗∗ 0 .026 A G E 50–64 0. 167 ∗∗∗ 0. 063 0. 129 ∗∗∗ 0. 048 0. 148 ∗∗∗ 0. 056 0. 159 ∗∗∗ 0 .060 A G E 65+ 0. 332 ∗∗∗ 0. 125 0. 264 ∗∗∗ 0. 099 0. 334 ∗∗∗ 0. 126 0. 321 ∗∗∗ 0 .121 F E MA L E 0. 007 0. 003 0. 036 0. 013 0. 022 0. 008 0. 021 0 .008 EDUCA T ION 0 .0 0 5 ∗∗ 0. 002 0. 003 0. 001 0. 004 ∗ 0. 002 0. 004 0 .001 b ) M arita l sta tu s M A RRIED/LIVING T OGETHER 0 .0 4 7 ∗ 0. 018 0. 045 ∗ 0. 017 0. 043 ∗ 0. 016 0. 039 0 .015 D IV O R C E D /W ID O W E D –0. 033 –0. 012 –0. 052 –0. 020 –0. 040 –0. 015 –0. 044 –0 .017 c) E m pl o y ment st at us S E L F E M P L O Y E D 0. 032 0. 012 0. 063 ∗ 0. 024 ∗ 0. 050 0. 019 0. 056 0 .021 SALARIED IN A P RIV A TE C O MP A N Y 0. 065 ∗ 0. 025 0. 072 ∗ 0. 027 ∗ 0. 070 ∗ 0. 026 0. 073 ∗∗ 0 .028 U N E MP L O Y E D –0. 048 –0. 018 –0. 027 –0. 010 –0. 039 –0. 015 –0. 030 –0 .011 R E T IR E D 0 .010 0. 004 0. 058 0. 022 0. 006 0. 002 0. 000 0 .000 IN CHARGE OF HOUS EHOLD 0 .1 1 7 ∗∗ 0. 044 0. 109 ∗∗∗ 0. 041 ∗∗∗ 0. 121 ∗∗∗ 0. 046 0. 133 ∗∗∗ 0 .050 S T U D E N T 0. 037 0. 014 0. 041 0. 016 0. 036 0. 014 0. 049 0 .018
T abl e 2 . C ont inued W ei ght ed or der ed p robi t E q. 1 E q. 2 E q. 3 E q. 4 V ari abl e Coef f. Mar g . C oef f. M ar g. Coef f. Mar g . C oef f. M ar g. f) R egi onal v ar ia bl e S O U T H A ME R IC A –0. 300 ∗∗∗ –0. 113 –0. 310 ∗∗∗ –0. 117 –0. 289 ∗∗∗ –0. 109 –0. 292 ∗∗∗ –0 .110 ME X IC O –0. 626 ∗∗∗ –0. 236 –0. 631 ∗∗∗ –0. 237 –0. 639 ∗∗∗ –0. 241 –0. 637 ∗∗∗ –0 .200 g) F u rt her v ar ia bl es A V O ID P A Y IN G T A X E S –0. 172 ∗∗∗ –0. 065 TR UST P EOPLE O BEY T HE LA W 0 .2 2 7 ∗∗∗ 0. 086 P E RCEP T ION B EING CA UGHT – 0 .0 0 2 – 0 .0 0 1 TR US T P RES IDENT 0. 021 ∗∗∗ 0 .008 O b ser v at ions 14823. 14409 15274. 15282 P rob( L M -s ta ti st ic ) 0 .000 0. 000 0. 000 0. 000 No tes . D ependent v ar iabl e: tax mor al e on a four poi nt scal e. In th e ref er ence gr oup ar e A G E 16–29, MA L E , S IN G L E , S A L A R IE D IN A P U B L IC COM P ANY , C ENTRAL AM ERICA. S ig n ifi can ce le v els: ∗0. 05 < p < 0. 10, ∗∗ 0. 01 < p < 0. 05, ∗∗∗ p < 0. 01. Mar g in al ef fect = h ighest ta x mor al e scor e (3) .
Table 3. Tax morale and status in 1998 (Latinobar´ometro)
Weighted ordered probit Coeff. Marg. Coeff. Marg. Coeff. Marg.
effect effect effect
Eq. 5 Eq. 6 Eq. 7
a) Demographic variables included included included
b) Marital status included included included
c) Employment status included included included
d) Regional variable
SOUTH AMERICA –0.297∗∗∗ –0.112 –0.283∗∗∗ –0.107 0-0.321∗∗∗ –0.121 MEXICO –0.626∗∗∗ –0.236 –0.624∗∗∗ –0.236 –0.650∗∗∗ –0.245 e) Fortune and status
OWN HOUSE 0.024 0.009 SOCIO-ECONOMIC STATUS –0.007 –0.003 FORTUNE 0.005 0.002 Number of observations 15371 14987 14567 Prob (LM-statistic) 0.000 0.000 0.000
Notes. Dependent variable: tax morale on a four-point scale. In the reference group are AGE
16–29, MALE, SINGLE, SALARIED IN A PUBLIC COMPANY, CENTRAL AMERICA. Significance levels:∗0.05 < p < 0.10,∗∗0.01 < p < 0.05,∗∗∗p < 0.01. Marginal effect = highest tax morale score (3).
Instead of trust in the president we use satisfaction with officials. This allows to check the robustness of the trust variable expanding it to other state agents. The coefficient is highly significant and the marginal effects show that an increase in the level of satisfaction by one unit raises the share of individuals stating that tax morale is never justifiable by 1 percentage point.
We have obtained comparable results regarding the control variables. A higher age has a positive effect on tax morale. Furthermore, married people (females) have a higher tax morale than singles (males). The coefficient of the variable EDUCATION has now a negative sign. However, the significant effect on tax morale is not robust throughout all equations. We also controlled for the economic situation of the individuals. The results show the tendency that the lowest group (reference group) has a higher tax morale than the groups with a better economic situation. However, only the coefficient for the variable LOWER MIDDLE CLASS indicates a significant difference to the variable LOWER CLASS. We also checked if people with a stronger
T abl e 4 . D et er m in ant s of ta x m or al e ( W V S , 1995–1997) W ei ght ed or der ed p robi t E q. 1 E q. 2 E q. 3 E q. 4 V ari abl e Coef f. Mar g . C oef f. M ar g. Coef f. Mar g . C oef f. M ar g. a) D emogr aphi c fact or s A G E 30–49 0. 090 ∗∗∗ 0. 033 0. 086 ∗∗∗ 0. 032 0. 101 ∗∗∗ 0. 037 0. 086 ∗∗∗ 0 .032 A G E 50–64 0. 304 ∗∗∗ 0. 112 0. 298 ∗∗∗ 0. 109 0. 284 ∗∗∗ 0. 105 0. 281 ∗∗∗ 0 .104 A G E 65+ 0. 509 ∗∗∗ 0. 187 0. 500 ∗∗∗ 0. 183 0. 501 ∗∗∗ 0. 184 0. 441 ∗∗∗ 0 .162 F E MA L E 0. 109 ∗∗∗ 0. 040 0. 101 ∗∗∗ 0. 037 0. 091 ∗∗∗ 0. 034 0. 109 ∗∗∗ 0 .040 E D U C A T IO N –0. 011 –0. 004 –0. 018 ∗∗∗ –0. 007 –0. 014 ∗∗ –0. 005 –0. 006 –0 .002 b ) M arita l sta tu s MA R R IE D 0. 095 ∗∗∗ 0. 035 0. 081 ∗∗ 0. 030 0. 090 ∗∗∗ 0. 033 0. 076 ∗∗ 0 .028 L IV IN G TO G E T H E R –0. 006 –0. 002 –0. 008 –0. 003 –0. 004 –0. 001 –0. 009 –0 .003 D IV O R C E D –0. 067 –0. 025 –0. 042 –0. 015 –0. 042 –0. 016 –0. 045 –0 .017 S E P A R A T E D 0. 017 0. 006 0. 019 0. 007 –0. 008 –0. 003 0. 034 0 .013 WID O WED 0 .1 5 8 ∗∗ 0. 058 0. 116 0. 043 0. 139 ∗ 0. 051 0. 169 ∗∗ 0 .062 c) E m pl o y ment st at us P A R T T IME E M P L O Y E D 0. 013 0. 005 0. 038 0. 014 0. 030 0. 011 0. 018 0 .007 S E L F E M P L O Y E D 0. 061 0. 023 0. 060 0. 022 0. 056 0. 021 0. 056 0 .021 U N E MP L O Y E D 0 .015 0. 005 0. 009 0. 003 0. 027 0. 010 0. 021 0 .008 A T H O M E –0. 034 –0. 012 –0. 008 –0. 003 –0. 019 –0. 007 –0. 022 –0 .008 S T UDENT 0 .1 2 0 ∗∗∗ 0. 044 0. 116 ∗∗∗ 0. 043 0. 134 ∗∗∗ 0. 049 0. 106 ∗∗∗ 0 .039 R E T IR E D 0 .008 0. 003 0. 041 0. 015 0. 056 0. 021 0. 049 0 .018 O T H E R 0 .021 0. 008 –0. 008 –0. 003 0. 015 0. 006 –0. 009 –0 .003
T abl e 4 . C ont inued W ei ght ed or der ed p robi t E q. 1 E q. 2 E q. 3 E q. 4 V ari abl e Coef f. Mar g . C oef f. M ar g. Coef f. Mar g . C oef f. M ar g. d) E conomi c si tu at io n U P P E R C L A S S –0. 027 –0. 010 –0. 072 –0. 027 –0. 015 –0. 006 –0. 037 –0. 014 U P P E R M ID D L E C L A S S –0. 014 –0. 005 –0. 050 –0. 019 –0. 024 –0. 009 –0. 012 –0. 004 L O W E R M ID D L E C L A S S –0. 098 ∗∗ –0. 036 –0. 135 ∗∗∗ –0. 050 –0. 115 ∗∗ –0. 042 –0. 079 ∗ –0. 029 WO R K IN G C L A S S –0. 019 –0. 007 –0. 061 –0. 022 –0. 043 –0. 016 –0. 022 –0. 008 e) Re lig io sity RELIGIOUS 0 .0 9 2 ∗∗∗ 0. 034 0. 094 ∗∗∗ 0. 034 0. 091 ∗∗∗ 0. 033 0. 060 ∗∗∗ 0. 022 f) R egi onal v ar ia bl e ME X IC O –0. 274 ∗∗∗ –0. 101 –0. 239 ∗∗∗ –0. 088 –0. 264 ∗∗∗ –0. 097 –0. 285 ∗∗∗ –0. 105 DOM INICAN REPUBLIC 0 .3 1 3 ∗∗∗ 0. 115 0. 239 ∗∗∗ 0. 088 0. 269 ∗∗∗ 0. 099 0. 280 ∗∗∗ 0. 103 g) F u rt her v ar ia bl es SA TISF A C TION WITH N A TION AL 0 .0 2 8 ∗∗∗ 0. 010 OFFICERS PR O D EM OCRA CY 1 0 .2 0 0 ∗∗∗ 0. 073 PR O D EM OCRA CY 2 0 .1 2 3 ∗∗∗ 0. 045 PRID E 0. 249 ∗∗∗ 0. 092 O b ser v at ions 7422. 7233. 7146. 7483. P rob( L M -s ta ti st ic ) 0 .000 .0 000. 0. 000 .0 000. No tes . D ependent v ar iabl e: tax mor al e on a four -poi nt scal e. In th e ref er ence gr oup ar e A G E 16–29, MA L E , S IN G L E , F U L L T IME E M P L O Y E D , LO WER C LA SS, SO U T H A M E RICA . S ig n ific an ce le v els : ∗0. 05 < p < 0. 10, ∗∗ 0. 01 < p < 0. 05, ∗∗∗ p < 0. 01. Mar g in al ef fect = h ighest ta x mor al e scor e (3) .
might inhibit illegal behaviour because religion is a sanctioning system that legitimises and reinforces social values. Empirical studies have shown that states and counties with higher rates of religious memberships have signific-antly less violent and non-violent crime (see, e.g., Hull and Bold, 1994; and Lipford, McCormick and Tollison, 1993). Table 4 shows a positive correlation between tax morale and religiosity.
Political participation is a social innovation for Latin America and pro-duces beneficial effects. In the last decades we observe a strengthening of democracy in some Latin American countries, as, e.g., in Chile, Mexico and Argentina. Democracy offers citizens the possibility to express their preferences. A more active role helps citizens to better monitor and control politicians and thus to reduce the asymmetry of information between them and their agents (government), which reduces the discretionary power. This
might influence citizens’ tax morale.10 Thus we would hypothesise that a
stronger pro democratic attitude has a positive effect on tax morale. We have built variables that measure individuals’ support for democratic government
(PRO DEMOCRACY 111and PRO DEMOCRACY 212). Table 4 indicates
that pro democratic attitudes have a highly significant positive effect on tax morale. An increase in the pro democracy scale by one unit in both cases raises the proportion of persons indicating the highest tax morale by 7.3 (4.5) percentage points. We also analyse the effect of pride on tax morale. Being proud of her/his country enhances the identification with the state. This might be a reason for behaving co-operatively and thus finding it important to pay
the taxes. The expected sign for the variable PRIDE13is therefore positive.
Table 4 indicates that the hypothesis cannot be rejected. We find a positive correlation between pride and tax morale. An increase in pride by one unit raises the share of persons arguing that tax morale is never justifiable by 9.2 percentage points.
We also explore the effects of satisfaction variables on tax morale. We start
with the variable FINANCIAL SATISFACTION14, which is more strongly
related to tax payments. If the financial situation in a household is poor, the tax payments might be seen as a hard restriction in their possibility set, which might reduce tax honesty. To get a broader view, we include the variables
SATISFACTION15and HAPPINESS16. Table 5 presents the results. All three
variables significantly affect tax morale in a positive way. Interestingly, the variable HAPPINESS has the highest marginal effects.
4. Conclusions
There are a couple of publications about the informal sector in Latin America, but hardly any study that has analysed tax morale. Most of the empirical
evid-T abl e 5 . T ax m or al e and sat is fact io n (W V S , 1995–1997) W ei ght ed or der ed p robi t C oef f. M ar g. C o ef f. Mar g . C oef f. M ar g. C o ef f. Mar g . ef fect ef fect ef fect ef fect Eq . 5 Eq . 6 Eq . 7 Eq . 8 a) D emogr aphi c v ar ia bl es in cl uded incl uded incl uded incl uded b) Mar it al st at u s incl uded incl uded incl uded incl uded c) E m pl o y ment st at us in cl uded incl uded incl uded incl uded d) E conomi c si tu at io n incl uded incl uded incl uded INCOM E 0. 052 ∗∗∗ 0. 019 e) R el ig io si ty in cl uded incl uded incl uded incl uded f) R egi onal v ar ia bl e ME X IC O -0 .302 ∗∗∗ -0 .111 -0 .306 ∗∗∗ -0 .112 -0 .256 ∗∗∗ -0 .094 -0 .292 ∗∗∗ -0 .108 DOM INICAN REPUBLIC 0 .2 8 9 ∗∗∗ 0. 106 0. 277 ∗∗∗ 0. 102 0. 299 ∗∗∗ 0. 110 0. 289 ∗∗∗ 0. 107 g ) Sa tisf ac tio n FIN ANCIAL S A T ISF A CTION 0 .0 1 8 ∗∗∗ 0. 006 S A T IS F A C T IO N 0. 038 ∗∗∗ 0. 014 H A PPIN E SS 0. 199 ∗∗∗ 0. 073 N u mber of obser v at ions 7572 7580 7572 7052 P rob (L M-st at is ti c) 0 .000 0. 000 0. 000 0. 000 No tes . D ependent v ar iabl e: tax mor al e on a four -poi nt scal e. In th e ref er ence gr oup ar e A G E 16-29, MA L E , S IN G L E , F U L L T IME E M P L O Y E D , LO WER C LA SS, SO U T H A M E RICA . S ig n ific an ce le v els : ∗0. 05 < p < 0. 10, ∗∗ 0. 01 < p < 0. 05, ∗∗∗ p < 0. 01. Mar g in al ef fect = h ighest ta x m or al e scor e (3) .
ence is centred on the USA, evaluating, e.g., the TCMP program or amnesty data. Thus, it is difficult to know to which extent findings from the United States can be transferred to other countries. Furthermore, audit and amnesty data have a selection bias as only specific individuals participate in an am-nesty and not all individuals (especially tax evaders) are measured with audit data. Our data sets have also the advantage that they include a broad variety of socio-economic data. Working with two data sets (Latinobarómetro and World Values Survey) allows to get a robust picture of tax morale in Latin America. These two data sets offer the possibility to do a more refined study covering more than one year.
Our findings indicate that there is a significant correlation between tax morale and the size of shadow economy. Looking at individuals’ perceptions of reasons for tax evasion we found that the tax burden, the lack of honesty, and corruption are seen as the main factors. A tax system must be fair in the view of the taxpayers. If a taxpayer feels that she/he is in a sort of unfair con-tract she/he will probably be less likely to comply. As Smith (1992) argues, cycles of antagonism between the tax administration and the taxpayer might begin to break with a positive concession by the administrator. Taxpayers are more inclined to comply to the law if the exchange between the paid tax and the performed government services are found to be equitable.
In our multivariate analysis we use entire pooled samples to check the robustness of the findings. We could observe a significantly lower tax morale in South America/Mexico than in Central America/Caribbean Area. Espe-cially Mexico has a very low tax morale. Furthermore, people who said they knew/have heard about practiced tax avoidance have a significantly lower tax morale than others. On the other hand, if people believe that others obey the law, their intrinsic motivation to pay taxes increases. In general, the findings show that a tax policy should maintain a high level of social capital. If people believe that others are honest their willingness to pay taxes increases. Oth-erwise, the government and the tax administration get into hot water, as the tax morale of individuals who notice that many others evade taxes is reduced. Evasion is a signal that intrinsic motivation is not approved. Thus, taxpayers get the feeling that they can as well be opportunistic and the moral costs of evading taxes decrease.
In general, the results indicate that there are alternative tax policy strategies to those assuming that people are knaves who must be controlled to reduce their self-interested behaviour and thus tax evasion. It is not necessary to develop a constitution designed for knaves. Tax law should consider the “spirit of trust”, i.e., should include specific rules as self-declaration, which gives taxpayers more scope of their own and supports trustfulness as a motiv-ation to pay taxes. Trust in the president and the officials, the belief that other
individuals obey the law and a pro democratic attitude have a significant pos-itive effect on tax morale. The governments and the tax administration have to create confidence in their credibility and their capacity to deliver promised returns for taxes. The relationship between taxpayers and tax authorities, seen as a relational or psychological contract, involves strong emotional ties and loyalties. Such a psychological tax contract can be maintained by positive actions, based on trust (see Feld and Frey, 2002b). If such rules yield good results and taxpayers make their decisions to comply with taxation according to past experiences, social capital associated with paying taxes can be created or maintained. Such a social capital stock can reduce the costs of running the government.
Notes
1. In 1991 important reforms were enacted in Peru creating an increase in revenues meas-ured as a percentage of the GDP. The tax administration (Superintendencia Nacional de Administracion Tributaria) reduced their workforce implementing higher standards and increased the salary to be competitive with the private sector (Bejakovi´c, 2000).
2. The low tax morale in Mexico corresponds to the low revenue performance (also com-pared to other developing countries), despite the tax structure is comparable to many OECD countries. Martinez-Vazquez (2001) tries to explain this so-called paradox. As he mentions, the modern tax system structure is undermined by factors as i) ad hoc policy measures, ii) lacking ability of tax administrations to deal with a modern tax system, and iii) Mexican’s authority policy to keep tax efforts (measured as the ratio of revenues to GDP) relatively constant, which derives from an agreement between the government and the private sector.
3. The following question has been asked: “In general, would you say that people always obey the law, or are there exceptions or particular occasions when people can follow their consciences even if it means breaking the law” (1 = Always obey the law, 0 = follow their consciences).
4. The Latinobarómetro has asked the respondents the following question: Would you say that it is very possible, fairly, a little, or not at all possible that a person in our country who has committed an illegal act gets caught.
5. Trust in government has been measured as follows: Please tell me how much confidence you have in the president (1 = not at all, 4 = a lot).
6. It is interesting to notice that Mexico had many tax reforms. However, it seems that too many reforms can produce instability in the tax system. In Mexico reforms took place in 1978-80, 1983, 1985, 1986, 1988, 1989, 1990-91, 1993, 1994, 1995-97, and 1998 (Martinez-Vazquez, 2001: 29). Martinez-Vazquez (2001) points out that instability of the tax system makes tax enforcement more difficult and might lead to a lower tax revenue. Changes demand too much of the tax administration, create uncertainty and confusion among taxpayers and increase tax compliance costs. Contrary to other Latin American countries Mexico has a very modern tax revenue structure based on income taxes as the most important source of revenue (31 percent of total federal revenues in 1998). 7. Socio-economic status (4 = very good, 1 = very bad).
8. As a proxy for FORTUNE we take the aggregated sum of the following factors: colour TV, freezer, computer, washing machine, phone, car, second house, drinking water, sewage system (value 0 to 9).
9. We have developed a religiosity variable from the following question in the WVS: Inde-pendently of whether you go to church or not, would you say your are a religious person (value 3), not a religious person (2), a convinced atheist (1).
10. Empirical evidence from Switzerland presented by Pommerehne and Weck-Hannemann (1996) shows that in cantons with a high degree of direct political control tax evasion is – ceteris paribus – about SFr 1500 lower as compared to the average of the cantons without such direct influence. Furthermore, using two different data sets at the individual level (World Values Survey and International Social Survey Programme) Torgler (2002) finds that direct democratic rights have a significantly positive effect on tax morale.
11. The question is: "Would you say that having a democratic political system is a very good (4), fairly good (3), fairly bad (2) or very bad (1) way of governing this country" (scale 1 to 4).
12. "Democracy may have problems but it’s better than any other form of government" (4 = strongly agree, 1 = strongly disagree). How proud are you to be . . . ? (substitute your own nationality for . . . , 1 = not at all proud, 4 = very proud) How satisfied are you with the financial situation of your household? (scale 1 = dissatisfied to 10 = satisfied)
13. All things considered, how satisfied are you with your life as a whole these days? (scale 1 = dissatisfied to 10 = satisfied).
14. Taking all things together, would you say you are: very happy (4), quite happy (3), not very happy (2), not at all happy (1).
References
Adams, C. (1993). For good and evil. The impact of taxes on the course of civilization. London: Madison Books.
Ajzen, I. and Fishbein, M. (1980). Understanding attitudes and predicting social behaviour. Englewood Cliffs: Prentice-Hall.
Alm, J. and Martinez-Vazquez, J. (2001). Societal institutions and tax evasion in developing and transitional countries. Conference paper in honor of Richard Bird: Public finance in developing and transition countries, April 4–6, Atlanta.
Bahl, R. and Martinez-Vazquez, J. (1992). The nexus of tax administration and tax policy in Jamaica and Guatemala. In M. Casanegra de Jantscher and R.M. Bird (Eds.), Improving
tax administration in developing countries, 66–110. Washington: International Monetary
Fund.
Bejakovi´c, P. (2000). Improving the tax administration in transition countries. Paper presented at the Conference Global entrepreneurship in the new millenium. School of Management Syracuse University, Syracuse, New York, U.S.A., August.
Burgess, R. and Stern, N. (1993). Taxation and development. Journal of Economic Literature 31: 762–830.
Cabezas, R.M. (1992). Comments to tax administration reform in Bolivia and Uruguay. In M. Casanegra de Jantscher and R.M. Bird (Eds.), Improving tax administration in developing
Casanegra de Jantscher, M. and Bird, R.M. (1992). The reform of tax administration. In M. Casanegra de Jantscher and R.M. Bird (Eds.), Improving tax administration in developing
countries, 1–18. Washington: International Monetary Fund.
de Soto, H. (1989). The other path: The invisible revolution in the third world. New York: Harper & Row.
de Soto, H. (2000). The mystery of capital: Why capitalism triumphs in the west and fails
everywhere else. New York: Basic Books.
Das-Gupta, A. and Mookherjee, D. (1995). Reforming indian income tax enforcement. IED Discussion Paper Series, No. 52, Boston University: Institute for Economic Development. Feld, L.P. and Frey, B.S. (2002a). The tax authority and the taxpayer: An exploratory ana-lysis. Paper presented the 2002 Annual Meeting of the European Public Choice Society Belgirate.
Feld, L.P. and Frey, B.S. (2002b). Trust breeds trust: How taxpayers are treated. Economics of
Governance 3: 87–99.
Frey, B.S. (1997). Not just for the money. An economic theory of personal motivation. Cheltenham, UK: Edward Elgar Publishing.
Frey, B.S. and Eichenberger, R. (1999). The new democratic federalism for Europe. Chelten-ham, UK: Edward Elgar.
Frey, B.S. and Stutzer, A. (2002). Happiness and economics. How the economy and institutions affect well-being. Princeton: Princeton University Press.
Hindriks, J., Keen, M. and Muthoo, A. (1999). Corruption, extortion and evasion. Journal of
Public Economics 74: 395–430.
Hirschi, T. and Stark, R. (1969). Hellfire and delinquency. Social Problems 17: 202–213. Hull, B.B. and F. Bold (1994). Hell, religion, and cultural change. Journal of Institutional and
Theoretical Economics 150: 447–464.
Jain, A. (2001). Corruption: A review. Journal of Economic Surveys 15: 71–120.
Jenkins, G.P. (1995). Perspectives for tax policy reform in Latin America in the 1990’s. Working Paper, Harvard Institute for International Development (HIID).
Lewis, A. (1982). The psychology of taxation. Oxford: Martin Robertson.
Lind, E.A. and Tyler, T.R. (1988). The social psychology of procedural justice. New York: Plenum Press.
Lipford, J., McCormick, R.E. and Tollison, R.D. (1993). Preaching matters. Journal of
Economic Behavior and Organization 21: 235–250.
Martinez-Vazquez J. (2001). Mexico: An evaluation of the main features of the tax adminis-tration. Working Paper, 01-12, Atlanta: Georgia State University.
McLure, C. Jr. and Pardo, S.R. (1992). Improving the administration of the Colombia. In M. Casanegra de Jantscher and R.M. Bird (Eds.), Improving tax administration in developing
countries, 66–110. Washington: International Monetary Fund.
Orviska, M. and Hudson, J. (2002). Tax evasion, civic duty and the law abiding citizen.
European Journal of Political Economy 19: 83–102.
Pommerehne, W.W. and Weck-Hannemann, H. (1996). Tax rates, tax administration and income tax evasion in Switzerland. Public Choice 88: 161–170.
Pyle, D.J. (1993). The economics of taxpayer compliance. In P.M. Jackson (Ed.), Current issues in public sector economics, 58–93. Houndsmills: Mcmillan.
Rose-Ackerman, S. (1997). The political economy of corruption. In K.A. Elliott (Ed.),
Corruption and the global economy, 31–66. Washington DC: Institute for International
Schneider, F. (2002). The size and development of the shadow economies and shadow eco-nomy labor force of 16 Central and South American and 21 OECD countries: First results for the 90s. Working Paper, Johannes Kepler University of Linz.
Silvani C.A. and Radano, A.H.J. (1992). Tax administration reform in Bolivia and Uruguay. In M. Casanegra de Jantscher and R.M. Bird (Eds.), Improving tax administration in
developing countries, 19–59. Washington: International Monetary Fund.
Smith, K.W. (1992). Reciprocity and fairness: Positive incentives for tax compliance. In J. Slemrod (Ed.), Why people pay taxes, 223–250. Tax Compliance and Enforcement, Ann Arbor: University of Michigan Press.
Spicer, M.W. (1986). Civilisation at a discount: The problem of tax evasion. Journal of Public
Economics 46: 13–20.
Tanzi, V. (2000). Policies, institutions and the dark side of economics. Cheltenham, UK: Edward Elgar.
Tanzi, V. and Zee, H.H. (2000). Tax policy for emerging markets: Developing countries.
National Tax Journal 53: 299–322.
Torgler, B. (2001a). Is tax evasion never justifiable? Journal of Public Finance and Public
Choice 19: 143–168.
Torgler, B. (2001b). What do we know about tax morale and tax compliance? RISEC:
International Review of Economics and Business 48: 395–419.
Torgler, B. (2002). Tax morale and institutions (revised). WWZ-Discussion Paper 02/07, Basel: WWZ.
Torgler, B. (2003). Tax morale and tax evasion: Evidence from the United States. WWZ-Discussion Paper 03/01, Basel: WWZ.
Tyler, T.R. and McGraw, K.M. (1986). Ideology and the interpretation of personal experience: Procedural justice and political quiescence. Journal of Social Issues 42: 115–128. Tyler, T.R., Casper, J.D. and Fisher, B. (1989). Maintaining allegiance toward political
au-thorities: The role of prior attitudes and the use of fair procedures. American Journal of
Political Science 33: 629–652.
Weck, H. (1983). Schattenwirtschaft: Eine Möglichkeit zur Einschränkung der öffentlichen
Verwaltung? Eine ökonomische Analyse. Finanzwissenschaftliche Schriften 22. Bern: