HAL Id: hal-01103219
https://hal.sorbonne-universite.fr/hal-01103219
Submitted on 14 Jan 2015HAL is a multi-disciplinary open access archive for the deposit and dissemination of sci-entific research documents, whether they are pub-lished or not. The documents may come from teaching and research institutions in France or abroad, or from public or private research centers.
L’archive ouverte pluridisciplinaire HAL, est destinée au dépôt et à la diffusion de documents scientifiques de niveau recherche, publiés ou non, émanant des établissements d’enseignement et de recherche français ou étrangers, des laboratoires publics ou privés.
Natural history of allergic sensitization in infants with
early-onset atopic 1 dermatitis: results from ORCA
Study
Jocelyne Just, Emmanuelle Deslandes-Boutmy, Flore Amat, Kristell
Desseaux, Ariane Nemni, Emmanuelle Bourrat, Fatia Sahraoui, Isabelle
Pansé, Martine Bagot, Sébastien Fouéré
To cite this version:
Jocelyne Just, Emmanuelle Deslandes-Boutmy, Flore Amat, Kristell Desseaux, Ariane Nemni, et al.. Natural history of allergic sensitization in infants with early-onset atopic 1 dermatitis: results from ORCA Study. Pediatric Allergy and Immunology, Wiley, 2014, 25, pp.668-673 �10.1111/pai.12287�. �hal-01103219�
Natural history of allergic sensitization in infants with early-onset atopic
1
dermatitis: results from ORCA Study
2
Jocelyne Just MD PhD1,2,3, Emmanuelle Deslandes-Boutmy PhD4, Flore Amat 3
MD1,2,3,Kristell Desseaux MSc4, Ariane Nemni MD1, Emmanuelle Bourrat MD5, Fatia 4
Sahraoui MD1, Isabelle Pansé MD5, Martine Bagot MD PhD5, Sébastien Fouéré MD, 5
MSc5. 6
1 AP-HP- Service d’Allergologie Pédiatrique, Hôpital d'Enfants Armand-Trousseau, 7
Paris, France 8
2 INSERM, UMR S 1136, Institut Pierre Louis d’Epidémiologie et de Santé Publique, 9
Equipe EPAR, F-75013, Paris, France 10
3
Sorbonne Universités, UPMC Univ Paris 06, UMR S 1136, Institut Pierre Louis 11
d’Epidémiologie et de Santé Publique, Equipe EPAR, F-75013, Paris, France 12
4
Service de biostatistique et informatique médicale, Hôpital Saint-Louis, INSERM, U 13
717, Université Paris 7, F-75010, Paris, France. 14
15 5
AP-HP- Service de Dermatologie, Hôpital Saint-Louis, Paris, France 16
17
Running title : biological outcomes of infants from ORCA Study
18 19
Address for correspondence
20
Pr. Jocelyne JUST 21
Service d’Allergologie Pédiatrique ; Groupe Hospitalier Trousseau - La Roche 22
Guyon, 26, avenue du Docteur Arnold Netter, 75012 PARIS. FRANCE 23 Tel. +33 1 44 73 63 17 24 Fax: +33 1 44 73 66 35 25 E-mail: jocelyne.just@trs.aphp.fr 26
Total word count: 2489. Tables: 2. Figures: 3 27
ABSTRACT
28
Just J, Deslandes-Boutmy E, Amat F,Desseaux K, Nemni A, Bourrat E, Sahraoui F, 29
Pansé I, Bagot M, Fouéré S 30
31
Natural history of allergic sensitization in infants with early-onset atopic
32
dermatitis: results from ORCA Study
33 34
Pediatr Allergy Immunol
35 36
BACKGROUND: Early-onset atopic dermatitis (AD) is a particular phenotype that 37
may convey a risk of developing multiple sensitizations to allergens but little is known 38
about the pathway of sensitization. The aims of this study were to describe the 39
natural history of sensitization to allergens for this phenotype and to identify the most 40
predictive marker associated with the risk of developing sensitization to inhaled 41
allergens in a well-selected cohort of infants with AD. METHODS: Infants with active 42
AD were enrolled and prospectively explored for biological markers of atopy every 43
year until the age of 6 years. Allergic sensitization was defined as the presence of 44
positive specific IgEs to allergens and multiple sensitizations as being sensitized to 45
≥2 allergens. Elevated blood eosinophilia was defined as an eosinophil blood count 46
≥470 eosinophils/mm3 and elevated total IgE as a serum IgE level ≥45 kU/L. 47
RESULTS: 229 infants were included. Elevated blood eosinophilia was observed at 48
baseline in 60 children (26.2%) and elevated total IgE in 85 (37.1%). When elevated 49
at baseline, eosinophilia and IgE levels remained significantly higher during the 50
follow-up period. Sensitization to food allergens decreased from 58% to 34% 51
whereas sensitization to inhaled allergens increased over time from 17% to 67%. 52
Initial multiple sensitizations to food allergens were the most predictive factor for the 53
risk of developing sensitization to inhaled allergens at 6 years (OR 3.72 [1.68-8.30] 54
p<0.001). CONCLUSIONS: In the early-onset AD phenotype, multiple sensitization 55
to food allergens conveys a higher risk of sensitization to inhaled allergens than 56
single sensitization. 57
Key words Atopic dermatitis, sensitization, food allergens, inhaled allergens,
58 phenotypes, cohort 59 60 61 62 63 64 65 66 67 68 69 70 71 72 73 74 75 76 77 78 79 80 81 82 83 84 85 86 87 88
Introduction
89
Atopic dermatitis (AD), which often begins in infancy, is a chronic inflammatory 90
disorder of the skin that affects 10 to 30% of children {1}. Prevalence of sensitization 91
to inhaled allergens in the general population is between 16 to 25% [2]. It is 92
suspected that there is a link between AD and the occurrence of sensitization to 93
inhaled allergens during childhood. This could be because of percutaneous entry of 94
the allergens through an impaired skin barrier due to inflamation. Moreover, early-95
onset AD, as well as the severity of AD, has been shown to be associated with a risk 96
of sensitization to food allergens at 3 months of age [3]. Sensitization to food 97
allergens in birth cohorts, particularly elevated egg-specific IgE, has also been shown 98
to be a risk marker for sensitization to inhaled allergens later in life {4}. Furthermore, 99
sensitization to inhaled allergens can predict the occurrence of respiratory disease 100
which can start years before the first symptoms of allergic rhinitis or asthma [5]. All in 101
all, AD could be the first step leading to asthma, particularly in children with severe 102
[6] or early-onset AD [7]. However, the early-onset and severe phenotype of AD is 103
quite rare; e.g., in Flohr et al.'s study {3} conducted in 619 infants from a population 104
of breastfed infants, only 3.6% had severe AD and 5.4% were sensitized to at least 105
one food allergen. This makes it relatively difficult to explore this phenotype. We 106
therefore set out to explore a cohort of children suffering from early-onset AD from 107
the prospective longitudinal ORCA (Observatory of Respiratory risks linked with 108
Cutaneous Atopy) study to try to describe this phenotype more precisely. The 109
objectives of the present analysis were to describe the natural history of sensitization 110
in this cohort and then to identify the best marker associated with the risk of 111
developing sensitization to inhaled allergens. 112
Methods
113
Design
114
Patients were part of the ten-year (2002-2012) Observatory of Respiratory risks 115
linked with Cutaneous Atopy (ORCA) Study resulting from the collaboration between 116
two tertiary care centers, the Allergology Department at the Armand Trousseau 117
Children‘s Hospital and the Dermatology Department at the Saint-Louis Hospital, 118
both in Paris, France. The study prospectively included children with AD referred to 119
the Saint-Louis Hospital by a primary care physician. 120
Ethics
121
Parents of each child provided written informed consent at inclusion. The protocol 122
was endorsed by the Institutional Review Board of the Medical Ethics Committee on 123
Research of the Saint-Louis Hospital. Data were collected for the study with respect 124
to the confidentiality of patient records. 125
Inclusion criteria We considered for inclusion all the children meeting the following
126
criteria: i. aged younger than 12 months, ii. with an active AD diagnosed by a 127
dermatologist according to the United Kingdom Working Party criteria (UKWP) {8} 128
and ISAAC questionnaire {9}, iii. without a history of wheezing. 129
Data collection at inclusion
130
Clinical data collected were: 131
1. Gender 132
2. Active AD defined by ISAAC questionnaire {9} and AD severity assessed by 133
the SCORAD questionnaire [10]. We defined a low severity group for children 134
when the SCORAD was under 15, a medium severity group when the 135
SCORAD was between 15 and 40, and a high severity group when the 136
SCORAD was above 40. 137
3. Any documented food allergy defined by relevant allergic symptoms following 138
consumption of a food allergen associated with a sensitization to the same 139
allergen. 140
Biological markers of atopy measured in peripheral blood included: 141
1. Specific IgEs for inhaled and food allergens (ImmunoCAP Phadiatop Infant; 142
Uppsala, Sweden). Sensitization was defined as a specific IgE concentration 143
≥0.35 kU/L in serum against one of the following inhaled and food allergens: 144
house dust mite (HDM), cat and dog dander, pollens (birch tree, timothy grass, 145
mugwort), cockroaches; cow's milk, hen’s egg, peanut, soy, fish and wheat. 146
Multiple sensitizations were defined as at least two positive specific IgEs to 147
allergens. 148
2. Other biological markers such as blood eosinophilia (cell counting by 149
automated Sysmex; France), and total IgE (measured by ImmunoCAP; 150
Uppsala, Sweden). Thresholds were used to define increased levels: 151
increased blood eosinophilia was defined as a concentration of 470 152
eosinophils/mm3 or more and increased total IgE as a concentration of 45 kU/L 153
or more [11]. 154
Prospective data collection
155
Children were followed up on biological parameters at the age of 6 months and then 156
annually until the age of 6 years. Biological parameters assessed at each visit were: 157
specific IgE levels against inhaled and food allergens; blood eosinophilia; and total 158
IgE levels, as described above. 159
160
Statistical analysis
161
All the results were calculated from the export database. Statistical analysis was 162
performed using the Open Source R software (> R 2.13.1) [R Development Core 163
Team (2009). R: A language and environment for statistical computing. R Foundation 164
for Statistical Computing, Vienna, Austria. ISBN 3-900051-07-0, URL http://www.R-165
project.org.]. Observed distributions of variables are described as numbers and 166
percentages for categorical variables and means, standard deviations and ranges for 167
continuous variables. The baseline characteristics of the patients were compared by 168
the chi-square test or Fisher's exact test for categorical variables and Welsh’s 169
student test for continuous variables. The variables defining severity of AD were 170
discretized in three classes according to the SCORAD questionnaire as described 171
above. Clinical and biological features associated with the risk of developing 172
sensitization to inhaled allergens by the end of the follow-up period were calculated 173
with a logistic regression model. These prognostic factors (p<0.2) were then included 174
in the multivariate analysis. Estimated OR are given with a 95% Confidence Interval. 175
Survival analysis, describing time to sensitization (sensitization to inhaled allergens), 176
was performed by Kaplan–Meier analysis. For Kaplan–Meier analysis, we analysed 177
all clinical events by time to first event. 178
179
180
Results
182
Three hundred children were initially considered for inclusion. Twenty-nine were 183
excluded (21 for lack of parental consent, 7 for a previous history of wheezing and 184
one for gluten intolerance). 42 were lost to follow-up immediately after the inclusion 185
visit and were not included in the analysis. The remaining 229 patients were included 186
for baseline characteristics analysis. 190 completed the last visit and formed the final 187
sample. The baseline characteristics of the children who were not included in the 188
final analysis did not differ from those of the final sample (data not shown). Figure 1 189
summarizes the patients flowchart. 190
Descriptive data at baseline
191
Clinical parameters. There were 134 boys (58.5%) and the mean age was 6.5±2.7
192
months (mean ±SD). Mean SCORAD was 34.2±21.0 (mean±SD). Food allergy was 193
present in 6% (13/229) of the children. 173 children (75.6%) had a parental history of 194
atopy. 195
Biological markers
196
Blood eosinophilia. Increased levels of blood eosinophilia were observed in 26.2 %
197
(59/225) with an average value of 356.2±548.7/mm3 (mean ±SD). 198
Total IgE. Increased total IgE was observed in 36.9 % (83/225) with an average
199
value of 111.2±316.1 KU/L (mean ±SD). 200
Specific IgE. 58% (132/229) of the children had sensitization to food allergens and
201
37 % (86/229) multiple sensitizations. Hen’s egg, cow's milk, peanut represented 202
95% (125/132) of sensitization to food allergens (hen’s egg 44%, cow’s milk 26%, 203
peanut 25%, fish 4%, wheat 3%, soy 2.2%). Seventeen percent (40/229) of the 204
children were sensitized to at least one inhaled allergen. Cat dander represented 205
52% (21/40) of sensitization to inhaled allergens, HDM and dog dander 17 % (7/40), 206
all the pollens 12% (5/40) and cockroaches 2.5 % (1/40). 207
Descriptive atopic biological markers during the follow-up period
208
Changes in blood eosinophilia. Analysis by a linear mixed model taking the level of
209
blood eosinophilia at baseline variable as an interaction with time showed that levels 210
of eosinophilia remained on average significantly higher in children with an increased 211
level of blood eosinophilia at baseline, compared to those with a low level at baseline 212
(+705/mm3 vs +76.1/mm3 over the follow-up period, respectively, p<0.001). 213
Changes in total IgE. Analysis based on a linear mixed model of the total IgE level
214
variable considered as an interaction with time showed that children with an 215
increased total IgE at baseline had significantly higher average values throughout 216
follow-up than the children in whom the initial total IgE value was normal (+284.6 217
kU/L vs +39.2 kU/L over the follow-up period, p<0.001) (Figure 2). 218
Changes in specific IgEs.
219
Overall, sensitization to food allergens decreased from 58% (132/229) at inclusion to 220
34% (66/195) at the end of the follow-up period. In contrast, the percentage of 221
children sensitized to inhaled allergens increased over time from 17% (39/229) at 222
inclusion to 67% (130/195) at the end of follow up. 46% (90/195) of the children were 223
sensitized to both food and inhaled allergens at the end of the follow-up compared to 224
17% (39/229) at baseline. More precisely, at the end of the follow-up period 225
sensitization to inhaled allergens consisted of timothy grass pollens (30%), HDM 226
(28%) while sensitization to cat dander decreased to 18%. Sensitization to dog 227
dander remained stable at around 5%, as well as birch pollen that represented 18% 228
of sensitizations. Hen’s egg, cow's milk and peanut together represented 86% of 229
sensitizations to food allergens, with 35%, 29% and 22% for peanut, egg and cow's 230
milk respectively (Figure 3). 231
232
Factors associated with the risk of sensitization to inhaled allergens at the end
233
of the follow-up period
234
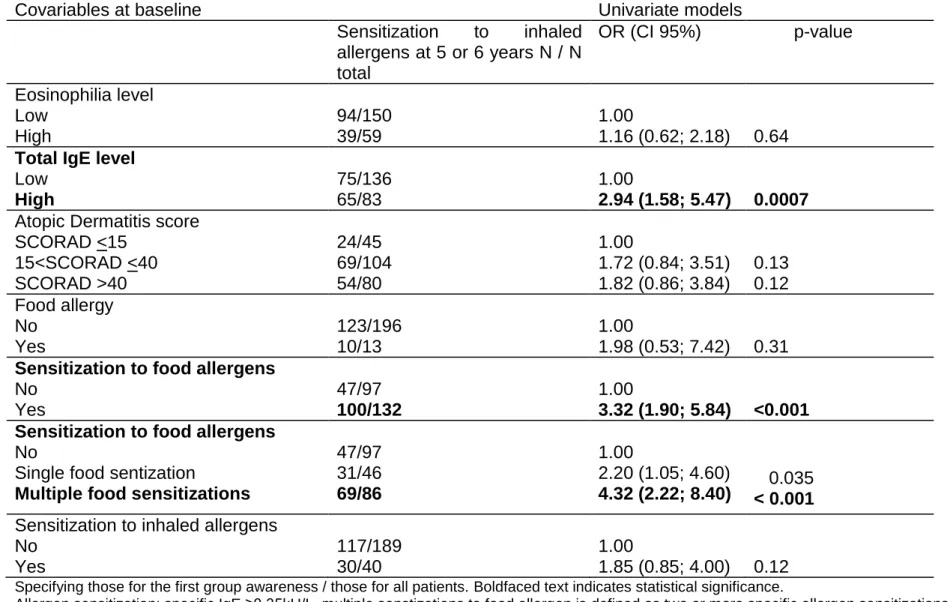
In univariate analysis, clinical and biological markers were evaluated as risk factors
235
for developing inhaled sensitization (Table 1). No clinical parameters (such as 236
severity of atopic dermatitis or food allergy) were found to be risk factors. In contrast, 237
elevated total IgE at baseline emerged as a risk factor for developing sensitization to 238
inhaled allergens at the end of follow up (OR 2.94 {1.58-5.47} p< 0.001). One 239
hundred infants (76.9%) sensitized to food allergens were sensitized to inhaled 240
allergens at 6 years (OR 3.32 {1.90-5.84} p<0.001). More precisely, infants with 241
multiple sensitizations to food allergens were more likely to be sensitized to inhaled 242
allergens (OR 4.32 {2.22-8.40} p< 0.001) than infants with a single food sensitization 243
(OR 2.20 {1.05-4.60} p=0.035). 244
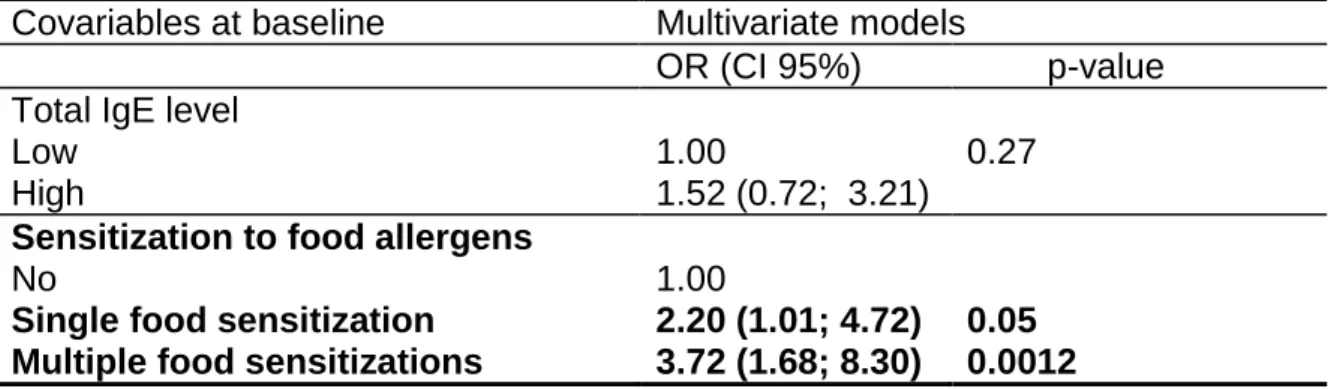
In multivariate analysis, only sensitization to food allergen remained a determinant
245
and multiple food sensitizations were the most predicitve marker associated with the 246
risk of developing sensitization to inhaled allergens at shool age (OR 3.72 {1.68-8.30} 247
p<0.001). This was almost double than that for children with one food sensitization 248 (OR 2.20 {1.01- 4.72} p=0.05) (Table 2). 249 250 251 252 253 254 255
Discussion
256
The main result of this study is that multiple sensitizations to food allergens as 257
opposed to a single sensitization, could be a predictor of sensitization to inhaled 258
allergens in children suffering from early-onset AD. This finding leads to the 259
emergence of a particular phenotype of sensitizations in early-onset AD. 260
261
High T-helper cell 2 (Th2) dominant lymphocyte pattern exists in early-life and
262
persists during preschool age
263
We have shown that both elevated blood eosinophilia and elevated total IgE seem to 264
follow a track during childhood for infants with a particular phenotype of AD. This 265
corresponds to what is known as the extrinsic form of AD as opposed to the intrinsic 266
form. While both forms are clinically identical, the former is characterized by high 267
levels of specific IgEs. Yamamoto et al. {12} reported significant differences in terms 268
of heterogeneity of the interleukin 5 gene between AD with high and low blood 269
eosinophil levels. Thus AD can present different clinical phenotypes-genotypes. 270
There is considerable evidence that some individuals with AD present immune 271
dysregulation, including increased serum IgE and allergen sensitization, and 272
increased Th2 cytokine expression in eczematous lesions {13}. Genetic factors 273
predispose atopic subjects to mount exaggerated Th2 responses {14} and to 274
exaggerated abnormality of the epidermal barrier {15}, which may favor allergic 275
sensitization. Recently, Suárez-Fariñas et al. {16} demonstrated a significant 276
correlation between IgE levels and SCORAD scores (r=0.76, p<10-5) only in patients 277
with extrinsic AD. 278
Sensitizations to food allergens move towards sensitizations to inhaled
280
allergens in some children suffering from early-onset AD Extrinsic AD implies
281
the presence of a Th2 lymphocyte pattern with a cytokine profile facilitating an IgE 282
response to environmental antigens. It is therefore hardly surprising that early 283
expression of IgE-mediated sensitization to food is accompanied by a high risk of 284
sensitization to inhaled allergens. This fact is in accordance to results published from 285
the DARC cohort, in which predominately sensitization to foods, however shifting 286
toward inhalant allergens with age ( Eller E, Kjaer HF, Høst A, Andersen KE, 287
Bindslev-Jensen C.Development of atopic dermatitis in the DARC birth cohort. 288
Pediatr Allergy Immunol. 2010 Mar;21(2 Pt 1):307-14.) 289
In the case of early-onset eczema, IgE sensitization often occurs weeks or months 290
after the eczema lesions first appear, suggesting the allergens are first introduced 291
through the skin. Once allergens have penetrated the skin barrier, they interface with 292
antigen-presenting cells, which can then initiate a Th2 response by dendritic cells 293
{17}. The ensuing cascade can result in a long-lasting response with sensitization of 294
the host. Subsequent exposures can then lead to allergic rhinitis and asthma {18}. 295
A recent larger birth cohort study demonstrated a strong association between food 296
allergen sensitization, especially hen’s egg, and asthma development by age 6 years 297
{19}. Our study therefore confirms that early-onset AD is often associated with 298
sensitization to food allergens and more precisely multiple food sensitizations. 299
300
Multiple food sensitizations are the most predictive biomarker of early
301
sensitization to inhaled allergens
302
These results validate our previous findings that there are multiple atopic phenotypes 303
{20}. In the same way, Lazic et al. {21} recently validated his previous study 304
suggesting that allergic phenotypes change little over time, and that one phenotype 305
with sensitization to a wide variety of allergens was much more likely to give rise to 306
asthma during childhood. This class is relatively unfrequent, comprising 307
approximately one third of the children who would be considered atopic by 308
conventional criteria. In the same manner, in a particular phenotype with early-onset 309
AD, we have shown here that sensitization to food allergens conveys a high risk of 310
sensitization to inhaled allergens rather when multiple than when unique. This finding 311
supports the hypothesis that the clinical expression of allergic diseases does not 312
merely depend on the presence of specific IgE antibodies, but rather on patterns of 313
IgE responses over time. 314
315
Strength and limitations of our study
316
The strength of the study resides in the fact that it was a longitudinal prospective 317
cohort in a highly selected population of infants with early-onset AD explored 318
annually in a standardized manner. However, one limitation could be the rather small 319
size of the cohort and the absence of a control group. However, as mentioned in the 320
introduction, we selected a rare but potentially severe phenotype i.e., early-onset AD. 321
In this context, the size of this selected population was greater than the number of 322
patients suffering from this phenotype if selected from a large birth cohort. It would 323
have been of interest to know if multiple food sensitizations could predict not only 324
sensitization to inhaled allergens but also to severe allergic diseases such as 325
persistent AD and mainly asthma. Nevertheless, inhaled sensitization has been 326
found to be a strong predictor of asthma development and airway 327
hyperresponsiveness up to school age, which is a strong risk factor for respiratory 328
allergies {22. In the same manner, Kjaer HF et al showed that children with atopic 329
dermatitis, asthma, or rhinoconjunctivitis, and sensitization at 6 yr, were sensitized to 330
food allergens to a large extent (53%, 42%, and 47%, respectively) already at 6 331
months. This relationship will constitute our future research on this cohort. 332
333
In conclusion, Our data have showed longitudinal changes in sensitization patterns
334
of children with early-onset AD and more precisely that multiple food sensitizations, 335
rather than single food sensitization, conveys a high risk of sensitization to inhaled 336
allergens at school age. It is thus important to identify this phenotype during infancy 337
to optimize patient management. 338
Acknowledgements
339
Grants for this study were received from Merck Sharp Dohme. 340
Figure 1. Flow-chart of the study.
342
Legend: AD atopic dermatitis, n number of patients, mean age at each visit is under brackets. 343
Figure 2: Phenotypes of total IgE levels during the 72 months of follow up: changes in the low (<45 kU/L) and high (≥45
345
kU/L) total IgE levels at inclusion. The horizontal lines of the box represent the lower, median and upper quartile, the hatched
346
traits represent the values outside of the whiskers (the ends of the whiskers represent the lowest datum still within 1.5 interquartile 347
range (IQR) of the lower quartile, and the highest datum still within 1.5 IQR of the upper quartile). 348
Figure 3: Changes in each sensitization to food (A) and inhaled allergen (B) during the 72 months of the follow-up
350
Changes are expressed in percentage of sensitized children. HDM house dust mite 351
Table 1: Estimated univariate OR of variables at baseline associated to sensitization to inhaled allergens at the end of
354
follow up
355
Covariables at baseline Univariate models
Sensitization to inhaled allergens at 5 or 6 years N / N total OR (CI 95%) p-value Eosinophilia level Low High 94/150 39/59 1.00 1.16 (0.62; 2.18) 0.64
Total IgE level
Low High 75/136 65/83 1.00 2.94 (1.58; 5.47) 0.0007
Atopic Dermatitis score SCORAD <15 15<SCORAD <40 SCORAD >40 24/45 69/104 54/80 1.00 1.72 (0.84; 3.51) 1.82 (0.86; 3.84) 0.13 0.12 Food allergy No Yes 123/196 10/13 1.00 1.98 (0.53; 7.42) 0.31
Sensitization to food allergens
No Yes 47/97 100/132 1.00 3.32 (1.90; 5.84) <0.001 Sensitization to food allergens
No
Single food sentization
Multiple food sensitizations
47/97 31/46 69/86 1.00 2.20 (1.05; 4.60) 4.32 (2.22; 8.40) 0.035 < 0.001
Sensitization to inhaled allergens No Yes 117/189 30/40 1.00 1.85 (0.85; 4.00) 0.12
Specifying those for the first group awareness / those for all patients. Boldfaced text indicates statistical significance.
356
Allergen sensitization: specific IgE ≥0.35kU/L. multiple senstizations to food allergen is defined as two or more specific allergen sensitizations.
Table 2: Estimated multivariate OR of variables at baseline associated to sensitization to inhaled allergens at the end of
359
follow up
360 361
Covariables at baseline Multivariate models
OR (CI 95%) p-value Total IgE level
Low High
1.00
1.52 (0.72; 3.21)
0.27
Sensitization to food allergens
No
Single food sensitization Multiple food sensitizations
1.00 2.20 (1.01; 4.72) 3.72 (1.68; 8.30) 0.05 0.0012 362
Allergen sensitization: specific IgE≥0.35kU/L. Multiple senstization to food allergen is defined as sensitization to two or more 363
specific allergens. Risk factors associated with allergic sensitization to inhaled allergens in the univariate analysis (p<0.2) are 364
included in the multivariate analysis. Boldface values indicate statistical significance. 365
366 367 368
References
370
1. Williams H, Stewart A, von Mutius E, Cookson W and Anderson HR. Is eczema 371
really on the increase worldwide? J Allergy Clin Immunol 2008; 121:947–54. 372
2. Migueres M, Davila I, Frati F, Azpeita A, Jeanpetit Y, Lhéritier-Barrand M, et al. 373
Types of sensitization to aeroallergens: definitions, prevalences and impact on the 374
diagnosis and treatment of allergic respiratory disease. Clin Tr Allergy 2014; 4:16 375
3. Flohr C, Perkin M, Logan K, Marrs T, Radulovic S, Campbell LA, et al. Atopic 376
dermatitis and disease severity are the main risk factors for food sensitization in 377
exclusively breastfed infants. J Invest Dermatol 2014; 134:345-50 378
4. Asarnoj A, Ostblom E, Kull I, Lilja G, Pershagen G, Hedin G, et al. Sensitization to 379
inhalant allergens between 4 and 8 years of age is a dynamic process: results friom 380
the BAMSE birth cohort. Clin Exp Allergy 2008; 38: 1507-1513 381
5. Hatzler L, Panetta V, Lau S, Wagner P, Bergmann R, Illi S, et al. Molecular 382
spreading and predictive value of preclinical IgE response to Phleum pretense in 383
children with hay fever. J Allergy Clin Immunol 2012: 130; 894-901 384
6. Silverberg J, Simpson EL. Association between severe eczema in children and 385
multiple comorbid conditions and increased healthcare utilization. Pediatr Allergy 386
Immunol 2013; 24: 476-86 387
7. Carlsten C, Dimich-Ward H, Ferguson A, Watson W, Rousseau R, Dybuncio A, et 388
al. Atopic dermatitis in a high-risk cohort: natural history, associated allergic 389
outcomes, and risk factors. Ann Allergy Asthma Immunol 2013; 110:24-8 390
8. Williams HC, Burney PG, Pembroke AC, Hay RJ. Validation of the UK diagnostic 391
criteria for atopic dermatitis in a population setting. UK Diagnostic for Atopic 392
Dermatitis Working Party. Br J Dermatol 1996; 135: 12-17 393
9.Asher MI, Montefort S, Bjorksten B, Lai CK, Strachan DP, Weiland SK, et al. 394
Worldwide time trends in the prevalence of symptoms of asthma, allergic 395
rhinoconjunctivitis, and eczema in childhood: ISAAC Phase One and Three repeat 396
multicountry cross-sectional surveys. Lancet 2006; 368 (9537): 733-43. 397
10. Gelmetti C, Colonna C. The value of SCORAD and beyond. Towards a 398
standardized evaluation of severity? Allergy 2004; 59: 61-65 399
11. Just J, Nicoloyanis N, Chauvin M, Pribil C, Grimfeld A, Duru G. Lack of 400
eosinophilia can predict remission in wheezy infants? Clin Exp Allergy 2008; 38: 767-401
73 402
12. Yamamoto N, Sugiura H, Tanaka K, Uehara M. Heterogeneity of interleukin 5 403
genetic background in atopic dermatitis patients: significant difference between those 404
with blood eosinophilia and normal eosinophil levels, J Dermatol Sci 2003; 33:121–6 405
13. Brown S and Reynolds NJ, Atopic and non-atopic eczema. BMJ 2006; 332:584-8. 406
14.Haagerup A, Bjerke T, Schiotz PO, Dahl R, Binderup HG, Tan Q et al. Atopic 407
dermatitis—a total genome-scan for susceptibility genes. Acta Derm Venereol 2004; 408
84:346–52. 409
15. Cork MJ, Danby SG, Vasilopoulos Y, Hadgraft J, Lane ME, Moustafa M et al. 410
Epidermal barrier dysfunction in atopic dermatitis. J Invest Dermatol 2009; 129:892– 411
1908. 412
16.Suárez-Fariñas M, Dhingra N, Gittler J, Shemer A, Cardinale I, de Guzman Strong 413
C et al. Intrinsic atopic dermatitis shows similar TH2 and higher TH17 immune 414
activation compared with extrinsic atopic dermatitis. J Allergy Clin Immunol. 2013; 415
132:361-70. 416
17. Nemoto-Hasebe I, Akiyama M, Nomura T, Sandilands A, McLean WH, Shimizu 417
H. Clinical severity correlates with impaired barrier in filaggrin-related eczema. J 418
Invest Dermatol 2009; 129:682–9. 419
18. Hudson TJ. Skin barrier function and allergic risk, Nat Genet 2006; 38:399–400. 420
19. Bekkers MB, Aalberse RC, Gehring U, Kerkhof M, Koppelman GH, de Jongste 421
JC et al. Hen's egg, not cow's milk, sensitization in infancy is associated with asthma: 422
10-year follow-up of the PIAMA birth cohort. J Allergy Clin Immunol 2013; 132:1427-423
8. 424
20. Just J, Saint-Pierre P, Gouvis-Echraghi R, Laoudi Y, Roufai L, Momas I et al. 425
Childhood allergic asthma is not a single phenotype. J Pediatr 2014; 164:815-20. 426
21. Lazic N, Roberts G, Custovic A, Belgrave D, Bishop CM, Winn J et al. Multiple 427
atopy phenotypes and their associations with asthma: similar findings from two birth 428
cohorts. Allergy 2013; 68:764-70. 429
22. Illi S, von Mutius E, Lau S, Nickel R, Gruber C, Niggemann B et al. The natural 430
course of atopic dermatitis from birth to age 7 years and the association with asthma. 431
J Allergy Clin Immunol 2004; 113:925–31. 432