HAL Id: hal-01547481
https://hal-agroparistech.archives-ouvertes.fr/hal-01547481
Submitted on 29 May 2020
HAL is a multi-disciplinary open access archive for the deposit and dissemination of sci-entific research documents, whether they are pub-lished or not. The documents may come from teaching and research institutions in France or abroad, or from public or private research centers.
L’archive ouverte pluridisciplinaire HAL, est destinée au dépôt et à la diffusion de documents scientifiques de niveau recherche, publiés ou non, émanant des établissements d’enseignement et de recherche français ou étrangers, des laboratoires publics ou privés.
Protein feeding pattern, casein feeding, or milk-soluble
protein feeding did not change the evolution of body
composition during a short-term weight loss program
S. Adechian, M. Balage, D. Remond, C. Migne, A. Quignard-Boulange, A.
Marsset-Baglieri, S. Rousset, Y. Boirie, C. Gaudichon, Dominique Dardevet,
et al.
To cite this version:
S. Adechian, M. Balage, D. Remond, C. Migne, A. Quignard-Boulange, et al.. Protein feeding pattern, casein feeding, or milk-soluble protein feeding did not change the evolution of body composition during a short-term weight loss program. AJP - Endocrinology and Metabolism, American Physiological Society, 2012, 303 (8), pp.E973 - E982. �10.1152/ajpendo.00285.2012�. �hal-01547481�
Protein feeding pattern, casein feeding, or milk-soluble protein feeding did
not change the evolution of body composition during a short-term weight
loss program
Solange Adechian,1Michèle Balage,1Didier Remond,1Carole Migné,1Annie Quignard-Boulangé,2 Agnès Marset-Baglieri,2Sylvie Rousset,1Yves Boirie,1Claire Gaudichon,2Dominique Dardevet,1 and Laurent Mosoni1
1Unité de Nutrition Humaine, Unité Mixte de Recherche 1019, Institut National de la Recherche Agronomique, Clermont
Université, Université d’Auvergne, Unité de Nutrition Humaine, Clermont-Ferrand, France; and2Unité Mixte de Recherche
0914, Institut National de la Recherche Agronomique/Institut National Agronomique Paris Grignon/AgroParisTech, Physiologie de la Nutrition et du Comportement Alimentaire, Alimentation Humaine, Centre de Recherche de Paris, Paris France
Submitted 5 June 2012; accepted in final form 1 August 2012 Adechian S, Balage M, Remond D, Migné C, Quignard-Bou-langé A, Marset-Baglieri A, Rousset S, Boirie Y, Gaudichon C, Dardevet D, Mosoni L. Protein feeding pattern, casein feeding, or
milk-soluble protein feeding did not change the evolution of body composition during a short-term weight loss program. Am J Physiol
Endocrinol Metab 303: E973–E982, 2012. First published August 14,
2012; doi:10.1152/ajpendo.00285.2012.—Studies have shown that timing of protein intake, leucine content, and speed of digestion significantly affect postprandial protein utilization. Our aim was to determine if one can spare lean body mass during energy restriction by varying the quality and the timing of protein intake. Obese volunteers followed a 6-wk restricted energy diet. Four groups were compared: casein pulse, casein spread, milk-soluble protein (MSP,⫽ whey) pulse, and MSP spread (n ⫽ 10–11 per group). In casein groups, caseins were the only protein source; it was MSP in MSP groups. Proteins were distributed in four meals per day in the propor-tion 8:80:4:8% in the pulse groups; it was 25:25:25:25% in the spread groups. We measured weight, body composition, nitrogen balance, 3-methylhistidine excretion, perception of hunger, plasma parameters, adipose tissue metabolism, and whole body protein metabolism. Volunteers lost 7.5⫾ 0.4 kg of weight, 5.1 ⫾ 0.2 kg of fat, and 2.2 ⫾ 0.2 kg of lean mass, with no difference between groups. In adipose tissue, cell size and mRNA expression of various genes were reduced with no difference between groups. Hunger perception was also never different between groups. In the last week, due to a higher inhibition of protein degradation and despite a lower stimulation of protein synthesis, postprandial balance between whole body protein synthesis and degradation was better with caseins than with MSP. It seems likely that the positive effect of caseins on protein balance occurred only at the end of the experiment.
lean body mass; fat mass; casein; whey; protein metabolism
OBESITY HAS NOW REACHEDepidemic proportions. In 2008, more
than one billion adults were overweight, and 500 million were clinically obese (18). Obesity is a risk factor for the develop-ment of chronic diseases like cardiovascular diseases and diabetes, and it contributes strongly to the global burden of associated health costs. Since most medications have now been pulled from the market, obese individuals seeking weight loss often use restrictive diets. These lead to a reduction in
adipos-ity but also to a loss of metabolically active mass, i.e., fat-free mass including muscle mass (11). This loss should be mini-mized. In particular, muscle is an emergency store of amino acids that are used in case of nutritional, traumatic, or infec-tious stresses. The objective of this work was to minimize this loss of metabolically active tissue by optimizing protein nutri-tion during energy restricnutri-tion.
It is known that lean mass wasting can be limited by including a sufficient amount of protein in the energy-restricted diet (26, 32). However, little is known about the effects of the nature and timing of ingested proteins in such situations.
A series of studies performed after a test meal in healthy young subjects or during aging have shown that protein leucine content, timing of protein intake, and speed of digestion-absorption of proteins have a strong influence on protein metabolism (3– 6, 9, 13–15, 24, 34, 36). It has been shown that, in old subjects, due to a lower sensitivity of muscle protein synthesis to stimulation, a quick and intense rise in plasma amino acids, and in particular leucine, promoted the most efficient protein anabolism at the whole body level or in muscle (3, 5, 6, 14, 15, 34, 36). Such a rise can be obtained after milk-soluble protein (MSP), i.e., whey ingestion, since these proteins are rapidly digested and are leucine rich, or when lunch contains a large amount of protein (pulse protein feeding pattern). Inversely, in young subjects, it was rather with a low but prolonged rise in plasma amino acids as seen after casein ingestion (slowly digested proteins) or when protein intake is spread over the day that the best protein anabolism was obtained (5, 9, 24). This result may be related to lower amino acid oxidation and a more prolonged inhibition of protein degradation. The difference between young and old subjects could result from the presence of oxidative stress/inflammation during aging, since it was shown that the sensitivity of aged muscle protein synthesis to feeding could be restored by anti-inflammatory drug (ibuprofen) (37) or antioxidant supple-mentation (33).
Although it has been suggested that leucine-rich protein could be interesting in the treatment of obesity (27), compar-isons between caseins and MSP or between spread and pulse protein feeding pattern have never been tested during energy restriction in obese subjects. What would be best to spare lean body mass, an intense rise in plasma amino acid (MSP, pulse pattern) or a low and prolonged rise (caseins, spread pattern)?
Address for reprint requests and other correspondence: L. Mosoni, UMR 1019 Nutrition Humaine, équipe NuTriM, INRA, Theix, 63122 Saint-Genès Champanelle, France (e-mail: laurent.mosoni@clermont.inra.fr).
Am J Physiol Endocrinol Metab 303: E973–E982, 2012.
First published August 14, 2012; doi:10.1152/ajpendo.00285.2012.
0193-1849/12 Copyright©2012 the American Physiological Society
http://www.ajpendo.org E973
by 10.220.33.6 on December 6, 2016
http://ajpendo.physiology.org/
It could be anticipated that an intense rise would be better, since it has been reported that obesity, like aging, is associated with inflammation and oxidative stress (17). It could also be hypothesized that a low and prolonged rise, by minimizing amino acid oxidation, could be particularly useful in the context of energy restriction. Thus, with the aim of optimizing protein nutrition during energy restriction in obese subjects, we undertook a human experiment in which obese subjects were proposed a 6-wk energy restriction diet with caseins or MSP as the unique protein source, these proteins being consumed either spread in equal proportions over four meals a day or given mainly (80%) at lunch. We measured the evolution of body composition and, during the last week of energy restric-tion, whole body protein synthesis, degradarestric-tion, and oxidation. In addition, this work was a good opportunity to learn more about the influence of macronutrient composition on adipocyte function during an energy restriction program because data re-main scarce. The association between gene expression changes in adipose tissue and modification of adipocyte size, an important marker of obesity phenotype, has been recently described during restriction diet trials (38). We further characterized adipose tissue gene expression and determined adipocyte size before and after dietary intervention.
SUBJECTS AND METHODS Nutritional Design
During the 6 wk of the controlled feeding period, our aim was 1) to give an amount of energy equal to the basal energy requirements (calculated from Ref. 19 on the basis of measured weight of the subject); 2) to maintain a normal amount of protein despite this energy restriction, thus providing 25% of energy as proteins; 3) to use as the main source of protein (⬎80%) either caseins or milk-soluble proteins (MSP); 4) to distribute proteins among four meals per day using two different patterns, a pulse protein feeding pattern, with an 8:80:4:8% repartition of proteins in the four meals of the day, and a spread feeding pattern, with a 25:25:25:25% repartition of proteins. Thus, we had four different nutritional groups: pulse caseins, spread caseins, pulse MSP, and spread MSP. Milk proteins were provided to the subjects as dry flavored powders given in four cups per day. The amounts were adjusted to the lean body mass of the subjects. Volun-teers added water and sweetener (hermesetas) according to their taste. The rest of the meals were prepared at home by the subjects according to personalized menus they received from our dieticians (composed of various proportions of spinach, broccoli, lentils, or green beans, butter, bread, fruits, soy yoghurt, rice cakes, gingerbread). They were asked to respect the quantity of food indicated on the menus (they were provided with scales) and to eat at regular and usual hours during the day. On average, subjects consumed 5.87 MJ/day (25% as pro-teins, 25% as lipids, and 50% as carbohydrates) and 87 g of proteins per day.
Subjects
Forty-one subjects (women and men) completed the study (23 stopped the study before the end and were not included in the analyses). They were recruited through a local media campaign and were randomly distributed into the four nutritional groups after medical screening. In the pulse casein, spread casein, pulse MSP, and spread MSP groups, there were, respectively, 10, 10, 10, and 11 subjects, including, respectively, 2, 2, 1, and 3 men. The ages of the subjects were, respectively (means ⫾ SE), 35.1 ⫾ 1.5, 34.6 ⫾ 1.4, 30.6⫾ 2.3, and 33.6 ⫾ 1.8 yr. Their weights at the beginning of the experiment were, respectively, 92.2⫾ 4.3, 90.8 ⫾ 4.2, 93.5 ⫾ 5.5, and 86.0⫾ 3.8 kg. Their body mass indexes were, respectively, 32.0 ⫾
0.8, 33.5⫾ 1.4, 32.9 ⫾ 1.4, 31.9 ⫾ 0.9 kg/m2. All of these values were not significantly different between groups. Each subject had a normal physical examination without any medical history of renal, cardiovascular, endocrine, or currently evolving disease and was sedentary (⬍2 h of exercise/wk). All subjects were asked to maintain their usual physical activity before and during the study. The purpose and potential risks of the study were fully explained to the subjects, and written informed consent was obtained from each participant. The experimental design was approved by the relevant French authorities (CPP AU724). This study was registered with the ClinicalTrials.gov Protocol Registration System, registration no. NCT00690781.
Materials
L-[1-13C]leucine (99 mole percent excess; MPE),L-[5,5,5-2H3]leucine (98 MPE), and [13C]bicarbonate (99 MPE) were purchased from Euriso-top (Saint Aubin, France). Solutions of tracers were tested for sterility and pyrogenicity before use. Caseins and MSP were obtained from Ingredia (Arras, France). They were flavored with natural flavors (chocolate, coffee, caramel, lemon, orange) obtained from Colin ingredients (Mittel-hausen, France).
Experimental Design
After attending an information meeting, signing consent, and un-dergoing medical examination and blood testing, subjects began the protocol with several basal measurements: 1) weight, repeated every week for the 6 wk of the experiment; 2) body composition measured by DEXA (dual-energy X-ray absorptiometry; QDR 4500A; Hologic, Waltham, MA), repeated on the last day of the experiment; 3) body composition, measured by impedancemetry (multifrequency 5–50-100 –200 kHz; Bodystat, Quadscan 4000, UK), repeated in weeks 2, 4, and 6; 4) an enquiry about food habits; 5) an enquiry about perception of hunger: participants asked to rate their hunger and their desire to eat a delicious food by using visual analog scales before and 30 min after each of the three main meals of the day (breakfast, lunch, dinner), repeated on Mondays of weeks 2 and 6; 6) after an overnight fast, a subcutaneous periumbilical adipose tissue biopsy under local anesthe-sia (xylocaïne 1%), repeated during the last week of the experiment. Then, controlled nutrition began (see Nutritional design) on a Monday. Volunteers were weighed every Monday on the scale of the Human Nutrition Research Center (HNRC), and on the last Friday of the experiment. After 1 wk, volunteers came back to the HNRC facilities, and a nitrogen balance measurement was begun from Monday at 1030 to Saturday at 1030 by measuring the difference between ingested nitrogen and excreted nitrogen. Only nitrogen ex-creted in urine was measured, and other nitrogen losses (cutaneous and fecal) were estimated (see Calculations). The meals of the volunteers were prepared in the kitchen of the HNRC. Each item was weighed, and a duplicate meal was prepared for nitrogen content measurement. Volunteers took their lunch in the HNRC and took home their afternoon snack, dinner, and breakfast. They were asked not to throw away what they did not eat, which was weighed and analyzed for nitrogen content. During the same period, the whole urinary production was collected in 2-liter flasks containing 50 ml of 3 N HCl per day. This 5-day collection was pooled, and nitrogen, creatinine, and 3-methylhistidine contents were measured.
During the last week (6th), whole body protein metabolism was measured as described previously (3). Subjects were admitted to the HNRC at 0630 in the postabsorptive state. A catheter was inserted retrogradely into a dorsal vein of the hand for arterialized blood sampling after introduction of the hand into a 60°C heated ventilated box. A second catheter was inserted into a vein of the contralateral arm for tracer infusion. After a prime dose of [13C]bicarbonate (0.09 mg/kg lean body mass), a primed (1.3 mg/kg lean body mass), continuous (1 mg·kg lean body mass⫺1·h⫺1) infusion ofL-[1-13 C]leu-cine was begun and continued for 8 h. After 210 min, a semiliquid diet was given orally for the 270 remaining minutes (from 210 to 480
by 10.220.33.6 on December 6, 2016
http://ajpendo.physiology.org/
min). The diet provided 46.7 kJ/kg lean body mass, 22.6% as protein (in the form of MSP or caseins, depending on the group), 33.7% as carbohydrates (dextrin-maltose hydrolyzed from potato starch of low natural 13C abundance), and 43.7% as fat (in the form of vegetable oil). A raspberry aroma was included in this liquid meal. It was prepared on the day of the protocol, just before the beginning of the study, and was ingested in small (50-ml) aliquots given every 20 min. [2H
3]leucine was added to the meals (0.72 mg·kg lean body mass⫺1·h⫺1) to measure splanchnic extraction. Breath samples were taken before any infusion and at 30-min intervals during the last 90 min of each plateau in the postabsorptive state (i.e., from 120 to 210 min) and in the fed state (from 390 to 480 min). Blood samples were taken before any infusion and every 30 min starting 90 min after the beginning of the infusion. Plasma supernatants were separated and stored at ⫺20°C before we measured [13-C]- and [2H
3]leucine and ketoisocaproate (KIC) enrichments, as well as glucose, insulin, amino acids, urea, cholesterol, and triglyceride contents. Breath samples were kept in 10-ml evacuated containers (Vacutainer; Becton-Dick-inson, Grenoble, France). Total carbon dioxide production rates were measured at isotopic plateau during the last hour of the two postab-sorptive and fed states by an open-circuit indirect calorimeter (Del-tatrac; Datex, Geneva, Switzerland).
Analytic Methods
Plasma [13-C]- and [2H
3]leucine and KIC enrichments were mea-sured by selected ion monitoring electron impact GC-MS (model 5971A; Hewlett-Packard, Palo Alto, CA) with t-butyldimethylsilyl derivatives, and corrections for13C and2H
3enrichments were applied according to Biolo et al. (8). Enrichment plateaus were achieved during both postabsorptive and postprandial states. 13CO
2 isotopic enrichments were measured with a gas isotope ratio-mass spectrom-eter (Gas System; Fisons Instruments, VG Isotech). Plasma concen-trations of amino acids were measured after deproteinization with sulfosalicylic acid by ion exchange chromatography (Bio-Tek Instru-ments ARL; St Quentin Yvelines, France). Plasma urea concentra-tions were measured enzymatically on an autoanalyzer (Cobas Mira; Roche Diagnostic Systems, Neuilly sur Seine, France). Plasma insulin concentrations were determined using a commercial human RIA kit (Insulin CT Cis Bio International). Other plasma measurements were made using commercial kits from Horiba ABX (Montpellier, France). Nitrogen contents in duplicate meals, leftovers, and urine were sured by Kjeldahl method. Urine 3-methylhistidine content was mea-sured by ion exchange chromatography (Bio-Tek Instruments ARL) and urine creatine content using commercial kits from Horiba ABX.
Adipose Tissue Analysis
After collagenase treatment, mature adipocytes were isolated and used for fat cell size determination using a procedure derived from a microphotometric method as previously described (25, 35). Briefly, images of isolated adipocytes were acquired from a light microscope fitted with a camera, and measurement of 200 cell diameters was performed using AxioVision Rel. 4.5 (Le Pecq, France). Mean adi-pocyte diameter for a given subject was defined as the median value for the distribution of adipocyte diameters.
Total RNA was extracted from adipose tissue by using the TRIzol procedure (Invitrogen, Cergy-Pontoise, France), and cDNA was syn-thesized from 400 ng of total RNA using a high-capacity cDNA reverse transcriptase kit (Applied Biosystems, Foster City, CA) in a Peltier Thermal Cycler 200 (MJ Research, Waltham, MA). Real-time PCR was performed using a 7300 Real Time PCR System and a Syber Green kit (Applied Biosystems), and the PCR reaction was carried out as previously described (29). Primer sequences used were as follows (F, forward; R, reverse): adipose triglyceride lipase (ATGL): F CAG-ACG-GCG-AGA-ATG-TCA-TTA-TAT, R TGC-AGA-CAT-TGG-CCT-GGA-T; AdipoQ: F TGT-AGT-ACG-GAG-TTG-TCA-GCA-CTC-A, R CCC-TGG-CAA-TAA-CAT-ACC-ATT-GTA; fatty acid
synthase (FAS): F CAG-ACG-AGA-GCA-CCT-TTG-ATG-A, R CAG-GTC-TAT-GAG-GCC-TAT-CTG-GAT; leptin (Lept): F GGT-TGC-AAG-GCC-CAA-GAA, R ACA-TAG-AAA-AGA-TAG-GGC-CAA-AGC; lipoprotein lipase (LPL): F GGG-AAT-GAG-GTG-GCA-AGT-GT, R CGC-CGA-CCA-AAG-AAG-AGA-TT; monocyte chemotactic protein-1 (MCP1): F CAG-CAG-CAA-GTG-TCC-CAA-AG, R CGG-AGT-TTG-GGT-TTG-CTT-GT. Ribosomal 18S RNA expression was used to account for variability in the initial quantities of mRNA.
Calculations
Leucine kinetics were calculated as described previously (3): Leu Ra⫽ F[13C]Leu ⁄ ([13C]Leu MPE⫻ 0.01) (1) where Leu Ra(mol·kg FFM⫺1·min⫺1) is total leucine systemic flux, F[13C]Leu is the [13C]leucine infusion rate (mol·kg FFM⫺1·min⫺1) corrected for isotopic purity, and [13C]Leu MPE is the plasma [13C]leucine enrichment. This flux includes the tracer infusions. Leucine splanchnic extraction (%) was calculated as follows:
Leu Sp Ext⫽ [1 ⫺ (Ra[13C]Leu ⁄ R
a([2H3]Leu)]⫻ 0.01) (2) where Ra[13C]Leu and Ra[2H3]Leu are total leucine fluxes calculated according to Eq. 1 with either the intravenous13C or oral2H
3tracer. Splanchnic extraction represents the fraction of ingested leucine taken up by the gut and/or liver during its first pass. Leucine oxidation (LeuOx;mol·kg FFM⫺1·min⫺1) was calculated as follows:
LeuOX ⫽ 13CO2excretion ⁄ ([13C]KIC MPE⫻ 0.01) (3) where 13CO
2 excretion (mol·kg FFM⫺1·min⫺1) is the product of CO2production and13CO2atom percent excess (APE), corrected for incomplete recovery by a factor of 0.70 in the postabsorptive state and 0.82 in the fed state, according to Ref. 21. Nonoxidative leucine disposal (NOLD,mol·kg FFM⫺1·min⫺1), an index of whole body protein synthesis, is the difference between total leucine flux and LeuOx. Endogenous leucine production (mol·kg FFM⫺1·min⫺1) rep-resents whole body protein breakdown and is the difference between total leucine flux (minus the intravenous tracer infusion rate) and either leucine intake (Endo Leu Ra) or leucine intake corrected for splanchnic extraction (corrected Endo Leu Ra) calculated as follows: corrected Leu intake⫽ Leu intake ⫻ [1 ⫺ (Leu Sp Ext 0.01)] (4) Finally, net leucine balance is the difference between total leucine intake (including the tracers) and LeuOx.
Nitrogen balance (i.e., nitrogen intake minus nitrogen losses) was calculated from the measurement of nitrogen intake (nitrogen content of duplicate meals minus nitrogen content of leftovers), the measure-ment of urinary nitrogen losses, and an estimation of fecal nitrogen losses based on apparent digestibility of protein (10), cutaneous nitrogen losses being approximated to 8 mg·kg⫺1·day⫺1.
Statistical Analyses
Results are given as means⫾ SE and were compared by ANOVA or repeated-measures ANOVA when measurements were repeated over time (weight, body composition, etc.) using SAS software (SAS 9.0; SAS Institute, Cary, NC). The effects of sex (M/F), protein feeding pattern (spread/pulse), protein source (caseins/MSP), and nutrition (postprandial/postabsorptive) were included in the analyses. If the ANOVA F-test was significant, post hoc Tukey tests were performed to compare means. Differences between means were con-sidered significant when P⬍ 0.05.
RESULTS
Weight and Body Composition
Effect of energy restriction. Volunteers lost an average of
7.5⫾ 0.4 kg of weight during the 40 days of energy restriction E975
MILK PROTEINS AND ENERGY RESTRICTION
AJP-Endocrinol Metab•doi:10.1152/ajpendo.00285.2012•www.ajpendo.org
by 10.220.33.6 on December 6, 2016
http://ajpendo.physiology.org/
(8.7% of initial body weight). DEXA measurements showed that this loss was composed of 3.6⫾ 0.3 kg of fat (11.5% of initial total fat weight) and 3.9⫾ 0.4 kg of lean mass (6.9% of initial total lean mass). The same measurements performed by impedancemetry for a slightly shorter period (36 – 40 days) indi-cated a loss of 5.1 ⫾ 0.2 kg for fat (15.5% of initial total fat weight) and 2.2⫾ 0.2 kg for lean mass (3.8% of initial total lean mass). Impedancemetry showed that there was also a significant loss of extracellular water during energy restriction (⫺4.3 ⫾ 0.5%; not taken into account by DEXA), so that the mean loss of dry lean body mass was 0.4⫾ 0.1 kg.
Comparison between nutritional groups. The evolution of
body weight was similar in all groups, with no effect of protein source and protein feeding pattern, final weight being, respec-tively, 91.0⫾ 0.8, 91.2 ⫾ 0.8, 91.8 ⫾ 0.7, and 91.2 ⫾ 1.0% of initial body weight in the casein pulse, casein spread, MSP pulse, and MSP spread groups (Fig. 1). Similarly, both DEXA and impedancemetry showed that the evolution of body com-position was the same whatever the protein source or the protein feeding pattern. According to DEXA, body fat mass loss was 11.9⫾ 1.6, 10.4 ⫾ 2.4, 10.7 ⫾ 1.8, and 12.9 ⫾ 2.2% of initial fat weight, and lean body mass loss was 7.6⫾ 1.0, 6.7⫾ 1.0, 5.6 ⫾ 0.9, and 6.8 ⫾ 1.0% of initial lean body mass weight in the casein pulse, casein spread, MSP pulse, and MSP spread groups, respectively. According to impedancemetry (Fig. 2), body fat mass loss was 14.3⫾ 1.0, 14.1 ⫾ 1.7, 15.9 ⫾ 1.8, and 16.3⫾ 1.7% of initial fat weight, and lean body mass loss was 4.7⫾ 0.6, 3.3 ⫾ 0.5, 3.4 ⫾ 0.8, and 3.7 ⫾ 0.8% of initial lean body mass weight in the casein pulse, casein spread, MSP pulse, and MSP spread groups, respectively. Finally, the evolution of leg and arm composition (estimated by DEXA) was also similar between groups: fat mass loss was 8.4⫾ 1.7, 5.5⫾ 2.5, 8.4 ⫾ 2.7, and 4.8 ⫾ 2.1% of initial fat weight, and lean mass loss was 5.7⫾ 2.0, 1.7 ⫾ 2.2, 4.6 ⫾ 2.0, and 2.7 ⫾ 1.5% of initial lean mass weight in the casein pulse, casein spread, MSP pulse, and MSP spread groups, respectively. Thus, it is likely that skeletal muscle loss was not significantly different between groups.
Urinary Based Measurements
Some volunteers reported that their urine collection was not totally complete over the 5 days, and these samples were excluded from the nitrogen balance calculations. Means ob-tained using remaining values (Fig. 3) showed that there was no difference in nitrogen balance between groups: protein source and feeding pattern did not influence protein balance (Fig. 3).
Since our volunteers did not eat 3-methylhistidine-contain-ing food (meat, fish) dur3-methylhistidine-contain-ing the 6 wk of energy restriction, 3-methylhistidine excretion could be used as a valid index of muscle proteolysis. Values were adjusted to creatinine excre-tion, an index of muscle mass (thus, it was not a problem if urine collection was not exhaustive for this measurement). This index represents the mean muscle proteolysis of 5 days, since urine was collected and pooled for 5 days. However, as for nitrogen balance, there was no difference between groups (Fig. 3).
Plasma Measurements
Plasma concentrations for glucose, insulin, cholesterol, trig-lycerides, and urea measured in the postabsorptive state during
85 88 91 94 97 100 103 0 1 2 3 4 5 6 Time (weeks)
%initial body weight
Caseins pulse Caseins spread MSP pulse MSP spread
Fig. 1. Evolution of body weight in energy-restricted groups. Obese subjects were proposed a 6-wk restricted energy diet. Four groups were compared: casein pulse, casein spread, milk-soluble protein (MSP) pulse, MSP spread
(n⫽ 10 or 11 per group). In casein groups, caseins were the main protein
source; it was MSP in MSP groups. In pulse groups, proteins were distributed in the 4 meals of the day (breakfast, lunch, tea, dinner) in the proportion 8:80:4:8%, respectively; in spread groups it was 25:25:25:25%. Weight was
followed weekly. Values are means⫾ SE. There was no significant difference
between groups, but all groups lost weight significantly.
86 88 90 92 94 96 98 100 102 0 1 2 3 4 5 6 7 Time (weeks) % initial weight Caseins pulse Caseins spread MSP pulse MSP spread
Lean body mass
Fat mass
Fig. 2. Evolution of body composition in energy-restricted groups. Body composition was measured by impedancemetry at weeks 0, 1, 3, and 6. Values
are means⫾ SE. Lean body mass and fat mass decreased significantly during
energy restriction, but there was no difference between groups.
Nitrogen balance g N / day Caseins pulse Caseins spread MSP pulse MSP spread -3 -2 -1 0 1 2 3 n=9 n=8 n=5 n=7
Urinary based measurements
0 5 10 15 20 25 30 µmoles / mmoles 3MH / creat (n=10 or 11 / group)
Fig. 3. Nitrogen balance and 3-methylhistidine (3-MH) excretion in energy-restricted groups. Urine was collected for 5 consecutive days on the 2nd week of energy restriction and pooled, and nitrogen, 3-MH, and creatinine urinary content was measured. Some volunteers reported that urine collection was not totally complete; those values were excluded for nitrogen balance calculations, but we could still use them for calculation of 3-MH/creatinine ratio. Values are
means⫾ SE. There was no significant difference between groups.
by 10.220.33.6 on December 6, 2016
http://ajpendo.physiology.org/
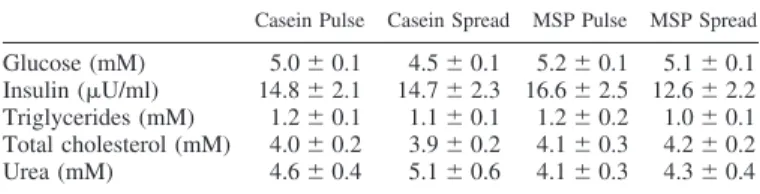
the 6th week of energy restriction were not different between groups (Table 1).
Protein Metabolism
During the last week of energy restriction, protein metabo-lism was also evaluated by infusing labeled leucine first in the postabsorptive state (after an overnight fast) and then in the postprandial state (during a steady state created by successive small liquid meals). In all groups, feeding significantly in-creased (P ⬍ 0.01) leucine flux, LeuOx, NOLD (an index of
whole body protein synthesis rate), and leucine balance (an
index of the balance between whole body protein synthesis and degradation) and significantly (P⬍ 0.01) reduced endogenous or corrected endogenous leucine Ra, an index of whole body
protein degradation (Table 2). The protein feeding pattern (spread/pulse) had no effect on leucine kinetics (Table 2). On the contrary, caseins and MSP had significantly (P ⬍ 0.01) different effects for all parameters (Table 2) except splanchnic extraction (P ⫽ 0.09). As demonstrated by variance analysis, leucine kinetics were not different between caseins and MSP in the postabsorptive state. Significant differences were detected only in the postprandial state: leucine flux, LeuOx, and
NOLD increased more in the postprandial state in the MSP groups than in the casein groups. On the contrary, endoge-nous or corrected endogeendoge-nous leucine Radecreased more in
the postprandial state in the casein groups than in the MSP groups. As a result, in the postprandial state, despite the lower stimulation of protein synthesis, leucine balance was significantly (P⬍ 0.01) higher in the casein groups than in the MSP group (Fig. 4).
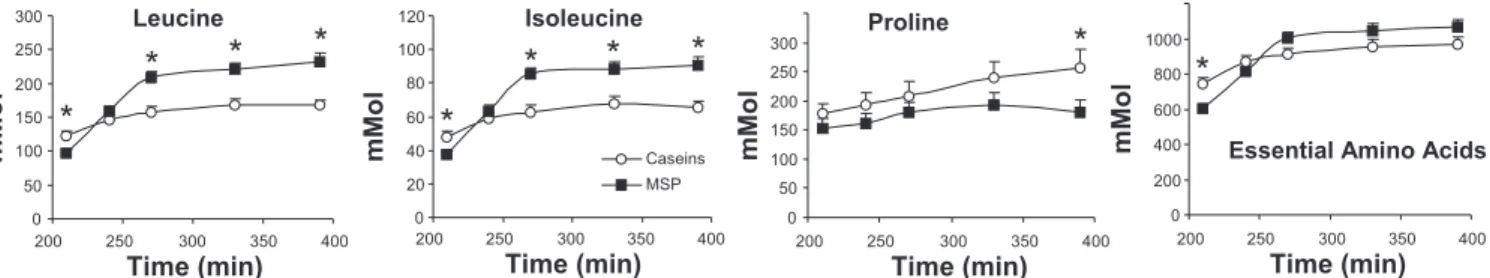
On the same day of leucine kinetics measurements, we followed the evolution of free amino acid plasma concentra-tions. These concentrations were measured at 210 min, at the end of the postabsorptive period, and then at time 240, 270, 330, and 390 min. For all amino acids, plasma concentration increased with time in response to feeding. In the postabsorp-tive state, only protein source had a significant effect, and values were higher in the casein groups than in the MSP groups (histidine, isoleucine, leucine, lysine, methionine, tyrosine, valine) except for aspartic acid, for which it was the reverse (see Fig. 5, in which spread and pulse values were pooled per Table 1. Metabolite and insulin plasma values measured in
the postabsorptive state at the end of the energy restriction period
Casein Pulse Casein Spread MSP Pulse MSP Spread
Glucose (mM) 5.0⫾ 0.1 4.5⫾ 0.1 5.2⫾ 0.1 5.1⫾ 0.1
Insulin (U/ml) 14.8⫾ 2.1 14.7⫾ 2.3 16.6 ⫾ 2.5 12.6 ⫾ 2.2
Triglycerides (mM) 1.2⫾ 0.1 1.1⫾ 0.1 1.2⫾ 0.2 1.0⫾ 0.1
Total cholesterol (mM) 4.0⫾ 0.2 3.9⫾ 0.2 4.1⫾ 0.3 4.2⫾ 0.2
Urea (mM) 4.6⫾ 0.4 5.1⫾ 0.6 4.1⫾ 0.3 4.3⫾ 0.4
Means⫾ SE are given. Obese subjects were proposed a 6-wk
restricted-energy diet. Four groups were compared: casein pulse, casein spread,
milk-soluble protein (MSP) pulse, MSP spread (n⫽ 10 or 11 per group). In casein
groups, caseins were the main protein source; it was MSP in MSP groups. In pulse groups, proteins were distributed in the 4 meals of the day (breakfast, lunch, tea, dinner) in proportion 8:80:4:8%, respectively; in the spread groups it was 25:25:25:25%. During the 6th week of energy restriction, blood samples were obtained in the postabsorptive state, and glucose, insulin, trigycerides, total cholesterol, and urea plasma concentrations were measured. There were no significant differences between groups.
Table 2. Leucine kinetics
Caseins MSP PA PP PA PP VASE Leu Ra Pulse 1.87⫾ 0.06 2.41⫾ 0.09 1.79⫾ 0.04 3.00⫾ 0.10 N, N⫻P Spread 1.86⫾ 0.03 2.52⫾ 0.04 1.77⫾ 0.08 3.07⫾ 0.09 LeuOx Pulse 0.25⫾ 0.03 0.65⫾ 0.04 0.25⫾ 0.02 1.09⫾ 0.08 N, N⫻P Spread 0.31⫾ 0.03 0.78⫾ 0.06 0.27⫾ 0.02 1.08⫾ 0.06 NOLD Pulse 1.62⫾ 0.06 1.76⫾ 0.09 1.54⫾ 0.05 1.91⫾ 0.11 N, N⫻P Spread 1.55⫾ 0.04 1.73⫾ 0.04 1.50⫾ 0.08 1.99⫾ 0.10 Endo Leu Ra Pulse 1.74⫾ 0.06 0.04⫾ 0.10 1.67⫾ 0.04 0.54⫾ 0.09 N, N⫻P Spread 1.73⫾ 0.03 0.17⫾ 0.06 1.65⫾ 0.07 0.62⫾ 0.10 Splanchnic Extr Pulse 45⫾ 2 38⫾ 5 Spread 44⫾ 3 38⫾ 5
Cor Endo Leu Ra
Pulse 1.05⫾ 0.09 1.42⫾ 0.10 P
Spread 1.15⫾ 0.06 1.52⫾ 0.07
Leu Bal
Pulse ⫺0.11 ⫾ 0.03 1.72⫾ 0.06 ⫺0.12 ⫾ 0.02 1.38⫾ 0.07 N, N⫻P
Spread ⫺0.18 ⫾ 0.03 1.56⫾ 0.07 ⫺0.15 ⫾ 0.03 1.38⫾ 0.06
Values are means⫾ SE. During the 6th week of energy restriction, whole-body protein metabolism was measured using infusion ofL-[1-13C]leucine first in
the postabsorptive (PA) state and then in a steady postprandial (PP) state. Subjects were given a liquid meal containing lipids, carbohydrates, proteins and
L-[5,5,5-2H
3]leucine every 20 min. We could calculate leucine rate of appearance (Leu Ra), leucine oxidation (LeuOx), nonoxidative leucine disappearance
(NOLD), an index of protein synthesis, endogenous leucine Ra(Endo Leu Ra), an index of protein degradation, splanchnic extraction (Splanchnic Extr), an index
of the amount of leucine kept in the splanchnic area, corrected endogenous leucine Ra(Cor Endo Leu Ra; Endo Leu Racorrected for splanchnic extraction), and
leucine balance (Leu Bal), the balance between protein synthesis and protein degradation. All these rates were expressed inmol/(min䡠kg lean body mass),
except for splanchnic extraction, expressed in %. Repeated-measures variance analyses were performed, and variance analysis significant effects (VASE) are given: N, nutrition; P, protein source. Protein feeding pattern (pulse/spread) never had a significant effect.
E977
MILK PROTEINS AND ENERGY RESTRICTION
AJP-Endocrinol Metab•doi:10.1152/ajpendo.00285.2012•www.ajpendo.org
by 10.220.33.6 on December 6, 2016
http://ajpendo.physiology.org/
protein source). There was no significant difference for the other amino acids. In response to feeding, in most cases, plasma amino acid concentrations increased more quickly (significant interaction time⫻ protein source) after MSP feed-ing than after casein feedfeed-ing (methionine, phenylalanine, ty-rosine), and in addition, final values were also higher (aspartic acid, isoleucine, leucine, lysine, threonine, tryptophane, valine) (Fig. 5). It was only for proline that plasma concentrations were always higher in the casein groups than in the MSP groups (Fig. 5). Protein feeding pattern had significant effects for some amino acids (spread ⬎ pulse: glutamine, proline, threonine; pulse⬎ spread: glycine, serine). However, since all volunteers had liquid meals every 20 min on that day, only residual effects of protein feeding pattern could be detected.
Adipose Tissue
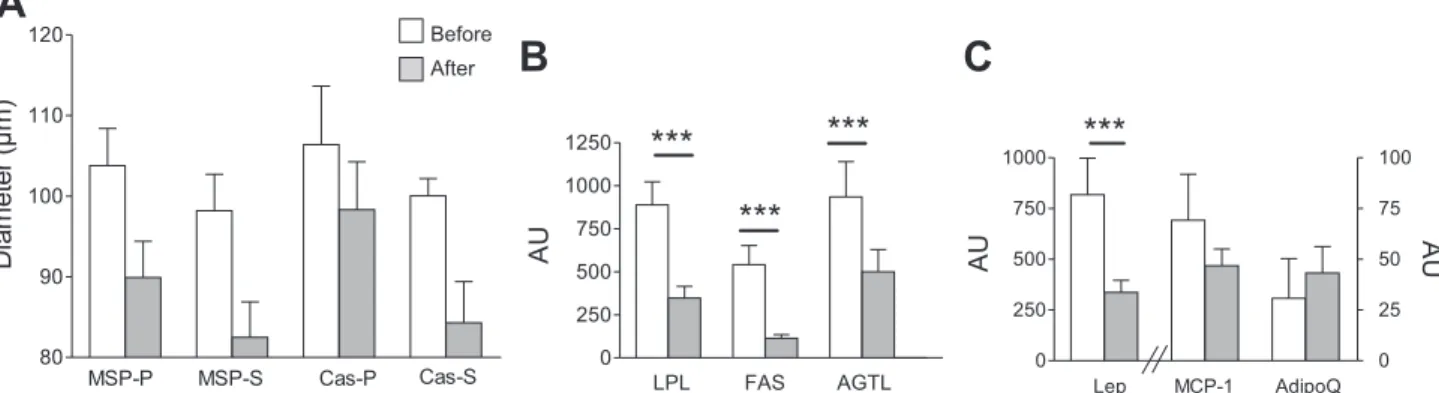
Energy restriction reduced adipocyte size (P ⱕ 0.001), but neither protein source nor feeding pattern modified this reduc-tion (Fig. 6A). This lack of specific effect of protein source and feeding pattern was also observed for adipose tissue gene expression (data not shown). Energy restriction provoked a substantial decrease in mRNA amount of genes involved in both lipogenic (LPL and FAS) and lipolytic pathways (ATGL) (Fig. 6B). This downregulation of gene expression in adipose tissue after a restricted diet was also observed for leptin (Fig.
6C), in agreement with the decrease in fat mass. By contrast, there was no significant reduction of mRNA expression of monocyte chemotactic protein-1 (MCP-1) and adiponectin (AdipoQ) (Fig. 6C).
Perception of Hunger
Perception of hunger was tested on days 0, 15, and 35, before and after breakfast, lunch, and dinner, in each group. As could have been expected, perception of hunger was much higher before than after a meal (score: 2.4 before vs. 0.6 after,
P ⬍ 0.0001) and varied also significantly according to meals
(subjects were less hungry at breakfast than at lunch and dinner). Surprisingly, these perceptions did not change during energy restriction: perception of hunger was not different on
days 0, 15, and 35. Finally, protein source and protein feeding
pattern had no influence on hunger perception.
DISCUSSION
The aim of this work was to determine whether milk protein supplements could prevent energy restriction-induced lean body mass loss depending on the protein fraction (caseins, soluble proteins, i.e., whey) and their pattern of intake (pulse, spread). We showed that, although caseins induced a better whole body protein anabolism than MSP, there was no differ-ence in the evolution of lean body mass during energy restric-tion between casein-fed and MSP-fed participants.
The main characteristics of caseins and MSP liable to promote a different response of protein metabolism after in-gestion are leucine content and speed of diin-gestion. Indeed, leucine is now recognized as a potent signal nutrient that regulates protein metabolism (7), and MSP contain 12.1 g leucine/100 g proteins, whereas caseins contain only 8.7 g leucine/100 g proteins. In addition, it was shown that, after a bolus of MSP, digested amino acids appear quickly in the peripheral blood, with an intense peak, whereas after a bolus of caseins, amino acid appearance is delayed and stays above postabsorptive values for a longer period of time (9).
We compared the effect of caseins and MSP on whole body protein metabolism using steady-state conditions, i.e., post-prandial state was created by repeated small liquid meals every 20 min for 4.5 h. Thus, the differences in absorption rates were attenuated. However, these measurements were performed af-ter more than 5 wk of feeding exclusively with caseins or MSP, and this habituation was liable to have an influence on protein
Isoleucine 0 20 40 60 80 100 120 mMol Caseins MSP Leucine 0 50 100 150 200 250 300 mMol Proline 0 50 100 150 200 250 300 200 250 300 350 400 Time (min)
mMol Essential Amino Acids
0 200 400 600 800 1000 200 250 300 350 400 200 250 300 350 400 200 250 300 350 400 Time (min)
Time (min) Time (min)
mMol
*
*
*
*
*
*
*
*
*
*
Fig. 5. Differential concentrations of plasma amino acids after milk protein steady ingestion in energy-restricted subjects. During the 6th wk of energy restriction,
whole body protein metabolism was measured using infusion ofL-[1-13C]leucine first in the PA state and then in a steady PP state. Subjects were given a liquid
meal containing lipids, carbohydrates,L-[5,5,5-2H
3]leucine and caseins or MSP every 20 min. Plasma amino acid concentrations were measured at t⫽ 210 min
(last point in PA state) and at t⫽ 240, 270, 330, and 390 min. Leucine, isoleucine, proline, and essential amino acids (His ⫹ Met ⫹ Ile ⫹ Leu ⫹ Phe ⫹ Val ⫹
Lys⫹ Thr) are reported here. Since protein feeding pattern had no effects, means ⫾ SE per protein (caseins/MSP) were calculated. These concentrations
increased with feeding. *For this time point, there was a significant difference between caseins and MSP. Detailed results are given in Table 1.
-0.5 0 0.5 1 1.5 2 P P A P
µmol Leu / kg LBM. min
Caseins MSP
*
$
Fig. 4. Caseins improve leucine balance in the postprandial state after 6 wk of energy restriction. During the 6th wk, whole body protein metabolism was measured. Leucine balance, an index of the balance between whole body protein synthesis and degradation, was calculated. Since protein feeding
pattern had no effects, means⫾ SE per protein (caseins/MSP) were calculated
in postabsorptive (PA) and postprandial (PP) states. $Values in PA are significantly different from values in PP. *In PP, value in casein group is significantly different from value in MSP group.
by 10.220.33.6 on December 6, 2016
http://ajpendo.physiology.org/
metabolism. In these conditions, we showed that, in the post-prandial state, amino acid oxidation and whole body protein synthesis were higher after MSP ingestion than after casein ingestion, and whole body protein degradation was inhibited to a higher degree with caseins than with MSP, leading to a better leucine balance with caseins than with MSP. Thus, despite our steady-state conditions, we obtained significantly different re-sults between caseins and MSP.
To our knowledge, there have been no similar studies performed in humans during energy restriction after a long period of casein or MSP feeding. However, in rats, using a similar protocol, we observed that there was no difference in postprandial in vivo muscle and liver protein synthesis rates after casein or MSP feeding (1, 2). In addition, in the postab-sorptive state, muscle protein synthesis was higher in casein-fed rats than in MSP-casein-fed rats (1). Thus, there is no clear correspondence between results obtained at the tissue level in rats with results obtained at the whole body level in humans. We may wonder whether adipose tissue could be involved in the protein metabolism response observed in humans, since our volunteers had significant stores of adipose tissue and since it was shown in rats that leucine is a very efficient stimulator of protein synthesis in adipose tissue (30, 31). However, the protein content of adipose tissue is so low [ⱖ10 times lower than in other tissues (personal communication, I. Papet, 1987)], that it seems unlikely. The best hypothesis remains that, despite the results observed in the rats, muscle is probably the tissue mainly responsible for the better postprandial stimulation of whole body protein synthesis with MSP than with caseins.
Several studies were performed to analyze the effect of a test meal (ingested as a bolus of intrinsically labeled protein in most cases) containing either caseins or MSP in healthy adult and old humans and rats (9, 13–15, 24, 34, 36). Those authors concluded that MSP stimulated more muscle protein synthesis than caseins in aged subjects and that, at the whole body level, the protein that allowed the best postprandial protein balance was different according to the age of the subject: it was caseins in young subjects, and MSP in old subjects. Leucine content seemed an important factor in aged subjects (36). In young subjects, the casein-positive effect was clearer when energy content of the test meal was low: in the experiment where the
test meal energy content was the highest, leucine balance was better with MSP than with caseins (15).
The context and the methods used in our experiments are very different from those in these publications. However, obesity and aging share common metabolic abnormalities: inflammation, oxidative stress, and insulin resistance. It is possible that during the first days of energy restriction MSP induced a better leucine balance than caseins, as observed in aged subjects, but as energy restriction began to correct met-abolic abnormalities, caseins became progressively the best proteins as in young healthy subjects. This would explain why there was no significant effect of protein source on lean body mass despite a better leucine balance with caseins than with MSP during the 6th week.
One can wonder whether the total amount of proteins con-sumed by our volunteers was sufficient to limit lean body mass loss. Although the optimum protein intake for weight loss remains unknown, investigators using very-low-calorie diets found that increasing dietary protein to levels of 1.5 g pro-tein/kg of ideal body weight reduced loss of lean tissue during rapid weight loss (26). In the present study, protein intake was 1.43 g protein/kg of ideal body weight, thus very close to the proposed value.
We may also wonder whether the amount of protein con-sumed per meal was sufficient to promote anabolism, in par-ticular in the spread group. Indeed, volunteers in the spread group consumed ⬃87/4 ⫽ 22 g of protein per meal. In test meal studies in young adults, quantities used varied from similar amounts (23 g) (24) to higher amounts (30 g) (9). In any case, since there was no difference in the end between the spread and the pulse groups, we can assume that the amount of protein per meal was not limiting in the spread group.
In our rat model, energy restriction did not induce a loss of lean body mass and only stopped the slow growth of animals (1, 2). In the present study, there was a significant loss of lean body mass, but the extent of this loss was different depending on the method used (impedancemetry vs. DEXA). In compi-lation or meta-analyses of studies on energy restriction, it was reported that without exercise the loss of lean body mass averaged 23% (40), or 20% (23) of the observed total mass loss. This percentage was higher in short-term studies (23, 40).
80 90 100 110 120 MSP-P MSP-S Cas-P Cas-S D iam et er (µ m ) 0 250 500 750 1000 0 25 50 75 100
***
Lep MCP-1 AdipoQ AU AU 0 250 500 750 1000 1250***
***
***
LPL FAS AGTL AUA
C
B
Before AfterFig. 6. Evolution of adipocyte diameter and gene-related adipocyte function after energy restriction. Adipocyte diameter measurement and mRNA levels of
specific genes were performed in adipose tissue biopsies carried out before and after energy restriction. A: adipocyte diameter. Data are expressed as means⫾
SE (n⫽ 5–7 per group). MSP-P, MSP pulse; MSP-S, MSP spread; Cas-P, casein pulse; Cas-S, casein spread. B: mRNA amount of lipid storage-related enzymes.
Data are expressed as means⫾ SE (n ⫽ 18–20 per enzyme). LPL, lipoprotéine lipase; FAS, fatty acid synthase; ATGL, adipose triglyceride lipase. ***P ⱕ
0.001 vs. before restriction. C: mRNA amount of adipocyte secretion and inflammation markers. Data are expressed as means⫾ SE (n ⫽ 18–20 per marker).
Lep, leptin; MCP-1, monocyte chemoattractant protein-1; AdipoQ, adiponectin. ***Pⱕ 0.001 vs. before restriction.
E979
MILK PROTEINS AND ENERGY RESTRICTION
AJP-Endocrinol Metab•doi:10.1152/ajpendo.00285.2012•www.ajpendo.org
by 10.220.33.6 on December 6, 2016
http://ajpendo.physiology.org/
In our 6-wk study, lean body mass losses estimated by imped-ancemetry were 30% of total mass loss and 52% by DEXA. Thus, impedancemetry results seem more in line with other observed results than DEXA values. These DEXA values could be overestimated because of variations in extracellular water. Indeed, the ratio of extracellular water to total body water is increased during obesity (39). Impedancemetry mea-surements showed that extracellular water significantly de-creased during energy restriction; DEXA measurements did not take this phenomenon into account. Thus, although DEXA is often presented as the reference method, in our hands impedancemetry seemed to give a more realistic estimation of body composition change during energy restriction than DEXA.
Another interesting aspect of the effect of restriction diets shown in the present study is its ability to reduce adiposity regardless of the protein composition. The consequences on adipose tissue biology of such diets differing by their protein composition are not well known. In addition to a small loss of fat mass (10%), we identified an important reduction of adi-pocyte weight (30 – 40%), in agreement with the relevance of adipocyte size as an important cellular obesity phenotype (38). Unfortunately, we could not find any difference for this pa-rameter between the spread and pulse groups whatever the protein source. A striking finding was a concerted downregu-lation by energy restriction of mRNA levels of genes involved in triglyceride synthesis and degradation, suggesting a global decreasing effect on triglyceride turnover. However, in accor-dance with the reduction in fat cell size, one could expect that the decreased lipogenesis rate was the main contributor to diminished cellular triglycerides, because the lipolytic capacity was also downregulated. There is accumulating evidence that obesity is associated with low-grade inflammation (41), which is reduced by weight loss (12). Therefore, we analyzed the expression of an inflammation marker, MCP-1, together with that of adipose-secreted factors. The decrease in leptin expres-sion was not surprising, due to the well-known positive rela-tionship between leptin expression and adipose mass. Con-versely, the lack of effect on adiponectin expression was at variance with previous studies (42) but in agreement with recent studies showing that adiponectin was not a reliable adipose-secreted protein marker for weight loss (20, 22). Weight loss is usually associated with a decreased concentra-tion of inflammatory markers, which can be mediated by decreased secretion of proinflammatory cytokines by adipose tissue (12, 16). Among these, MCP-1, which may play a role in the attraction of macrophages in adipose tissue, was decreased after weight loss (12). In this study, the expression of MCP-1 was unchanged after the restriction diet, suggesting that the fat mass loss was insufficient to affect the macrophage infiltration in adipose tissue. Thus, the changes in adipose tissue gene expression could be related to the changes in adipocyte size and were only dependent upon the energy restriction.
Few factors were significantly affected by protein source or protein feeding pattern. Besides leucine flux, only plasma amino acid values were significantly affected by protein source, and marginally by previous protein feeding pattern (on the day of the measurement, steady-state conditions were used). The observed variations are related to the relative enrichment in specific amino acids in caseins and MSP (e.g., leucine: MSP⬎ caseins; proline: caseins ⬎ MSP) and to the
differences in the speed of digestion. It is interesting to note that postabsorptive values were significantly lower in the MSP group than in the casein group for several amino acids for which it was the reverse in the postprandial state, as though the higher the postprandial value is, the lower the postabsorptive value is. A similar phenomenon was observed previously in the rat for leucine (1).
Very few effects of the protein feeding pattern were ob-served. Previously, it was shown that the pulse protein feeding pattern promoted a better nitrogen balance than the spread feeding pattern in older individuals, whereas there was no difference in young individuals (3– 6). In the present study, no differences were observed for body composition and nitrogen balance. There was also no difference for whole body protein metabolism, but the use of steady-state conditions probably attenuated differences in the postprandial state.
Although it may be very difficult for the subjects to combine energy restriction with a sufficient level of exercise, it seems that exercise remains the most powerful tool to maintain lean body mass during energy restriction. Indeed, it was only in studies with intense exercise training that there was no loss of lean body mass during energy restriction (40). We may wonder whether a stimulus like exercise might have amplified any benefit of dietary protein source (including higher leucine content) or protein feeding pattern. To our knowledge, few studies have tried to answer these questions. It was shown that the effects of dietary protein and exercise on body composition during weight loss were additive (27). Other studies would be necessary to have a better understanding of these phenomena. In conclusion, this study shows that, in young, healthy, obese subjects, a significant loss of lean body mass occurs during energy restriction and that this loss is the same whatever the milk protein consumed (caseins or MSP) and whatever the protein feeding pattern used (pulse or spread) after 6 wk. However, a clear, positive effect of caseins on leucine balance was observed during the last week of energy restriction. It is possible that the energy restriction period was not long enough to obtain a significant positive effect of caseins on the sparing of lean body mass.
ACKNOWLEDGMENTS
We thank all the people of the Human Nutrition Research Centre who participated and helped in the realization of this protocol (cook, nurses, medical doctors, dieticians, clinical research attaché).
GRANTS
This project was funded by a grant from Agence Nationale de la Recherche and Centre National Interprofessionnel de l’Economie Laitière.
DISCLOSURES
No conflicts of interest, financial or otherwise, are declared by the author(s). AUTHOR CONTRIBUTIONS
Author contributions: S.A., Y.B., C.G., D.D., and L.M. conception and design of research; S.A., M.B., A.Q.-B., and L.M. performed experiments; S.A., M.B., D.R., C.M., A.Q.-B., A.M.-B., S.R., and L.M. analyzed data; S.A., D.R., C.M., A.Q.-B., S.R., and L.M. interpreted results of experiments; S.A., A.Q.-B., and L.M. prepared figures; S.A., C.G., D.D., and L.M. drafted manuscript; S.A., M.B., D.R., A.Q.-B., S.R., Y.B., C.G., D.D., and L.M. edited and revised manuscript; S.A., D.R., A.Q.-B., A.M.-B., S.R., Y.B., C.G., D.D., and L.M. approved final version of manuscript.
by 10.220.33.6 on December 6, 2016
http://ajpendo.physiology.org/
REFERENCES
1. Adechian S, Remond D, Gaudichon C, Dardevet D, Mosoni L. The nature of the ingested protein has no effect on lean body mass during energy restriction in overweight rats. Obesity (Silver Spring) 19: 1137– 1144, 2011.
2. Adechian S, Remond D, Gaudichon C, Pouyet C, Dardevet D, Mosoni L. Spreading intake of a leucine-rich fast protein in energy-restricted overweight rats does not improve protein mass. Nutrition 28: 566 –571, 2011.
3. Arnal MA, Mosoni L, Boirie Y, Gachon P, Genest M, Bayle G, Grizard J, Arnal M, Antoine JM, Beaufrère B, Patureau Mirand P. Protein turnover modifications induced by the protein feeding pattern still persist after the end of the diets. Am J Physiol Endocrinol Metab 278: E902–E909, 2000.
4. Arnal MA, Mosoni L, Boirie Y, Houlier ML, Morin L, Verdier E, Ritz P, Antoine JM, Prugnaud J, Beaufrere B, Patureau Mirand P. Protein feeding pattern does not affect protein retention in young women. J Nutr 130: 1700 –1704, 2000.
5. Arnal MA, Mosoni L, Boirie Y, Houlier ML, Morin L, Verdier E, Ritz P, Antoine JM, Prugnaud J, Beaufrere B, Patureau Mirand P. Protein pulse feeding improves protein retention in elderly women. Am J Clin Nutr 69: 1202–1208, 1999.
6. Arnal MA, Mosoni L, Dardevet D, Ribeyre MC, Bayle G, Prugnaud J, Patureau Mirand P. Pulse protein feeding pattern restores stimulation of muscle protein synthesis during the feeding period in old rats. J Nutr 132: 1002–1008, 2002.
7. Balage M, Dardevet D. Long-term effects of leucine supplementation on body composition. Curr Opin Clin Nutr Metab Care 13: 265–270, 2010. 8. Biolo G, Tessari P, Inchiostro S, Bruttomesso D, Fongher C, Sabadin L, Fratton MG, Valerio A, Tiengo A. Leucine and phenylalanine kinetics during mixed meal ingestion: a multiple tracer approach. Am J
Physiol Endocrinol Metab 262: E455–E463, 1992.
9. Boirie Y, Dangin M, Gachon P, Vasson MP, Maubois JL, Beaufrere B. Slow and fast dietary proteins differently modulate postprandial protein accretion. Proc Natl Acad Sci USA 94: 14930 –14935, 1997.
10. Boisseau N, Vermorel M, Rance M, Duche P, Patureau Mirand P. Protein requirements in male adolescent soccer players. Eur J Appl
Physiol 100: 27–33, 2007.
11. Chaston TB, Dixon JB, O’Brien PE. Changes in fat-free mass during significant weight loss: a systematic review. Int J Obes (Lond) 31: 743–750, 2007.
12. Clement K, Viguerie N, Poitou C, Carette C, Pelloux V, Curat CA, Sicard A, Rome S, Benis A, Zucker JD, Vidal H, Laville M, Barsh GS, Basdevant A, Stich V, Cancello R, Langin D. Weight loss regulates inflammation-related genes in white adipose tissue of obese subjects.
FASEB J 18: 1657–1669, 2004.
13. Dangin M, Boirie Y, Garcia-Rodenas C, Gachon P, Fauquant J, Callier P, Ballevre O, Beaufrere B. The digestion rate of protein is an independent regulating factor of postprandial protein retention. Am J
Physiol Endocrinol Metab 280: E340 –E348, 2001.
14. Dangin M, Boirie Y, Guillet C, Beaufrere B. Influence of the protein digestion rate on protein turnover in young and elderly subjects. J Nutr 132: 3228S–3233S, 2002.
15. Dangin M, Guillet C, Garcia-Rodenas C, Gachon P, Bouteloup-Demange C, Reiffers-Magnani K, Fauquant J, Ballevre O, Beaufrere B. The rate of protein digestion affects protein gain differently during aging in humans. J Physiol 549: 635–644, 2003.
16. Esposito K, Pontillo A, Di Palo C, Giugliano G, Masella M, Marfella R, Giugliano D. Effect of weight loss and lifestyle changes on vascular inflammatory markers in obese women: a randomized trial. JAMA 289: 1799 –1804, 2003.
17. Fernandez-Sanchez A, Madrigal-Santillan E, Bautista M, Esquivel-Soto J, Morales-Gonzalez A, Esquivel-Chirino C, Durante-Montiel I, Sanchez-Rivera G, Valadez-Vega C, Morales-Gonzalez JA. Inflamma-tion, oxidative stress, obesity. Int J Mol Sci 12: 3117–3132, 2011. 18. Finucane MM, Stevens GA, Cowan MJ, Danaei G, Lin JK, Paciorek
CJ, Singh GM, Gutierrez HR, Lu Y, Bahalim AN, Farzadfar F, Riley LM, Ezzati M. National, regional, and global trends in body-mass index since 1980: systematic analysis of health examination surveys and epide-miological studies with 960 country-years and 9.1 million participants.
Lancet 377: 557–567, 2011.
19. Harris JA, Benedict FG. A biometric study of human basal metabolism.
Proc Natl Acad Sci USA 4: 370 –373, 1918.
20. Higami Y, Barger JL, Page GP, Allison DB, Smith SR, Prolla TA, Weindruch R. Energy restriction lowers the expression of genes linked to inflammation, the cytoskeleton, the extracellular matrix, and angiogenesis in mouse adipose tissue. J Nutr 136: 343–352, 2006.
21. Hoerr RA, Yu YM, Wagner DA, Burke JF, Young VR. Recovery of
13C in breath from NaH13CO
3infused by gut and vein: effect of feeding.
Am J Physiol Endocrinol Metab 257: E426 –E438, 1989.
22. Klempel MC, Varady KA. Reliability of leptin, but not adiponectin, as a biomarker for diet-induced weight loss in humans. Nutr Rev 69: 145–154, 2011.
23. Krieger JW, Sitren HS, Daniels MJ, Langkamp-Henken B. Effects of variation in protein and carbohydrate intake on body mass and composi-tion during energy restriccomposi-tion: a meta-regression 1. Am J Clin Nutr 83: 260 –274, 2006.
24. Lacroix M, Bos C, Leonil J, Airinei G, Luengo C, Dare S, Benamouzig R, Fouillet H, Fauquant J, Tome D, Gaudichon C. Compared with casein or total milk protein, digestion of milk soluble proteins is too rapid to sustain the anabolic postprandial amino acid requirement. Am J Clin
Nutr 84: 1070 –1079, 2006.
25. Lavau M, Susini C, Knittle J, Blanchet-Hirst S, Greenwood MR. A reliable photomicrographic method to determining fat cell size and num-ber: application to dietary obesity. Proc Soc Exp Biol Med 156: 251–256, 1977.
26. Layman DK. Protein quantity and quality at levels above the RDA improves adult weight loss. J Am Coll Nutr 23: 631S–636S, 2004. 27. Layman DK, Evans E, Baum JI, Seyler J, Erickson DJ, Boileau RA.
Dietary protein and exercise have additive effects on body composition during weight loss in adult women. J Nutr 135: 1903–1910, 2005. 28. Layman DK, Walker DA. Potential importance of leucine in treatment of
obesity and the metabolic syndrome. J Nutr 136: 319S–323S, 2006. 29. Le Lay S, Lefrere I, Trautwein C, Dugail I, Krief S. Insulin and
sterol-regulatory element-binding protein-1c (SREBP-1C) regulation of gene expression in 3T3-L1 adipocytes. Identification of CCAAT/enhancer-binding protein beta as an SREBP-1C target. J Biol Chem 277: 35625–35634, 2002.
30. Lynch CJ, Hutson SM, Patson BJ, Vaval A, Vary TC. Tissue-specific effects of chronic dietary leucine and norleucine supplementation on protein synthesis in rats. Am J Physiol Endocrinol Metab 283: E824 – E835, 2002.
31. Lynch CJ, Patson BJ, Anthony J, Vaval A, Jefferson LS, Vary TC. Leucine is a direct-acting nutrient signal that regulates protein synthesis in adipose tissue. Am J Physiol Endocrinol Metab 283: E503–E513, 2002. 32. Mahon AK, Flynn MG, Stewart LK, McFarlin BK, Iglay HB, Mattes
RD, Lyle RM, Considine RV, Campbell WW. Protein intake during energy restriction: effects on body composition and markers of metabolic and cardiovascular health in postmenopausal women. J Am Coll Nutr 26: 182–189, 2007.
33. Marzani B, Balage M, Venien A, Astruc T, Papet I, Dardevet D, Mosoni L. Antioxidant supplementation restores defective leucine stim-ulation of protein synthesis in skeletal muscle from old rats. J Nutr 138: 2205–2211, 2008.
34. Pennings B, Boirie Y, Senden JM, Gijsen AP, Kuipers H, van Loon LJ. Whey protein stimulates postprandial muscle protein accretion more effectively than do casein and casein hydrolysate in older men. Am J Clin
Nutr 93: 997–1005, 2011.
35. Prat-Larquemin L, Oppert JM, Clement K, Hainault I, Basdevant A, Guy-Grand B, Quignard-Boulange A. Adipose angiotensinogen secre-tion, blood pressure, and AGT M235T polymorphism in obese patients.
Obes Res 12: 556 –561, 2004.
36. Rieu I, Balage M, Sornet C, Debras E, Ripes S, Rochon-Bonhomme C, Pouyet C, Grizard J, Dardevet D. Increased availability of leucine with leucine-rich whey proteins improves postprandial muscle protein synthesis in aging rats. Nutrition 23: 323–331, 2007.
37. Rieu I, Magne H, Savary-Auzeloux I, Averous J, Bos C, Peyron MA, Combaret L, Dardevet D. Reduction of low grade inflammation restores blunting of postprandial muscle anabolism and limits sarcopenia in old rats. J Physiol 587: 5483–5492, 2009.
38. Rizkalla SW, Prifti E, Cotillard A, Pelloux V, Rouault C, Allouche R, Laromiguiere M, Kong L, Darakhshan F, Massiera F, Clement K. Differential effects of macronutrient content in 2 energy-restricted diets on cardiovascular risk factors and adipose tissue cell size in moderately obese individuals: a randomized controlled trial. Am J Clin Nutr 95: 49 –63, 2012.
E981
MILK PROTEINS AND ENERGY RESTRICTION
AJP-Endocrinol Metab•doi:10.1152/ajpendo.00285.2012•www.ajpendo.org
by 10.220.33.6 on December 6, 2016
http://ajpendo.physiology.org/
39. Sartorio A, Malavolti M, Agosti F, Marinone PG, Caiti O, Battistini N, Bedogni G. Body water distribution in severe obesity and its assessment from eight-polar bioelectrical impedance analysis. Eur J Clin Nutr 59: 155–160, 2005. 40. Votruba SB, Horvitz MA, Schoeller DA. The role of exercise in the
treatment of obesity. Nutrition 16: 179 –188, 2000.
41. Wellen KE, Hotamisligil GS. Obesity-induced inflammatory changes in adipose tissue. J Clin Invest 112: 1785–1788, 2003.
42. Yamauchi T, Kamon J, Waki H, Terauchi Y, Kubota N, Hara K, Mori Y, Ide T, Murakami K, Tsuboyama-Kasaoka N, Ezaki O, Akanuma Y, Gavrilova O, Vinson C, Reitman ML, Kagechika H, Shudo K, Yoda M, Nakano Y, Tobe K, Nagai R, Kimura S, Tomita M, Froguel P, Kadowaki T. The fat-derived hormone adiponectin reverses insulin resistance associated with both lipoatrophy and obesity. Nat Med 7: 941–946, 2001.
by 10.220.33.6 on December 6, 2016
http://ajpendo.physiology.org/