Advancements in branched bottlebrush polymers for responsive, targeted imaging
by
Molly A. Sowers B.A., Cornell College (2012)
Submitted to the Department of Chemistry in Partial Fulfillment of the Requirements for the Degree of
Master of Science in Chemistry at the
MASSACHUSETTS INSTITUTE OF TECHNOLOGY
February 2015
C 2014 Massachusetts Institute of Technology. All rights reserved.
The author hereby grants to MIT permission to reproduce and to distribute publicly paper and electronic copies of this thesis document in whole or in part
in any medium now known or hereafter created.
MASSACHUSETTS INSTITUTE OF TECHNOLOLGY
MAY 19 2015
LIBRARIES
E
Signature of Author... Certified by... Accepted by...ignature redacted..
DepartSignature redacted
... -ment of Chemistry October 6, 2014 Jeremiah A. Johnson Assistant Professor of Chemistry Thesis SupervisorSignature redacted
...
Robert Warren Field Robert T. Haslam and Bradley Dewey Professor of Chemistry Director of Graduate Studies ... ---.
Advancements in branched bottlebrush polymers for responsive, targeted imaging
By
Molly A. Sowers
Submitted to the Department of Chemistry On October 6, 2014 in Partial Fulfillment of the
Requirement for the Degree of Master of Science in Chemistry
ABSTRACT
Multi-modality and stimuli responsive nanoparticles are promising platform materials for medical imaging and diagnostics. Specifically magnetic resonance imaging (MRI) and
near-infrared (NIR) fluorescent probes can be used in combination to visualize biodistribution and in
vivo clearance rates. We reasoned that through the use of a nitroxide radical MRI contrast agent
along with a NIR fluorophore it would be possible to study these phenomena along with nitroxide reduction in vivo. Thus, we have developed branched bottlebrush copolymers that display compensatory fluorescence response to nitroxide reduction that enables correlation of MRI contrast, fluorescence intensity, and spin concentration in tissues. These polymers were synthesized by ring-opening metathesis copolymerization of two new branched macromonomers: one carries a bis-spirocyclohexyl nitroxide and the other the NIR dye Cy5.5. Promising
preliminary results with the resulting polymers in solution MRI and NIR imaging studies as well as in vitro toxicity led us to explore the potential of these materials for in vivo applications.
Though nitroxide agents are promising organic agents for MRI applications, clinically, gadolinium-based MRI contrast agents are most common due to their high relaxivity and relatively low toxicity when bound to chelating ligands. We have also explored the idea of incorporation of gadolinium agents into our branched bottlebrush copolymer platform through the design of Gd-based branched macromonomers. While the fluorescence redox effects described in the nitroxide system above would not be applicable, chelated Gd could be used in much smaller concentration to provide similar MRI contrast. In this way, a small percentage of
Gd could be added as an MRI tag to any polymer synthesized by ROMP.
A natural extension of the work described above is the incorporation of cellular targeting
moieties for tissue-selective imaging. Toward this end, we propose the incorporation of known cellular targeting ligands onto the surface of branched bottlebrush polymers through the synthesis of end-functionalized branched macromonomers. The synthesis of several targeting ligands is described, alongside synthesis and characterization of positively charged nanoparticles for improved cellular uptake and ionic coordination of hyaluronic acid or other negatively charged polymers.
Thesis supervisor: Jeremiah A. Johnson Title: Assistant Professor of Chemistry
TABLE OF CONTENTS
Chapter 1. ORCAFluors: Redox responsive dual-modal MRI and Near IR imaging polymers
Introdu ction ... 4 - 6
Results and Discussion...7 - 13
C on clu sion s...14
Experimental Methods... 14 - 30
Spectral D ata... 30 - 31 Chapter II. Gadolinium-based MRI polymers
Introduction ... 32 - 33
R esults and D iscussion...33 - 34 C onclusions... 34 - 35
Experimental Methods...35 - 37
Spectral D ata... 37 - 38 Chapter III. Surface functionalization for targeting and cellular internalization
Introduction ... 38 -40
Results and Discussion...40 -43
C onclusions... . .. 43
Experimental Methods...44 - 52
Spectral D ata... 53 - 60 Chapter IV. References
Chapter I. ORCAFluors: Responsive dual-modal MR1 and near-IR imaging polymers
Introduction. Nanoparticle (NP)-based imaging agents have recently become pervasive
in medical diagnostics research.13 Of the common modalities, magnetic resonance imaging
(MRI) and optical imaging are particularly common in clinical and research laboratories: MRI is used to image millions of patients per year,4 while near-infrared (NIR) optical imaging is emerging as a powerful tool for image-guided surgery,5 and is used routinely to monitor disease
progression and nanoparticle biodistribution in animal models.6'7
Several examples of nanoparticle8-13
and small molecule'14 17 MRI/NIR imaging
systems have been previously reported. In some cases, stimuli-responsive constructs are reported to provide enhanced contrast or emission when exposed to specific cellular
signals.3'1 ',1 9 While these systems are often highly effective in vitro and ex vivo, short
wavelength emitting fluorophores limit in
vivo practicality.20 Furthermore, these
systems invariably rely on heavy metals to
A key branched
macromonomers: HN N
N
NJ ON
N NCy5.5-MM
chex-MM (MRI contrast) (NIR fluorescence)
B
-M-N
C N
Gribbs 3rd
1) THF, RT, 90min 2) ethyl vinyl ether
Figure 1. ORCAFluor synthetic scheme. A.
Structures of branched MMs B. General procedure for ROMP synthesis of brush polymers
provide MRI contrast. While gadolinium-based agents are common in the clinic, they still face safety issues for certain patient populations.2 1-23 In an effort to address the toxicity of Gd agents, we investigated organic radical contrast agents, specifically nitroxide radicals. Nitroxides have generally been considered too low contrast or too
reactive in vivo for use in a clinical setting.24,25 Conjugation of multiple nitroxides to a
number of nitroxides per molecule increases the inherent molecular relaxivity of the probe. The latter issue can be addressed through the design of novel sterically shielded nitroxides. In 2013, the Rajca group reported an important advance by combining these concepts: they attached sterically shielded spirocyclohexyl nitroxides (chex) to nanoscale dendrimers. 27,28 These
materials displayed MRI contrast in vivo up to 1 h after injection. Though this technique was effective, the dendrimer architecture limits the number of chemically addressable groups, which must be divided between solubilizing polyethylene glycol (PEG) chains and MRI active chex.
Previous work in the Johnson group has shown that ring opening metathesis polymerization (ROMP) of branched, nitroxide-conjugated macromonomers is an effective route to PEG-based branched bottlebrush polymers with a dense, sterically-shielded nitroxide core.29 Along with functional group compatibility, ROMP provides excellent control over the average degree of polymerization (size), and often provides high conversion with low molar mass dispersity.30-3 2 Using the branched macromonomer motif previously studied by the Johnson
group also allows for one-to-one PEG to
excitation limited emission excitation full emission
nitroxide loading, which ensures high at640nm at 739 nm at 640 nm at703n
solubility and shielding without sacrificing nitroxide density. Thus, we set out to create a PEG-based chex macromonomer
(chex-VMRI ac ive XMI inactive
MM, Figure 1) and a set of corresponding Xfluorescence quenched fluorescence enhanced
Figure 2. Redox response. Upon exposure to
brush polymers for evaluation as organic ascorbic acid, nitroxide radicals will be reduced. This
renders the polymer MRI inactive, while enhancing
To further demonstrate the advantages of our approach, we sought to incorporate a second imaging handle into these systems through simple copolymerization. We chose to use a near-IR fluorophore that would provide in vivo fluorescence-based tracking of the polymer after nitroxide reduction (i.e., once the polymer is no longer MRI active). As displayed in Figure 2, the interaction between fluorophores and nitroxide radicals can be used as a type of redox activated on-off switch. There is extensive precedent for TEMPO quenching the fluorescence of excited singlet states via catalysis of intersystem crossing.33-37 We attempted to utilize this quenching behavior by developing a polymer that would be MRI active in the radical form and fluorescent upon polymer reduction. Emission quenching is possible for a wide range of
1. HCI 0 Cyclohexanone 0 H202 0 2. Br2 0 NH4CI NaWO4 3. NaNO2 Br N 40% N 60% C N3 30% N-H H 6 0 OH ON N3 0
ONHS, EDC, 3-aminopropyl HN
4M NaOH 0 H oDMAP azide
60% 70%%
6* 0.
chex-NHS chex azide
Scheme 1. Chex synthesis. Chex-NHS was synthesized according to
literature procedures, then converted to an azide to perform "click" reactions.
fluorophores, so we
opted to use
commercially available
Cy5.5 (Figure 1),
which has a maximum
excitation at 675 nm
and a maximum
emission at 700 nm.
Tissue absorption and background fluorescence is very low in this range,38 which leads to a high signal-to-noise ratio.
Results and Discussion. In order to incorporate chex into our branched bottlebrush
platform, we targeted the chex-azide shown in Scheme 1. Chex-azide can be synthesized via coupling of 3-aminopropyl azide and chex-NHS. The Rajca lab generously supplied chex-NHS
Al
D nj -141
-76
-3.
:
chex-MMEkujkn irmi min.
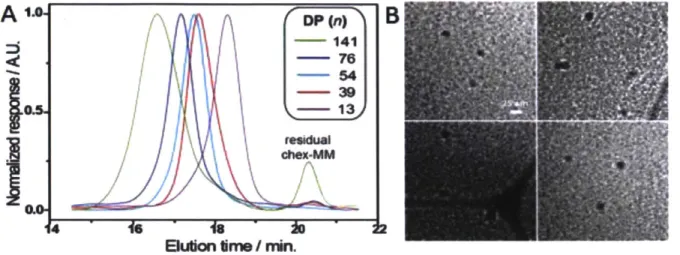
Figure 3. Polymer size characterization. A. GPC traces of several bottlebrush polymers derived from chex-MM with degree of polymerization n. B. Cryogenic transmission electron microscopy (Cryo-TEM) image of 55 unit bottlebrush polymer. Scale bar represents 25 nm.
for most of the following studies, though we have also conducted Rajca's original synthesis shown in Scheme 1. The N-hydroxy succinimidal ester was then easily displaced using 3-aminopropyl azide.39 Copper(I)-catalyzed azide-alkyne cycloaddition (CuAAC) "click" chemistry was employed to couple chex-azide to chex-MM in near quantitative yield using CuOAc in DCM solvent,30'40 with some product loss due from HPLC purification. Grubbs' 3rd generation bis(pyridyl) catalyst was used to perform ring opening metathesis polymerization (ROMP) of chex-MM to generate branched bottlebrush polymers with average degrees of polymerization ranging from 13-141. GPC traces of this series can be found in Figure 3A; cryogenic transmission electron miscroscopy (cryo-TEM, Figure 3B) and dynamic light scattering (DLS, Table 1) were performed to further characterize the 55 unit bottlebrush P1 (Figure 3B).
A Ti-weighted MRI phantom for P1 (10 mM nitroxide in
PBS) shows a 3.34 0.14 fold enhancement compared to PBS alone
1.00t 0.05
(Figure 4). Longitudinal (rj) and transverse (r2) relaxivities for chex-2.98t 0.16 MM and this series of polymers were measured using a Bruker 7 T
MRI instrument (Table 1). The r, and r2 values for chex-MM were 0.21 mM-Is-1 and 0.30 mM-1s4, respectively. As expected for slowly Figure 4. MRI phantoms. diffusing NPs,4,20 the polymers displayed increased relaxivity values.
T1 weighted MRI of PBS,
chex-MM, and P1 For example, the values for PI were r, = 0.32 mMI s-1 and r2 = 0.82
polymers.
mM-1 s 1, which correspond to 52% and 173% increases, respectively. The molecular relaxivities of Pt can be obtained by multiplying the per nitroxide values by the average number of nitroxides per particle: rimol = 15.7 and r2moI = 40.3 for P1. These values are comparable to clinically used metal-based contrast agents19, likely enough to provide sufficient contrast for in
vivo imaging applications. The degree of polymerization n = 55 sample was chosen for all subsequent polymer studies.
n D DH (nm) ri (mMfs-) r2 (mA.Ts1) n.a. (chex-MM) 1.02 - 0.21 0.30 13 1.03 11.8 0.31 0.55 39 1.02 14.6 0.32 0.70 54 (P1) 1.05 16.8 0.32 0.82 76 1.08 18.0 0.36 0.84 141 1.30 21.0 0.31 0.51 proxyl 1.00 - 0.15 0.17 dendrimer 1.00 - 0.44 0.86 15XL star 1.28 19.2 0.45 3.07 20XL star 1.27 24.3 0.36 5.77
Table 1. Bottlebrush polymer characterization. Dispersity (GPC), hydrodynamic radius (DLS),
and r, and r2 relaxation parameters for brushes with varying degrees of polymerization (n). Proxyl
refers to 3-carboxy-proxyl, and "dendrimer" refers to Rajca'a previously studied polypropylenimine (PPI) nitroxide-conjugated fourth generation dendrimer.
With positive MRI contrast results, we turned toward the synthesis of a fluorescent
Cy5.5-MM. It was unknown whether the poly-ene functionality of Cy5.5 would be compatible
with ROMP. Furthermore, there were no previous reports of Cy5.5 fluorescence quenching by TEMPO. Starting with the Cy5.5 NHS ester, Cy5.5-MM (Figure 1) was synthesized analogously to chex-MM. Polymerization was then tested by adding 5% Cy5.5-MM with 95% nonfunctional
PEG-MM. Overlapping refractive index and UV (675 nm) traces of the resulting polymer
indicated complete incorporation of Cy5.5-MM. To examine the fluorescent properties of a dual-modal nitroxide/fluorophore, polymer OF1 was polymerized via ROMP of 1% Cy5.5-MM and
99% chex-MM with a target degree of polymerization n = 55. This polymerization was
performed on scales up to 250 mg in near-quantitative yield.
It has been shown that TEMPO can quench up to 64% of fluorescent emission of Cy5,41 a similar cyanine dye to Cy5.5, when the two are covalently bound directly to each other; within our polymer construct, increased nitroxide-fluorophore distance led us to expect weaker interactions, though the increased number of nitroxides could be beneficial. Additionally, it was unclear to what extent the steric shielding of chex would affect emission quenching. To test these properties, a sample of OF1was added to pH 7.4 PBS buffer and excited at 640 nm. The emission at 703 nm (peak emission) was recorded and averaged over three samples. Sixty equivalents of sodium ascorbate, a major source of in vivo nitroxide reduction,42,43 were added to the solution and the maximum emission was recorded, providing a 116% increase in fluorescence (Figure 5). In the presence of 10mM glutathione (GSH), addition of ascorbate affected fluorescence more drastically, up to a 248% increase (figure 5C). This behavior of co-reductants is not unexpected; while addition of GSH alone does not readily affect fluorescence,
A
- Absom(ceu>B
- C ---Contrlyr, no rumxideEmission (au) ---- 1(nM GSH, then 60 eq. Asc
680 703 a25D -- 60 eq. Asc
60W 71 0 6 80 70 70 70 03
I'
--Wavelength (nm) Wavelength (nm) Time (min.)
Figure 5. Fluorescent behavior of OF1. A. Absorbance and emission spectra of OF1. B. Emission change 0-75 minutes after addition of 60 eq. sodium ascorbate. C. Fluorescence increase after addition of sodium ascorbate or ascorbate with GSH. Control polymer with no nitroxides was also exposed to ascorbate reduction conditions, with negligible change in emission.
fluorescence off.43 While the increase in fluorescence demonstrated by OF1 is less than seen in many small molecule sensors, we reasoned that it would be suitable for initial in vivo study.
Prior to the proposed imaging studies, the toxicity of OF1was examined in vitro and in
vivo. An MTT cell viability assay of OFR showed no toxicity to HeLa cells in concentrations up
to 3 mg/mL, and in vivo tolerance was established in healthy BALB/c mice for doses up to 2000
1 44
mg-kg- .4 NIR images were obtained using IVIS (In Vivo Imaging System) of the live animals to
demonstrate our ability to track biodistribution, and blood draws were performed to obtain pharmacokinetic information. The fluorescent load of OFR was enough to obtain quantitative clearance information, and prolonged blood circulation typical of this size nanoparticle was observed in a typical two-compartment fashion: an initial rapid 60% decrease in fluorescence was observed, followed by slow decay to 20% remaining fluorescence over 3 days.
re-ui-, i on L-L- in ecron
C 30 min
post-OF1 injection
50
a
re-OFI post-OFI ost-OF
E
F
40Git
2 liver: 40 G spleen. 3D kidneys.20 * heart: 10-lung: brain:Figure 6. In vivo MR and IVIS images and quantification. A,B. Pre- and 30 min post-injection MR images. Noticeable contrast can be seen in the renal pelvis and aorta. C. MR contrast per organ.
D,E. Whole animal IVIS pre- and post-injection. F. IVIS of organs 30 minutes post-injection. G.
Fluorescence and EPR intensity of blood and homogenized organs at 30 minutes and 24 hours.
Next, in vivo imaging experiments were performed to examine MRI and fluorescence differences between pre-injection, 30 minutes, and 24 hours after dosing with OF1. By quantifying changes to the MRI contrast, spin concentration (as measured by EPR), and fluorescence intensity of the organs at these time points, we were able to obtain kinetic information about the organ-by-organ signal changes caused by reduction and biodistribution/clearance of OF1.
Before administration of OFt, MRI parameters for Ti weighting were optimized using an FSEMS (fast spin-echo multi-slice) pulse sequence, and animal autofluorescence was examined via IVIS. The fluorescent intensity of the OF1 dose was measured to provide the total amount of injected fluorescence. All procedures involving animals were approved by the MIT Committee for Animal Care and monitored by Koch Institute Animal Imaging Core director Scott Malstrom. Four animals were used for each experiment.
Animals were anesthetized with 1-2% isoflurane, imaged via MRI and IVIS (Figure 6A,
D) and administered (tail-vein injection) 30 mg OF1 in 0.3 mL sterile PBS buffer. Animals were
imaged again after 30 minutes (Figure 6B, E) or 24 hours and then sacrificed for organ collection. Fluorescence intensities were acquired for the heart, lung, liver, kidney, brain, spleen, muscle and blood (Figure 6F), and organs were frozen on dry ice and sent to our collaborators for spin concentration determination via EPR. As seen in Figure 6C, the highest MRI contrast at the 30 minute time point is found in the renal pelvis of the kidney, while the largest fluorescence signal was seen in the liver (Figure 6G). At 24 hours, the MRI contrast was drastically diminished, but fluorescence signals and significant spin concentrations were observed in certain tissues. PEG nanoparticles of this size are known to selectively accumulate in the liver.45 These data suggest that appreciable concentrations of OF1 can be found in the liver, but the EPR data suggest that the nitroxides are reduced in this organ, which is the location of ascorbate biosynthesis in mice. This hypothesis is supported by the comparatively low EPR signal in the liver, alongside previous work in nitroxide reduction kinetics. 46'47 Furthermore, the maximum MRI contrast and spin are observed in blood, which is expected given the extended blood circulation time of these PEG-based particles along with the very low concentration of ascorbate in blood.
The promising A A B results displayed by OF have led us to
4
2. o explore this Nb-chex nitroxide/Cy5.5 N PEG-MM= / H Grubbs 3rd = $ it combination in other polymer architectures oX
2
with the goals of
Figure 7. Structures and general procedures for polymer formation. A.
Chex-increasing MRI MM to star and B. Nb-chex and PEG-MM to random copolymer brush.
contrast, the on/off signal-to-noise of the fluorescence probe, and introducing degradable groups into these architectures. Relaxivity is highly dependent on the hydrodynamic environment around the radical, as well as the tumbling rate of the particles as determined by the aspect ratio and size of a particle.4 8 To alter these parameters, we have performed preliminary studies on two additional types of macromolecular architectures: random copolymer bottlebrush polymers and brush-arm star polymers (Figure 7). Copolymer bottlebrush polymers were created by synthesis of a small molecule analog of chex-MM labeled Nb-chex, and copolymerizing it with nonfunctional PEG-MM in varying ratios. Brush-arm star polymers (BASPs) were created from
chex-MM and a bifuctional norbomene crosslinker synthesized by Jenny Liu. By polymerizing
short bottlebrush polymers and varying the number of added crosslinker (XL) equivalents, BASPs with a range of molecular weights were polymerized. GPC and DLS data were collected for each sample, and preliminary MRI studies were performed in the Jasanoff laboratory to measure r, and r2 relaxivity (Table 1). While r1 relaxivities were comparable to OF, r2 relaxivity for the star polymers saw a 7-fold increase over the highest previous measurement.
Conclusions. A class of entirely organic, ascorbate-responsive, dual-modality molecular
imaging agents was prepared using graft-through ROMP of novel spirocyclohexyl nitroxide and Cy5.5-conjugated MMs. Exposure of these materials to ascorbate leads to nitroxide reduction and enhanced fluorescence emission. In vivo studies confirmed significant MRI contrast
enhancement (among the highest known for organic MRI contrast agents), as well as fluorescence emission that correlates with ascorbate concentration in vitro and in vivo. When viewed together, data from MRI, IVIS, and EPR suggest a correlation between ascorbate
concentration and OFt fluorescence, confirming that OF1 can be used to provide complementary information about in vivo redox processes. To our knowledge, this work represents the first example of an organic agent for dual 1H MRI contrast enhancement and fluorescence imaging. The redox response and long circulation of these particles could make them applicable for tumor imaging studies; additionally, the modular synthesis is amenable to
incorporation of targeting ligands or therapeutics.
Experimental Methods.
General Considerations. All reagents and solvents were purchased from Aldrich or VWR unless
otherwise indicated. Bis-spirocyclohexylnitroxide-N-hydroxysucciniidy (NHS) ester,2 8
3-aminopropyl azide 39, exo-norbornene alkyne-branch-NHS ester , and Grubbs 3rd generation
bis(pyridyl) catalyst4 9 were synthesized according to previously reported literature procedures.
Anhydrous, deoxygenated dichloromethane (DCM) and tetrahydrofuran (THF) were used from solvent purification columns (JC Meyer).
Instrumentation information. 1H and 13C nuclear magnetic resonance ('H NMR) spectra were
obtained from Bruker AVANCE-400 NMR spectrometers at MIT. NMR spectra were analyzed using MestReNova NMR 8.0.1 software and referenced to the residual chloroform peak at 7.26
ppm.
Electron Paramagnetic Resonance (EPR) spectra were obtained at the University of Nebraska using a Bruker CW X-band spectrometer, equipped with a frequency counter. The spectra were obtained using a dual mode cavity; all spectra were recorded using an oscillating magnetic field perpendicular (TE 02) to the swept magnetic field. 2,2-diphenyl-1 -picrylhydrazyl
(DPPH) powder (g = 2.0037) was used as a g-value reference.
Gel permeation chromatography (GPC) analysis was performed on an Agilent 1260 LC system equipped with an Agilent multi-wavelength UV/Vis detector, Wyatt T-rEX refractive index detector, Wyatt DAWN EOS 18-angle light scattering detector, and two Shodex KD-806M
GPC columns. The GPC system was equilibrated at 60 'C with a 1 mL/min flow rate of DMF
with 0.025 M LiBr.
Dynamic light scattering (DLS) measurements were taken at room temperature using a Wyatt Technology DynaPro Titan DLS. Samples were dissolved in phosphate buffered saline solution, passed through a 0.4 tm nylon syringe filter into a 0.3 mm cuvette. Average hydrodynamic radii were obtained using Dynamics V6 software from DynaPro Wyatt Technologies. DLS correlation curves were fit using the CONTIN algorithm.
Matrix-assisted laser desorption/ionization time-of-flight (MALDI-TOF) analyses were collected on a Bruker OmniFlex instrument with a 337 nm N2 laser with a 0.1 nm spectral
Liquid chromatography-mass spectrometry (LC-MS) data were obtained on an Agilent
1260 LC system with an Agilent 6130 single quadrupole mass spectrometer with a HALO
column using linear gradients of 0.1% acetic acid in nanopure water (v/v%) and acetonitrile. Preparative high-performance liquid chromatography (prep-HPLC) purification was performed on a Beckman Coulter System Gold HPLC with a 127 solvent pump module and
166P detector set to detect at 210 nm. A linear gradient from 95:5 (v:v%) 0.1% AcOH in H20
(v:v%): MeCN to 5:95 (v:v%) 0.1% AcOH in H20 (v/v%): MeCN over 9-14 minutes was used for separation.
Absorbance measurements were collected on a Varian Cary 50 Scan UV/Vis spectrophotometer and analyzed using Cary WinUV software in nanopure water. Fluorescence data were taken on a Horiba Jobin Yvon Fluorolog-3 fluorometer using a 450 W Xe lamp and right-angle detection. 0 0 0 1.5 N3"- NH2 N3 N - H 0 N DCM, RT, 12h N
'6
Bis-spirocyclohexylnitroxide-propyl-azide. Bis-spirocyclohexylnitroxide-N-hydroxysuccinimidyl (NHS) ester (60 mg, 0.17 mmol) was added to a vial containing 3-aminopropyl azide (80 ptL of 3M solution in toluene, 0.24 mmol) in 1 mL dry DCM. The reaction was stirred for 1 hour, then transferred to a silica gel column and purified via flash chromatography with 5% methanol in DCM. Product containing fractions were determined byresidue was dried under vacuum to give the desired product as a yellow oil in 95% yield. 'H NMR is provided below in Figure S13. DART-HRMS calculated for C18H30N502 [M+H]f
349.247, observed 349.2467. ' H NMR (400 MHz, CD30D, r.t.): 6 1.36 (s, 2H), 1.62 (in, 5H),
2.24 (s, 2.2H), 2.77 (in, 3H), 3.40 -4.15 (in, 12H), 4.66 (s, 1.5H), (6.39 (s, 0.1H).
Poly(ethylene glycol) monoamine (PEG-NH2): K
1. K
H2N OH H2N O OH
"' OH 068
2.6 8/\
Reaction Setup: A lecture flask of ethylene oxide (EO) was connected in series to a graduated
vessel (for EO drying, vide infra), and a reaction flask. Teflon tubing was used to connect the vessels, all stir bars were pyrex coated, and all joints were lubricated with fluorinated grease. All portions of the reaction setup were carefully kept under nitrogen at all times and isolated from one another until otherwise indicated. A blast shield was placed in front of any vessel containing
EO.
Potassium naphthalenide initiator: An oven-dried 100 mL Shlenck flask equipped with a
pyrex stirbar was evacuated and refilled with nitrogen three times. Potassium metal (0.92 g, 23.6 mmol) was cut under mineral oil and transferred with tweezers to a vial containing dry cyclohexane. Potassium was transferred to a second vial of clean cyclohexane to remove any residual mineral oil, and then added quickly to the Schlenk flask. Residual cyclohexane was removed by vacuum (30 min). Napthalene (3.30 g, 25.8 mmol, 1.1 eq) was then added to the
Schlenk flask, which was briefly evacuated and refilled with nitrogen. Dry THF (23.6 mL) was added; the solution immediately began to turn dark green as potassium dissolved. The flask was covered with aluminum foil and stirred at room temperature for 2 h. The initiator concentration was tested by titration against 0.10 mL (1.3 mmol) isopropanol in 10 mL THF. After adding 1.40 mL of initiator, the dark green initiator color remained for over ten seconds, indicating a concentration of 0.93 M. The initiator was stored in the aluminum covered Schlenk flask for up to three days before use.
Calcium hydride (1 g) was added to the drying vessel (labeled b in Supplementary Fig. 12). An ice bath was placed around the drying vessel, the EO tank was opened slowly and EO was allowed to condense in the drying vessel. Once 22 mL (440 mmol) of liquid EO had accumulated, the EO lecture flask was closed, isolated from the drying vessel, and removed from the hood. The ice bath was maintained around the drying flask as redistilled aminoethanol (0.40 mL, 6.6 mmol) and dry THF (45 mL) were added to the reaction flask through a rubber septum. Potassium naphthalenide solution (7.10 mL of 0.93 M, 6.6 mmol) was added, and the mixture became white and cloudy; the precipitated potassium aminoethanoxide was washed from the flask walls with 5 mL THF. The ice bath was then removed from the drying vessel and placed around the reaction flask. The drying vessel was opened to the reaction flask, and the EO was allowed to boil and slowly distill into the reaction flask. Once the drying flask was empty, the reaction vessel was sealed, the ice bath was removed, and the reaction was allowed to warm to room temperature. The polymerization was stirred at room temperature for 72 h. After this time,
6.6 mmol of hydrochloric acid (5.3 mL of 1.25M HC1 in methanol) was added dropwise to the
poured directly into 700 mL of cold diethyl ether and stored at -20' C for 1 h. The white precipitate was vacuum filtered, redissolved in 70 mL of toluene, and precipitated in cold ether again. After a second filtration, the polymer was vacuum dried overnight to remove all residual solvent, providing a powdery white solid in 92% isolated yield. H NMR spectrum is shown below. 0001.1.051 0 H N t CuOAc, DCM, N lh O H ao2.0.97 H2N(--- 00 RT, 14h N' 0 2 HN chex-MM N
Chex-MM. Compound 2 (37.4 mg, 75 mmol) was added to a vial with azide 1 (27.6 mg, 79
mmol) and 3 mL dry DCM under N2. A spatula tip of CuOAc was added and the vial was
flushed with N2. After five minutes, LC/MS analysis of the reaction indicated nearly complete
conversion of 2 to the intermediate triazole-branch-NHS compound. Solid PEG-NH2 (220 mg,
73 mmol) was then added to the reaction and the mixture was stirred for 14 h. The entire reaction
mixture was dried on a rotary evaporator, redissolved in MeOH (3 mL), passed through a 0.4 [im Nylon syringe filter, and subjected to prep-HPLC. The pure fractions containing chex-MM were condensed with a rotary evaporator. The resulting residue was dissolved in
dichloromethane (DCM), dried over Na2SO4, condensed on a rotary evaporator, and dried
overnight under vacuum to yield a light yellow solid in 65% yield. MALDI spectrum is shown in Supplementary Fig. 1, and 'H NMR is provided in Supplementary Fig. 15. 1H NMR (400
MHz, CD30D, r.t.): 6 1.27 (m, 6H), 1.52 (in, 6H), 2.14 (s, 1OH), 2.55 (s, 2H), 2.69 (in, 3H), 3.28 (s, 2H), 3.48 (m, 6H), 3.66 (m, 220H), 3.85 (t, 2H), 6.30 (s, 2H), 6.51 (s, lH).
/ 0 0 1. 1.05 Cy5.5-propyl azide 0 H N-N O'N CuOAc, DCM, RT, 1h N N N )H 0 JN 2. 0.95 H2N O 0 0 68 0 0 RT, 14h \NZC 2 N H N-Cy5.5-MM
Cy5.5-MM. Compound 2 (1.3 mg, 2.6 mmol) was added to a vial with Cy5.5-propyl azide
(Kerafast, 2 mg, 2.8 mmol) and 1 mL dry DCM under N2. A spatula tip of CuOAc was added
and the vial was flushed with N2. After five minutes, LC/MS analysis of the reaction indicated
nearly complete conversion of 2 to the intermediate Cy5.5-branch-NHS compound. Solid
PEG-NH2 (7.7 mg, 2.5 mmol) was then added to the reaction and the mixture was stirred for 14 h. The
entire reaction mixture was dried on a rotary evaporator, redissolved in MeOH (0.7 mL), passed through a 0.4 Em Nylon syringe filter, and subjected to prep-HPLC. The pure fractions containing Cy5.5-MM were condensed with a rotary evaporator. The resulting blue residue was dissolved in dichloromethane (DCM), dried over Na2SO4, condensed on a rotary evaporator, and dried overnight under vacuum to yield a blue solid in 77% yield. The MALDI spectrum is shown in Supplementary Fig. 1, and the 1H NMR is shown in Supplementary Fig. 16. 'H NMR (400
MHz, CD30D, r.t.): 6 1.15-1.29 (in, 7H), 1.42-1.58 (in, 8H), 1.76 (s, 2H), 2.20-2.55 (in, 18H),
2.64 (d, 4H), 3.24 (in, 6.5H), 3.39 (in, 6.5H), 3.63 (in, 305H), 4.18 (s, 2H), 4.40 (in, 2H), 4.54 (s, 2H), 6.25 (in, 3H), 6.37 (in, 1H), 6.72 (in, IH), 7.39 (t, 2H), 7.48 (in, 2H), 7.61 (t, 2H), 7.93 (in,
6H), 8.07 (in, 2H).
Branched bottlebrush synthesis by ROMP: All polymerizations were performed in a glovebox
under N2 atmosphere. All reported brushes were made in the same manner; the method described
Chex-MM (198 mg, 0.05 mmol) and Cy5.5-MM (2.0 mg in 20pL, 0.5 pmol) were combined in
a 4 mL vial and dissolved in 0.795 mL THF. A solution of Grubbs 3rd generation bispyridine
catalyst (0.278 mL of 4 mg / mL catalyst solution, 1 pmol) was added to the vial and stirred for
90 minutes. The reaction was quenched with a drop of ethyl vinyl ether; a small aliquot was
taken for GPC characterization, and the rest was transferred to a 15 kDa molecular weight cutoff dialysis tubing (Spectrum Laboratories) with 5 mL of Millipore water. The polymer was dialyzed against 500 mL of Millipore water (3 rounds of fresh water were added with 2 h between each solvent exchange) with gentle stirring to remove any unreacted MM. The polymer solution was then lyophilized to dryness, and stored in the dark at 4 'C.
Fluorimetric analysis of nitroxide quenching: Analysis of Cy5.5 fluorescence quenching
within spirocyclohexyl nitroxide-functionalized polymers was performed by monitoring excitation and emission at 640 nm and 703 nm, respectively. Slit widths of 5 nm for excitation and 7 nm for emission were used for all studies. Polymer samples (OFI or control polymer with no nitroxide) were dissolved in 2 mL of pH 7.4 IX PBS buffer; UV/Vis and fluorescence spectra were collected. Aliquots of ascorbic acid were then added to the cuvette as outlined in Fig. 3B. Emission spectra were repeatedly obtained until no change was observed. A representative series of spectra are shown in Figure 5. Note: The pH was measured before and after ascorbic acid addition; the values were 7.0 and 6.31 respectively. The absorption/emission properties of
Phantom relaxivities by MRI: Monomers and polymers were completely transferred as solids
using dichloromethane to another set of accurately weighed clean vials, and then evacuated to a constant mass in Schlenk containers (1 mTorr-vacuum). For selected monomers and polymers, small samples (0.4 - 0.8 mg) were examined by 'H NMR spectroscopy in chloroform-d (500
MHz, cryoprobe, 3-mm tubes); only monomer MM1 had a very small residue of dichloromethane, and all other samples, examined by NMR spectroscopy, were solvent free.
To each vial containing the sample remaining after evacuation and NMR spectra, 0.5 mM PBS (0.800 mL, pH 7.2 checked with pH meter) was added, to provide homogenous-to-turbid stock solutions. Spin concentration of stock solutions was determined by EPR spectroscopy. Serial dilution (100 - 10% in 10% increments) of each stock solution provided an array of ten 0.1 mL-samples in PCR tubes; for each T, and T2 measurement of 'H in water, the array of ten
0.1-mL samples and 0.1-mL sample of buffer (11 PCR tubes) were used.
T, and T2 measured at the University of Nebraska Medical Center were obtained using coronal T, and T2 map imaging protocols. T, mapping was done using a progressive saturation RARE T, mapping measurement with RARE factor = 4, First TE and spacing of 6.4 ms, TR=
10000, 5000, 3000, 1500, 1200, 800, 500, 450, 400, 350, and 300 ms, 60 mm field of view
(FOV), 1 mm slice thickness, one slice for a total acquisition time of 10 min. T2 mapping was done using CPMG phase cycled multiecho imaging of all sample concentrations including buffer in a single image. Acquisition parameters were: 10 echo, TE=10 ins, one Imm thick slice, 256 x
128 matrix, 1 average, 3000 ms repetition time, 60 mm FOV, for a total acquisition time of 10
min. T, and T2 values were extracted from each sample in the image using regions of interest in the image sequence analysis tool in Paravision 5.1. T2values were determined by using the even
numbered echoes, fitting the noise floor using the highest free radical concentration, and fixing the value for the remaining samples in each image.
Signal Intensity as a function of relaxivity: During MRI acquisition time, T1 weighting is
accomplished by use of a short repetition time (TR) relative to the T1 of the imaged sample or
tissue. After several pulses (dummy pulses) a steady state magnetization is established which has
an intensity (Mss) relative to the maximum signal intensity (Mo) of: , (eTRT1sa where
a = excitation flip angle. The images acquired for Figure 4 were obtained using a fast spin echo sequence (a=900) with a TR of 500 ms. T1 of the PBS was measured as 2,770 ms. The molar T1
relaxivity (ri) of chex-MM was found to be 0.208 mM-'s-1 and the molar relaxivity of P1 was found to be 0.318 mM' s-1. Thus for the three samples in Figure 4, PBS, 10 mM chex-MM in PBS, and 10 mM P1 in PBS, the TI's of the samples were: l/T1 = l/TlPBS ri*(10 mM) which comes to 2770 ms (PBS), 410 ms (chex-MM), and 282 ms (P1). This results in Ms,/Mo values for the three samples of 0.165 (PBS), 0.704 (chex-MM), and 0.830 (P1). Normalizing the intensity of PBS to 1, this gives relative signal intensities of 4.26 (chex-MM) and 5.03 (P1). However, this relative signal intensity does not include decay due to T2. The RARE (fast spin echo) sequence used a four-echo train with the central k-space echo at an echo time (TE) of 8.9 ms. Signal intensity loss due to T2 loss is given my MT2/Mss = e-TE/ 2. The T2 of PBS is 325 ms. Molar T2 relaxivity (r2) of chex-MM was found to be 0.300 mM-1s-1 and the molar relaxivity of P1 was found to be 0.821 mM' s -. Thus for the three samples in Figure 4, PBS, 10 mM chex-MM in PBS and 10 mm P1 in PBS, the T2's of the samples were: l/T2 = l/T2PBS + r2*(10 mM)
which comes to 325 ms (PBS), 165 ms (chex-MM), and 89 ms (Pt). Thus T2 signal loss for this sequence in each sample resulted in MT2/Mss = 0.97 (PBS), 0.95 (chex-MM), and 0.90 (P1).
Normalizing PBS to 1 and taking into account the steady state magnetization, this results in final signal intensities of 4.17 (chex-MM) and 4.67 (P1), a bit higher than the measured values, but consistent with a 12% contrast enhancement seen with P1 over chex-MM. Note that the T2 decay calculation does not take into account the multiple echo train, but only includes the first echo, which should dominate the signal intensity in the center of k-space.
Cell culture and in vitro toxicity: HeLa cells (ATCC) were maintained in MEM Media
supplemented with 1% penicillin/streptomycin and 29% fetal bovine serum in 5% C02 humidified atmosphere (37 C). Cells were plated in 96-well plates at 10,000 cells per well and grown for 24 h before treating with varied concentrations of polymer. Each polymer concentration was represented by four replicate wells. After 48 h, the cells were incubated for 4 h with thiazolyl blue tetrazolium bromide (MTT). Reduced thiazoyl tetrazolium formazan was then solubilized with dimethyl sulfoxide (DMSO), and cell viability was calculated based on absorbance at 550 nm.
Animal usage: All procedures involving animals were reviewed and approved by the MIT
Committee for Animal Care. Toxicity and pharmacokinetics studies were performed on healthy female BALB/c mice, aged 12-16 weeks. MRI studies were performed on healthy female NCR nude mice receiving and alfalfa free diet to minimize autofluorescence. All studies involving animals were performed on groups of n=4 or n=5 to provide statistical significance. Exclusion criteria included human error in NP administration.
In vivo toxicity and pharmacokinetics: Eight polymer solutions ranging from 0.1 - 40 mg of
OF1 in sterile pH 7.4 PBS buffer were prepared. To find a rough toxicity threshold, solutions
were first administered to one mouse per particle solution. NP solutions were passed through a 0.2 micron filter before being injected slowly via catheter into the tail vein. Upon seeing that the polymer was well tolerated by all animals, two groups of 5 animals were dosed with 30 or 40 mg of OF1. Animals receiving 40 mg of OF1 demonstrated higher weight loss and some initial lethargy, while animals receiving 30 mg displayed no adverse physical effects; this dosage was used for all subsequent imaging studies.
In vivo MRI and IVIS: Live animal MRI experiments were conducted at the Koch Institute for
Integrative Cancer Research at MIT in a Varian 7T/310/ASR-whole mouse MRI system. TI weighted MR images were collected using the fast spin echo multiple slices (FSEMS) pulse sequence with minimum repetition time (TR) = 739 ms, ESP = 9.52 ms, ETL = 4, a 256x256
matrix, and 4 averages over 18 slices at 1 mm thickness. Scans were collected with respiratory gating (PC-SAM version 6.26 by SA Instruments Inc.) to avoid confounding noise due to chest movement. Respiratory rate and animal temperature were closely monitored during image collection.
In vivo fluorescence images were obtained on an IVIS Spectrum bioluminescent and fluorescent imaging system from Xenogen. Excitation and emission values (640 nm, 700 nm respectively) were kept constant, and exposure times from 2-10 seconds were used to obtain clear images. Epi-fluorescence is reported in radiant efficiency and used only as comparison between pre- and post-injection values.
MRI and IVIS images were obtained for each animal (n=4) before administration of OF1. Mice were fit with tail vein catheters and slowly injected with OFI solution. Thirty minutes or 24 hours after injection was complete, mice were reimaged with both IVIS and MRI, then immediately sacrificed in a C02 chamber for tissue collection and fluorescence imaging. Organs were briefly washed with saline to remove any exogenous blood from the dissection process.
In vivo MRI and IVIS data analysis: A region of interest (ROI) around each organ was
manually selected for a given image slice. The average intensity and are of the ROI were measured. This procedure was repeated for each image slice where the organ/tissue was visible. Using Excel (Microsoft), the average intensity of each ROI was multiplied by its area. These values were then summed together for all image slices of a given organ. This sum was divided
by the sum of the ROI areas for the same organ to provide the volume-average intensity. The
same procedure was repeated for images of 4 mice collected before and 30 min after injection of
OF (8 images total). Volume averaged intensity increases (shown in Figure 4C) were obtained
by subtracting from the following equation: ((contrast 30 min after injection) - (contrast before injection)) / (contrast before injection) * 100%. The values for % contrast enhancement were
normalized by the muscle, which was assumed to be zero. Note that this normalization changed the final values by less than 10%.
Ex vivo fluorescence methods: After collecting in vivo MRI and fluorescence data (vide supra),
mice were sacrificed in a CO2 chamber and immediately dissected to remove kidneys, liver, spleen, heart, lungs, brain, and a section of flank muscle tissue. Organs were quickly washed with PBS buffer to remove excess blood from the necropsy process.
Extracted organs were placed on a black, non-emitting background for fluorescence analysis. IVIS parameters were maintained from in vivo measurements. Excitation and emission values (640 nm, 700 nm respectively) were kept constant, and exposure times from 2-10 seconds were used to obtain clear images, and scaled to photons per second for all comparisons.
Ex vivo EPR spectroscopy: Throughout the ex vivo EPR spectroscopy section, labels
"YW 113 3r3 -6" and alike correspond to sample or experiment codes directly traceable to the laboratory notebooks or raw data.
The animal tissues were shipped in dry ice from MIT to Nebraska in centrifuge tubes; upon receiving, the tubes were stored in liquid nitrogen. For preparation of EPR samples, the tissues samples were temporarily moved from the liquid nitrogen storage to dry ice. Each tissue sample, one at a time, was rapidly thawed, and then transferred to a weighed vial. Then, 0 - 500 tL of
PBS buffer (0.5 mM, pH = 7.2) was added. The sample with PBS was then put into an ice-water bath and homogenized with rotor stator homogenizer, and then pipetted to a 4-mm O.D. EPR sample tube. The samples were degassed by sonication, as needed (e.g., when gas bubbles were visible). The EPR tube was capped, sealed with parafilm, and then stored briefly in acetone-dry ice bath prior to the measurement of spin concentration.
The spin concentrations of nitroxide radicals in tissues (pmol/g, pmol of S= % nitroxide radical per gram of tissue) were measured at -30 'C (243.2 K), to increase signal-to-noise for the aqueous samples. Measurements of the tissue samples were alternated with the measurements of the references for spin concentration (see: next paragraph) and value (DPPH powder as a g-value reference). For tissue samples with low signal-to-noise, the cavity background was recorded with identical parameters as for the tissue sample (including identical number of scans
and identical receiver gain). Typical parameters were as follows: microwave attenuation (20 dB), modulation amplitude (5 Gauss), spectral width (300 Gauss), resolution (512 points), conversion (40.96), time constant (10.24), and sweep time (20.97 sec.); these parameters were kept identical for the tissues, references, and cavity backgrounds. The number of scans (NS = 8 - 256) and receiver gain (RG) were adjusted as needed for each sample.
The reference for spin concentration was prepared from the same branched bottlebrush polymer as used for injection to mice. The polymer was dissolved in PBS (0.5 mM, pH 7.2) to provide 1.036 mM solution, for which concentration was calibrated with 3-carboxy-PROXYL in PBS buffer (0.5 mM, pH 7.2) at ambient temperature (295.0 K). Except when during the measurement, this reference was
concentration decay.
always stored in dry ice, and occasionally re-checked for spin
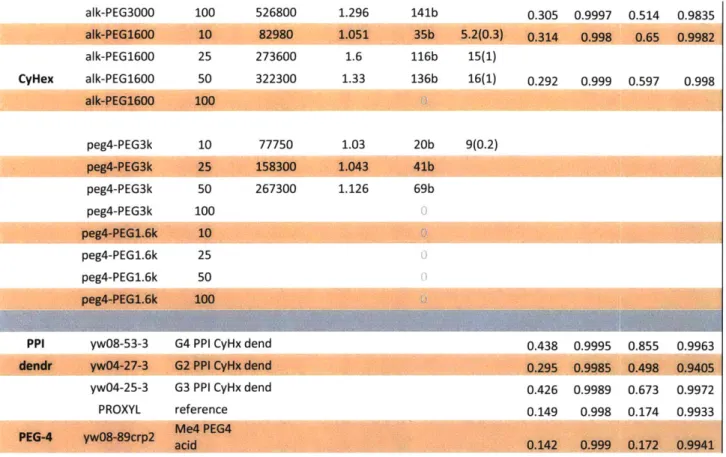
Nitroxide MM Target DP Mn from PDI DP DLS ri R2 r2 RA2
GPC D L l R2 r A
alk-PEG3000 10 29760 1.086 8a
alk-PEG3000 50 298500 1.04 81a
alk-PEG3000 100 789300 1.16 215a
alk-PEG1600 25 70040 1.031 31a 150(11)
TEMPO alk-PEG1600 50 288700 1.083 127a
peg4-PEG3k 10 50900 1.087 13a 11(1) 0.277 0.9995 0.353 0.9921 peg4-PEG3k 50 314700 1.197 83a 5.1(0.1) peg4-PEG3k 100 328600 1.69 87a 17(1) peg4-PEG1.6k 25 0 peg4-PEG1.6k 50 alk-PEG3000 10 47570 1.016 13b 0.321 0.9991 0.698 0.9963 alk-PEG3000 50 284800 1.078 76b 0.359 0.9993 0.841 0.9982 ... .... ... ... ... .... ... ..
alk-PEG3000 100 alk-PEG1600 25 CyHex alk-PEG1600 50 aik-PEdUM0 1W0 526800 1.296 141b 0.305 0.9997 0.514 0.9835 820 e051 .35b 5.2(0.3) 0.314 0.998 .S .98 273600 1.6 116b 15(l) 322300 1.33 136b peg4-PEG3k 10 77750 1.03 20b peg4-EG3k 5 158300 11443 4b peg4-PEG3k 50 267300 1.126 69b 16(1) 9(0.2) 0.292 0.999 0.597 0.998 peg4-PEG3k 100 peg4-PEG1.6k peg4-PEG1.6k 25 50
PPI yw08-53-3 G4 PPI CyHx dend 0.438 0.9995 0.855 0.9963
yw04-25-3 G3 PPI CyHx dend
PROXYL reference
.295 0.9985 0:A98 'S4
0.426 0.9989 0.673 0.9972
n-14q n-qqg n174 n-qq'4
Table 2. Extended Bottlebrush polymer characterization. A list of polymerized MRI active
Spectral Data.
7.5 7.0 6.5 6.0 5.5 5.0 4.5 4.0 3.5 3.0 2.5 2.0 1.5 1.0
Chex azide. 'H NMR (400 MHz, CDC13, r.t.) Broad, overlapping signals are expected for
radical species. I-. --I_ - - - - - - - - - - - -MUP~ 12 R~: 6.5 60 5'.5 50' 4.5 4.0 3.5 3'.0 25 fIL (lm 2.0 1.5 1.0 0.5 PEG-NH2. IH NMR (400 MHz, CDCl3, r.t.) 7.5 7.0
'k
Go "i R6.5 6.0 5.5 5.0 4.5 4.0 3.5 3.0 2.5 2.0 1.5 chex-MM 'H NMR (400 MHz, CDC13, r.t.) A' m -4
i-AAL
TU T m TT" .0 8.5 8.0 75 7.0 6.5 6.0 55 5.0 45 4.0 3.5 3.0 2.5 2.0 1.5 10 05 R nnMi Cy5.5-MM 'H NMR (400 MHz, CDC13, r.t.) 0 7.5 7.0 1.0 0.5 0.0 IJ
u IN -'--j A - ic4--"-Chapter 2: Gadolinium-based MRI contrast polymers
Introduction. In addition to the formation of organic MRI contrast agents, we have also
explored the area of gadolinium-based bottlebrush polymers. While the fluorescence redox effects described in the previous system would not be applicable, chelated gadolinium contrast agents have a much higher relaxivity than organic radicals.48 There are several small molecule gadolinium chelates in clinical use, generally focused on TI weighted MRI. While free gadolinium is highly toxic, these contrast agent chelates are deemed generally safe for adults with functioning kidneys,50'5 and typically display contrast increases of roughly 50 times the
per nitroxide contrast displayed by the previously described ORCAfluors.
Studies on polymers, 4-56 dendrimers,57-60 and other macromolecular systems61,62
containing multiple Gd 3 ions have shown heightened relaxivity per ion due to constructive
interactions between closely bound spins.63 Macromolecular contrast agents have become a very popular field of research, but have not been readily adopted clinically due to several significant drawbacks. Processing of multi-ion imaging agents is plagued by tedious synthesis, poor
Scheme 2. Synthesis of Gd-MM. 0 0 N ' N O'N 0 0 OtBu + OtBu ' 0 H N N oH NO N 0 Gd-MM NH G 0 NN N / ! N H N N 1. CuOAc 0 NN 6
o OtBu 2. PEG amine N 0
30% TFA NH N OtBu CHC3 N 0 O L N N: O GdC3 / oH N OBu N N N 68 OtBu p 0 N 0 DOTA-tris(tBu) MM N O DOTA-tris(acid) MM NH N OH 0 N N 0 r \ OH OH
stability, low solubility, or high size variability, while efficacy is mitigated by increased toxicity due to drastically decreased clearance rates.64
Synthesis of a gadolinium loaded macromonomer (Gd-MM) could alleviate many of these issues. To our knowledge, ROMP of a Gd"' tetraazacyclodecane-tetraacetic acid (DOTA) conjugate has not been previously demonstrated. Toward this effect, we have attempted several syntheses, the most promising of which is outlined in Scheme 2. Because gadolinium provides much stronger contrast enhancement than the previously studied nitroxides, a similar magnitude of MRI contrast may be obtained using a decreased concentration of contrast active MM. In this way it would be possible to copolymerize low fractions of MRI-active and fluorescent macromonomers alongside drug loaded or targeting macromonomers to administer effective ratios and doses of multiple functionalities in the same polymer construct. The ability to tag any ROMP polymer with small amounts of MRI-active and fluorescent MMs would allow great flexibility in examining in vivo polymer pharmacokinetics.
Results and Discussion. Several routes to the proposed MM were attempted with varying
degrees of success. Briefly, the less successful attempts are summarized here.
I. To avoid copper ligation within DOTA, a copper free click strategy was devised using dibenzocyclooctyne (DBCO). Tert-butyl protected DOTA azide was clicked to a Nb-branch-DBCO NHS ester. The NHS group was displaced using
PEG amine. Deprotection of the tert-butyl groups proved problematic; NMR
II. A similar method to attempt I was explored using non-protected tris-acid DOTA
azide; however solubility of the non-protected azide limited the reaction conversion.
III. In a third method, aqueous copper sulfate CuAAC conditions were applied to react Nb-branch-alkyne PEG3k MM with gadolinium loaded tris-acid DOTA azide. Several aqueous conditions were explored to maximize click conversion, but satisfactory conversion was never obtained.
The most successful strategy for MM formation is outlined in Scheme 2. Using the more soluble tBu-protected DOTA azide allowed for more efficient copper acetate/DCM CuAAC conditions. Copper ligation with tert-butyl protected DOTA in the CuAAC step necessitated the use of a full equivalent of copper. While not ideal, this complication is not synthesis limiting;
DOTA is specifically designed to chelate gadolinium, so any bound copper can be replaced by
heating at 800 C with a large excess of GdCl3.65 Purity of the final Gd-MM is difficult to verify;
the paramagnetism of Gd3+ renders NMR difficult to interpret, MALDI-TOF does not give clean distributions, and HPLC purity is not very trustworthy for PEG-based compounds due to similar elution times. Synthesis of this compound has been performed on small scale and must be scaled up to test polymerization and relaxivity properties.
Conclusions. This chapter describes several synthetic strategies for the synthesis of
gadolinium loaded MRI contrast agents based on branched macromonomers. Gadolinium was coordinated using tris-DOTA, a ligand containing three carboxylic acids known to bind Gd"' ions orders of magnitude more strongly than Cu" ions. Polymerization of this branched
readily soluble in standard solvents for ROMP like THF and DCM. However, ROMP in DMF has not been attempted and should be possible. After successful polymerization, this
macromonomer will be highly useful for MRI tagging of other ROMP polymers.
Experimental Methods. p~ H / 0 OtBu-- 'N Nl'> N 0 H / 0
or
'--N N N , N(,) NO CtN + N NN 1. CuOAc 0 N a 68 N " N ' O'N NN NN 0 01tu 1> 0 tBu a OtBu 2. PEG amine N 0 NH N OtBu
N _
O \- OBu
OtBu
DOTA-tris(tBu) MM. Compound 2 (1.3 mg, 2.6 mmol) was added to a vial with
tris-tBu-DOTA propyl azide (Click Chemistry Tools, 2 mg, 2.8 mmol) and 1 mL dry DCM under N2. A
spatula tip of CuOAc was added and the vial was flushed with N2. After five minutes, LC/MS
analysis of the reaction indicated roughly 50% conversion of 2 to the intermediate
triazole-branch-NHS compound. A second aliquot of CuOAc was added, and the reaction was deemed
complete by LC/MS analysis after 15 minutes. Solid PEG-NH2 (7.7 mg, 2.5 mmol) was then
added to the reaction and the mixture was stirred for 14 h. The entire reaction mixture was dried on a rotary evaporator, redissolved in MeOH (0.7 mL), passed through a 0.4 Li m Nylon syringe filter, and subjected to prep-HPLC. The pure fractions containing tBu-DOTA MM were condensed with a rotary evaporator. The resulting residue was dissolved in dichloromethane
(DCM), dried over Na2SO4, condensed on a rotary evaporator, and dried overnight under vacuum
/ > o H / 0 H N N N O H O N N O)6 N 68 30% TFA N 0 68 N CHC13 N N NH NOtBNH N N N N O 0, -J \_ OBu H OtBu OH
DOTA-tris(acid) MM. tBu-DOTA MM was dissolved in 3 mL of dry chloroform.
Trifluoroacetic acid (1 mL) was added, and the reaction was stirred for two hours at room temperature. 5 mL of water was added and the pH was adjusted to 4 with saturated sodium bicarbonate solution, then extracted four times with 20 mL DCM. Extracts were dried over sodium sulfate, condensed on a rotary evaporator, and precipitated into cold diethyl ether. Precipitate was filtered and dried overnight under vacuum, yielding a pale blue powder. 'H NMR is shown below. '00 H SN 0 68 N 0 N\ OH NH N H N N O NOH OH '0 0 H 0 N O 68 GdC N 0 pH NH N 00 0 O
Gd MM. To coordinate gadolinium and displace any bound copper, DOTA MM was dissolved
in 4 mL of Millipore water along with 20 equivalents of GdCl3. The pH was adjusted to 7 using
IM sodium hydroxide. The reaction was stirred at 70' C for 8 hours, readjusting the pH to 7 every two hours. To remove excess GdCl3, the solution was basified to pH 10 and filtered
through a 0.44 ptM syringe filter. The resulting filtrate was extracted four times with 10 mL of
DCM. Extracts were dried over sodium sulfate, condensed on a rotary evaporator, and
precipitated into cold diethyl ether. Precipitate was filtered and dried overnight under vacuum, resulting in a white powder. Note: this MM was not purified by preparatory HPLC, which would be recommended before ROMP.
Spectral Data.
75 -7.0 6.5 6.0 S.T A rs 4S 4.0 3 5 3.0 2.5 20 15 1.0 0.5 0.0
T
I
0 7-5 7-0 6.5 6.0 5.5 5.0 4.5 4.0 3.5 f(PPM) DI i C"0C U,-r
-CR
3.0 2.5 2.0 T 1.5 1.0 0.5 0.0 DOTA-tris(acid) MM H NMR (400 MHz, CDCl3, r.t.)Chapter 11. Surface functionalization for targeting and cellular internalization
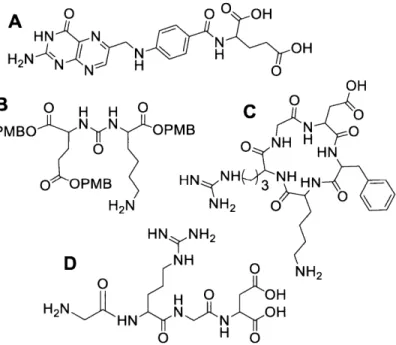
Introduction. A natural extension of the previously described research in polymers for
imaging is the incorporation of targeting moieties for tissue/cell-selective imaging. Many previously developed ligands and peptides are known to selectively traffic to tumor cells,
including prostate-specific membrane antigen (PSMA),66-68 RGD peptides, 69'70 and folic acid.7172
When combined with the EPR effect,73'74 active targeting and increased cellular internalization rates could appreciably affect a delivery system's pharmacodyamic and pharmacokinetic
T