fondation pour les études et recherches sur le développement international
LA FERDI EST UNE FOND
ATION REC ONNUE D ’UTILITÉ PUBLIQUE . ELLE ME T EN ŒUVRE A VEC L ’IDDRI L ’INITIA TIVE POUR LE DÉ VEL OPPEMENT E
T LA GOUVERNANCE MONDIALE (IDGM).
ELLE C
OORDONNE LE LABEX IDGM+ QUI L
’ASSOCIE A U CERDI E T À L ’IDDRI. CE TTE PUBLIC ATION A BÉNÉFICIÉ D ’UNE AIDE DE L ’É TA T FR ANC AIS GÉRÉE P AR L ’ANR A U TITRE DU PR OGR A MME «INVESTISSEMENT S D ’A VENIR» POR
TANT LA RÉFÉRENCE «ANR-10-LABX
-14-01».
Financial constraints, factor
combination and Gibrat’s law in
Africa
Florian Léon | Samuel Monteiro
Florian Léon, Research officer, FERDI. florian.leon1@ferdi.fr
Samuel Monteiro, Environnement Social Gouvernance and Impact Manager, Investisseurs & Partenaires. s.monteiro@ietp.com
Abstract
This paper investigates the validity of Gibrat’s law in sub-Saharan Africa using data from 22,495 firms operating in 45 African countries. Results indicate that Gibrat’s law does not hold in Africa, i.e. small firms create more jobs than their larger counterparts do. We point out that the usual explanations (such as diminishing returns, the learning process, and the minimum efficient size) do not explain this finding. We present a new explanation based on firm access to capital. According to our hypothesis, employment growth among small firms in Africa is faster because small firms adopt labor-intensive and capital-saving technology to expand their business activities. SMEs have a lower capital-labor factor because in order to grow, they tend to overuse labor and underuse capital due to financial constraints., hence their greater job growth momentum. Different econometric tests provide support to our hypothesis. Specifically, we prove that the negative relationship between firm size and growth is mitigated for firms with access to credit.
Key words: Firm growth ; Job creation ; Gibrat’s law ; Africa; financial constraint. JEL Classification: L11 ; L26 ; O55.
Dev
elopment Po
lic
ie
s
W
ork
ing Paper
260
December 2019“Sur quoi la fondera-t-il l’économie du monde qu’il veut
gouverner? Sera-ce sur le caprice de chaque particulier? Quelle
confusion! Sera-ce sur la justice? Il l’ignore.”
Ferdi P260 / Léon, F. and Monteiro, S. >> Financial constraints, factor combination… 1 1. Introduction
One of the most prominent challenges for sub-Saharan African countries in the 21st century is to absorb
the rapid growth of the active workforce by providing sufficient jobs. As stated by McKinsey, over the next ten years Africa is expected to create 54 million new jobs over the next ten year following the current trends, a figure that will be insufficient to absorb the 122 million new entrants into the labor force expected over the same period. Therefore understanding which firms create the most jobs is crucial for both academics and policymakers. To shed light on this question, we investigate the relationship between firm size and job creation in sub-Saharan African countries. We show that Small and Medium Enterprises (SMEs) create more jobs than large firms do and explain this finding by a combination of production factors that overuse labor due to lack of access to capital.
In 1931, Robert Gibrat stated that firm growth is independent of initial size, after observing firm distribution in French manufacturing establishments. Gibrat’s law has since been tested widely in both developed and developing countries (see Daunfeld and Elert, 2013; Aga et al., 2015). Econometric results often indicate that small firms are the main contributors to net job growth, especially in developing countries (Ayyagari et al., 2014; Rijkers et al., 2014; Aga et al., 2017), in contradiction to Gibrat’s law. However, recent studies have challenged the validity of this conclusion (Lotti et al., 2009; Haltiwanger et al., 2013). Evidence from Africa is rather scarce and results are mixed.
Our paper adds to the existing literature on firm growth and private sector development in sub-Saharan Africa. First, while Gibrat’s law has often been tested, to our knowledge there are no studies based exclusively on African firms from different countries and different sectors. To fill the gap in the literature, we test whether Gibrat’s law is valid in sub-Saharan Africa using firm-level variables from the World Bank Group’s EnterpriseSurveys (henceforth ES). We consider 22,945 firms from 45 African countries over the period 2006-2016. We rely on existing literature to provide an empirical test of Gibrat’s law (Lotti et al., 2009; Daunfeld and Elert, 2013; Haltiwanger et al., 2013) and document that small firms grow faster than larger firms do.
Second, despite a burgeoning body of literature, explanations for the rejection of Gibrat’s law are rarely investigated (one notable exception is Daunfeld and Elert, 2013). We first show that the usual explanations advanced in the literature (the mechanical effect, the learning process or the minimum efficient size) are irrelevant in our case. We therefore propose a new channel to shed light on our econometric results. We argue that SMEs use a different combination of production factors than their larger counterparts,
Ferdi P260 / Léon, F. and Monteiro, S. >> Financial constraints, factor combination… 2 regardless of the sector. Suppose that a firm employs only capital and labor to produce an output. In the absence of access to capital, SMEs tend to overuse laborbecause of lack of access to capital. Since SMEs in Africa are more financially constrained than larger firms, they cannot employ capital to the extent that they otherwise would (Beck et al., 2005). As a result, they tend to underuse capital and overuse labor in order to grow, resulting in a lower capital-labor factor and greater job growth momentum. We empirically test this possible explanation. First, we show that the negative relationship between firm size and firmgrowth is more than two times larger for financially constrained firms as for unconstrained firms. In other words, financially constrained firms create more jobs more quickly than non-constrained firms. This finding is robust to several measures of financial access. Second, we document that the capital-labor ratio is lower for both small firms and for constrained firms, in line with our hypothesis. To summarize, we first argue that financially constrained firms create more jobs, then show that SMEs are more financially constrained to explain the stronger job creation of SMEs over their larger counterparts.
The article is organized as follows. Section 2 discusses the existing literature on Gibrat’s law, drawing special attention to works on African firms and to explanations of the law’s rejection in Africa. Section 3 presents our baseline results, indicating a rejection of Gibrat’s law. Section 4 displays the potential factors that could explain this rejection, developing an original explanation based on credit constraints, input access and factor combination. The final section concludes.
2. Literature review
2.1. Empirical tests of Gibrat’s law
By considering the size of French firms in terms of employees, Robert Gibrat (1931) showed that growth rates follow a lognormal distribution, creating the eponymous Gibrat’s law (also called the law of proportionate effect). This law states that the growth rate of a given firm is independent of its initial size (Sutton, 1997). Researchers have attempted to verify the validity of Gibrat’s law with, so far at least, highly divergent results (see Daunfeld and Elert, 2013; Aga et al., 2017). Most of the research has focused on developed economies. One may question whether the experience of industrialized economies can be generalized to developing countries, especially lesser developed countries such as many in Africa. Small firms are predominant in low-income countries (Ayyagari et al., 2014; Aga et al., 2017). Thus, it is of interest to extend the existing literature to the specific case of African countries.
Studies on Gibrat’s law in sub-Saharan Africa are rather scarce and provide mixed results. Cross-country evidence often supports the rejection of Gibrat’s law (Ayyagari et al., 2014; Aga et al., 2017). However,
Ferdi P260 / Léon, F. and Monteiro, S. >> Financial constraints, factor combination… 3 country-specific studies are less clear-cut. While some (Teal, 1999; Biggs and Saha, 2003; Bigsten et al., 2007) indicate that SMEs are the main contributors to net job growth, other papers fail to confirm this relationship (Page and Soderbom, 2012; Arrow et al. 2014).
2.2. Explanations advanced to justify the rejection of Gibrat’s law
Divergences can be justified by differences in methodology and samples considered. Alongside endogeneity, measurement and selection issues (Haltiwanger et al., 2013), results from empirical papers may be conditional to the econometric specifications used. In particular, results are sensitive to the inclusion of firm age (Haltiwanger et al., 2013). The rejection of Gibrat’s law can be justified by the learning effect. Jovanovic (1982) provides an explanation for higher growth of small and young firms. Firms begin learning about their efficiency once they are established. Because least efficient firms are forced out of the market, more efficient managers can adjust their business accordingly and gain market shares. Hence, young firms grow faster by discovering their efficiency level, but there is no reason to believe that size matters. However, insofar as size and age are strongly related, regressing firm growth on firm size without considering firm age induces bias. Yet, from the approximately 60 papers taken into account by Santarelli et al. (2006), only a third control for age. Haltiwanger et al. (2013) show that net employment growth rates are higher for smaller firms, but this negative relationship disappears after controlling for firm age in the U.S. Lotti et al. (2009) provide additional evidence in line with this argument. In the case of Côte d’Ivoire, Sleuwaegen and Goedhyus (2002) show that the effect of firm size is attenuated for older firms. Differences in findings can be explained not only by differences in methods but also by different samples considered. In particular, several papers have argued that Gibrat’s law holds in some sectors but not in
others.1 This theoretical intuition is based on the minimum efficient size required to operate (Manfield,
1962; Cabral, 1995). According to this hypothesis, small entrants have to grow quickly to attain the minimum efficient size or must exit. We therefore observe that small firms grow faster than firms having already attained the minimum efficient size. As a result, Gibrat’s law is more likely to hold in the services sector than in manufacturing, due to differences in sunk costs. Empirical papers give support to this explanation (Audretsch et al., 2004; Teruel-Carrizosa, 2010; Nassar et al., 2014).
1 Daunfeld and Elert (2010) present additional arguments to explain why Gibrat’s law may hold in some sectors but not in others. These explanations are based on degree of competition, of uncertainty, and of innovation, the age of the sector or the survival rate in the industry.
Ferdi P260 / Léon, F. and Monteiro, S. >> Financial constraints, factor combination… 4 2.3. Credit constraints and job creation
In this paper, we advance another possible explanation based on the idea that the lack of credit access may distort factor combination and favor labor-extensive technology. While the relationship between financial constraints,capital structure choices and capital investments has been studied extensively, little is known about the role that financial constraints play in job creation. On the one hand, facilitating access to financing makes it possible to increase investments in capital, which can result in a greater demand for labor because labor and capital are complements. Moreover, labor has fixed costs (hiring costs, training, paying wages) so that easing financial constraints can stimulate employment. From this perspective, labor, similar to capital, needs to be financed. Some papers thus show that increased access to finance results in higher employment growth, especially among SMEs (Ayyagari et. al., 2017; Dao and Liu, 2017; Boustanifar, 2014; Benmelech et al., 2011). On the other hand, easing financial constraints may allow firms to optimally substitute capital for labor by moving towards a more capital intensive production process. Access to finance will therefore play a key role in the capital-labor ratio because constrained firms, by definition, cannot optimally invest in capital. Indeed, a financially constrained firm will not be able to borrow the funds for capital investment and might partially satisfy the demand for growth by hiring more labor. A rare point of reference is Garmaise (2008), who shows that financially restricted firms use relatively more labor than physical capital. Our study adds to this growing body of literature in the area of labor and finance by examining the linkages between firm financing and job creation.
3. Do African SMEs grow faster than their counterparts ? 3.1 Methodology
3.1.1. Econometric model
To test Gibrat’s law, we follow the existing literature (Lotti et al., 2009; Daunfeld and Elert, 2013). The basic test of Gibrat’s law related the (logarithm) of previous size on the (logarithm) actual size as follows:
𝑙𝑛𝑆𝑖𝑡 = 𝛼 + 𝛾𝑙𝑛𝑆𝑖𝑡−1+ 𝜀𝑖𝑡 (1)
where 𝑆𝑖,𝑡 is the size of firm i at time t, 𝑆𝑖,𝑡−1 the same size in the previous period and 𝜀𝑖,𝑡 is a random
variable. As stated by Chesher (1979), Gibrat’s law holds if 𝛾̂ equals unity. By contrast, if 𝛾̂ < 1, small firms grow at a systemically higher rate than do their larger counterparts (the opposite is true if 𝛾̂ > 1).
Ferdi P260 / Léon, F. and Monteiro, S. >> Financial constraints, factor combination… 5 To make interpretation easier, we follow Lotti et al. (2009) and regress the growth of employment size on firm size. In addition, to control for unobserved country- and sector heterogeneity, as well as individual characteristics, we estimate the following equation:
𝑔𝑖,𝑡/𝑡−1= 𝛼𝑐𝑡+ 𝛼𝑠𝑡+ 𝛽𝑙𝑛𝑆𝑖𝑡/𝑡−1+ 𝛿𝑙𝑛𝐴𝑖+ ∇𝑿𝑖+ 𝜀𝑖𝑡 (2)
where i, c, s, and t refer to firm i in country c in sector s, at period t. 𝑔𝑖,𝑡/𝑡−1 is the annual growth of a firm’s
size from t-1 to t, and 𝑆𝑖𝑡/𝑡−1 the (average) firm’s size. 𝛼𝑐,𝑡 is a list of country-year dummies and 𝛼𝑠,𝑡 a list
of sector-year dummies. 𝐴𝑖 is the logarithm of the age of firm i at the time of the survey. We add a set of
firm-level variables (𝑿𝑖) to control for observable firm-level heterogeneity. The list of firm-level control
variables includes the experience of the manager, a dummy if the firm is an exporter, a dummy if a firm is part of a larger firm, a dummy for foreign-owned firms, a dummy for state-owned firms, a dummy if the
firm is privately-held and a dummy for listed firms. The coefficient of interest is 𝛽 = (𝛾 − 1).2 Gibrat’s
law holds if 𝛽̂ = 0 (𝛾̂ = 1). Small firms grow faster if 𝛽̂ < 0 and large firms grow faster if the estimated β is positive. We also expect that firm age has a negative impact on firm growth, so we expect that 𝛿̂ < 0.
3.1.2 Data and variables
Firm-level data were extracted from the World Bank Enterprise Surveys (ES), which include a variety of firm-level information, such as number of employees, total sales, ownership structure, industry, and age of the firm, etc.. An advantage of ES is their coverage of firms of all sizes in many developing countries, contrary to other databases (such as ORBIS). ES were retrieved in October 2017. Some filter rules are applied. First, we consider only firms based in sub-Saharan Africa. Second, firms for which dependent variables were not available and for which at least one of the firm-level control variables was missing were
dropped. Third, we remove outliers (firms for which growth is below the first percentile or above the 99th
percentile). In addition, we exclude firms whose size exceeds 1,000 employees or whose age is over one century. Finally, we excluded observations when the interviewer did not believe that the responses were reliable (question a16 in the ES). Our final sample includes 22,495 firms from 45 African countries (73 surveys). The number of firms per country is provided in Table A1 in the Appendix.
2 To prove this, we simply change the annual growth as difference in the logarithm as follows: 𝑔𝑖,𝑡/𝑡−1= 𝑙𝑛𝑆
𝑖𝑡−
Ferdi P260 / Léon, F. and Monteiro, S. >> Financial constraints, factor combination… 6
3.1.3 Variables
We employ the number of employees to compute a firm’s growth. In doing so, we use data on the number of employees in the year before the survey and three-years before the survey. The number of employees refers to permanent and full-time workers (questions l1 and l2 in the ES). To avoid the regression-to-the-mean effect (Davis et al., 1996; Haltiwanger et al., 2013), growth of employment refers to the change of the variable during the period t and three years before, divided by the firm's simple variable average during the same period (instead of using the initial value).
All independent variables are extracted from the Enterprise Surveys3. Our main interest variable is the size
of firm i. Gibrat’s law provides a relationship between a firm’s size and its subsequent growth. The firm size is based on the number of employees. A simple way to compute a firm’s size consists of using the number of total employees in the beginning of the period. However, the regression-to-the-mean problem may occur when we rely on initial size (Davis et al., 1996). Employing initial size may induce a biased relationship between firm size and subsequent growth. We therefore follow recent works (e.g., Haltiwanger et al., 2013) and use the average size over the period by using the average between the initial size and final size.
Haltiwanger et al (2013) also point out that the negative relationship between size and growth vanishes when controlling for firm age in the U.S. We therefore control for firm age by using the time lapse between firm creation (question b5 in the ES) and year of the survey. In line with recent works, using ES (e.g., Beck et al., 2005; Harrison et al., 2014), we add usual firm-controls that correct for firm heterogeneity. We include the top manager’s years of experience in the sector. We also consider dummy variables capturing whether the firm is an exporter, foreign-owned, or government-owned and if the firm belongs to a larger firm, is privately held or is listed.
3.2. Results
3.2.1. Descriptive statistics
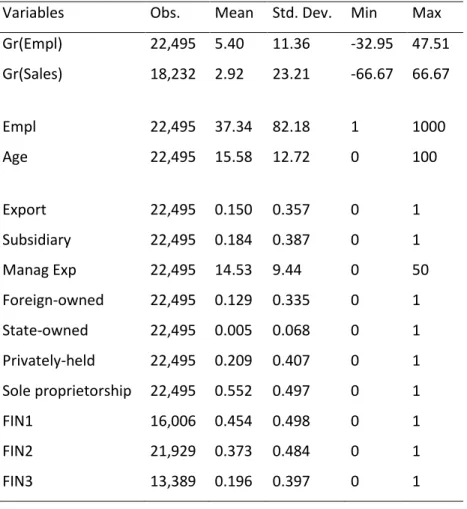
Table 1 displays basic descriptive statistics. On average, firms experienced a positive growth in employment. However, there are hidden variations in growth. For instance, one quarter of firms destroyed employment while another quarter witnessed employment growth over 10 percent.
Ferdi P260 / Léon, F. and Monteiro, S. >> Financial constraints, factor combination… 7 Firms retained in our sample have 37 employees on average. However, this figure is driven by outliers, as documented in Figure A1. The median average size is 12 employees, and more than three quarters of firms have less than 30 employees. Table 1 also indicates that firm age is on average 15 years. In addition, 15% of firms are exporters, 18% are part of a larger group and 12% are foreign-owned (the number of state-owned firms is marginal and concerns less than 1% of firms). The definition of all variables is reported in Table A2.
Table 1: Descriptive statistics
Variables Obs. Mean Std. Dev. Min Max
Gr(Empl) 22,495 5.40 11.36 -32.95 47.51 Gr(Sales) 18,232 2.92 23.21 -66.67 66.67 Empl 22,495 37.34 82.18 1 1000 Age 22,495 15.58 12.72 0 100 Export 22,495 0.150 0.357 0 1 Subsidiary 22,495 0.184 0.387 0 1 Manag Exp 22,495 14.53 9.44 0 50 Foreign-owned 22,495 0.129 0.335 0 1 State-owned 22,495 0.005 0.068 0 1 Privately-held 22,495 0.209 0.407 0 1 Sole proprietorship 22,495 0.552 0.497 0 1 FIN1 16,006 0.454 0.498 0 1 FIN2 21,929 0.373 0.484 0 1 FIN3 13,389 0.196 0.397 0 1
In Figures 1 and 2, we show that firm growth is negatively correlated with firm’size, as expected (results are unchanged when we consider initial size). Small firms have created 8.7 jobs on average over the last three years prior to the survey, a rate that is more than four times the growth of employment in large firms (only 2 jobs created on average). Moreover, while only 7% of small firms have experienced job destruction, more than a quarter of large firms have experienced negative employment growth.
Ferdi P260 / Léon, F. and Monteiro, S. >> Financial constraints, factor combination… 8 Figure 1: Relationship between firm size and firm growth
(a) Growth of employment
(b) Growth of sales -2 0 0 20 40 Em p lo yme n t g ro w th
1- Small (< 10 empl.) 2- Medium (btw 10 and 50 empl.) 3- Large (> 50 empl.)
-4 0 -2 0 0 20 40 Sa le s g ro w th
Ferdi P260 / Léon, F. and Monteiro, S. >> Financial constraints, factor combination… 9 Figure 2: Relationship between firm size and firm growth
3.2.2. Baseline results
In Table 2 we report the baseline model testing the relevance of Gibrat’s law in Africa using Eq. 2. In column 1, we report the model without control variables, sector or country dummies. We then include control variable in column (2), country-year dummies in column (3) and sector-year dummies in column (4). In column (5), we report the complete specification.
Our findings, displayed in Table 2, provide strong evidence in favor of rejection of Gibrat’s law. The coefficients associated with average size are negative and highly significant in all specifications. The impact of size is also economically significant. When the number of employees doubles, growth is reduced by 0.7 points, representing more than 10% of average employment growth. It should be noted that young firms grow faster than their older counterparts. In addition, the impact of age is particularly strong in economic terms. An additional year reduces employment growth by almost 2 points. Among our control variables, we show that growth is stronger for exporters, subsidiaries, firms with experienced managers, foreign-owned, state-owned and privately held firms.
0 1 2 3 4 5 6 7 8 9 10
Empl gr. (avg) Empl gr. (median) Sales gr. (avg) Sales gr. (median)
Ferdi P260 / Léon, F. and Monteiro, S. >> Financial constraints, factor combination… 10 Table 2: Baseline results, employment growth
(1) (2) (3) (4) (5) ln(Emplinitial) -0.677*** -0.701*** -0.782*** -0.715*** -0.757*** (-10.06) (-9.24) (-10.24) (-9.14) (-9.61) ln(Age) -3.257*** -3.204*** -2.618*** -2.719*** -2.647*** (-26.21) (-22.58) (-18.39) (-19.00) (-18.49) Export 0.198 0.450** 0.412* 0.421* (0.90) (2.04) (1.85) (1.87) Subsidiary 0.174 0.539*** 0.591*** 0.539*** (0.89) (2.72) (3.01) (2.71) Manag -0.00953 0.0129 0.00836 0.0126 (-1.05) (1.41) (0.91) (1.36) Foreign-owned 0.149 0.0575 0.243 0.0486 (0.66) (0.25) (1.07) (0.21) State-owned 0.901 0.266 0.678 0.402 (0.83) (0.25) (0.63) (0.37) Privately held 1.935*** 0.0777 0.0955 0.0543 (8.85) (0.33) (0.42) (0.23) Sole proprietorship 1.198*** 0.212 0.316 0.179 (6.21) (1.08) (1.64) (0.91) Dummy
- Country#year No No Yes No Yes
- Sector#year No No No Yes Yes
Obs. 22495 22495 22495 22495 22495
Adj. R2 0.049 0.052 0.112 0.098 0.115
The dependent variable is the annual growth of employment. Robust t-statistics are reported in parentheses. *, **, *** indicate significance at 10%, 5%, and 1%, respectively.
Ferdi P260 / Léon, F. and Monteiro, S. >> Financial constraints, factor combination… 11 To summarize, our baseline regressions indicate that Gibrat’s law can be rejected in models that explain employment growth. In other words, SMEs appear to have a stronger employment dynamic than large firms.
3.2.3. Robustness checks
First, we change measures of dependent variables (growth) and interest variables (firm size). In the baseline model, to avoid the regression-to-the-mean bias (see Section 3), we employ average growth and firm size growth. In our robustness check, we consider usual measures of growth (based on initial size) and initial size instead of average firm size. Our results, unreported but available upon request, indicate that our conclusions are not altered by these changes.
Second, we also confirm that our findings are not altered by the method retained to correct standard errors. Using clustered standard errors at the country-year or sector-year level provides similar results. Only statistical significance of control variables are affected by this change.
Third, to test whether our findings are sensitive to the inclusion of one country or one sector, we apply the baseline model by excluding each country and sector one by one. Once again, our econometric results are unchanged: size has a negative effect on a firm’s employment growth but not on its sales growth. Next, we present an explanation for this paradox. Before we do so, we show that the usual suspects cannot help us to explain this puzzle.
Why do African SMEs create more jobs? Our paper not only tests whether Gibrat’s law is valid for African firms but also tries to understand why it appears not to be. There are three possible suspects for this rejection: diminishing returns, the learning process (Jovanovic, 1982) and the minimum efficient size (Manfield, 1962; Cabral, 1995). However, these three possible explanations do not fully explain why African SMEs create more jobs than their larger counterparts. Nonetheless, we provide additional tests to prove that our results cannot be explained by these three factors.
To test the diminishing returns hypothesis, we merely consider the growth based on sales. If a mechanical process explains the rejection of Gibrat’s law, we should observe a similar result when we consider alternative measures of growth (e.g., sales growth). Total annual sales refers to a firm's declaration regarding its activity in the previous year (question d2) and three years before (question n3). Sales values have been deflated using the same base year (100 = 2010) and the country's GDP deflators from the World Development Indicators (WDI). Growth of sales refers to the change of the variable during the period t
Ferdi P260 / Léon, F. and Monteiro, S. >> Financial constraints, factor combination… 12 and three years before, divided by the firm's simple average of variable during the same period (instead of using the initial value) in order to avoid the regression-to-the-mean effect (Davis et al., 1996; Haltiwanger et al., 2013). In Table 3, we consider the sales growth as dependent variable. While age continues to play a role in explaining sales growth , the impact of size is less clear-cut. Indeed, coefficients associated with size are only negative and statistically significant in column 4. In addition, if we ignore statistical significance, we observe that the impact of size is also economically reduced. An increase of a firm’s size by six employees reduces sales growth by 0.35 points (around 10 percent of its average). In other words, the negative relationship between firm size and firm growth holds for employment growth but vanishes when we consider sales growth. The rejection of Gibrat’s law is less clear-cut when we consider sales growth, suggesting that the employment dynamic is not solely explained by sales momentum.
Ferdi P260 / Léon, F. and Monteiro, S. >> Financial constraints, factor combination… 13 Table 3: Baseline results, sales growth
(1) (2) (3) (4) (5) ln(Emplinitial) 0.275* 0.00524 -0.282 -0.339* -0.229 (1.71) (0.03) (-1.55) (-1.77) (-1.22) ln(Age) -3.040*** -3.406*** -2.357*** -2.902*** -2.443*** (-10.44) (-10.06) (-7.36) (-8.75) (-7.59) Export -1.113** 1.504*** 0.541 1.323** (-2.02) (2.81) (0.99) (2.45) Subsidiary 0.344 -0.268 0.0220 -0.427 (0.71) (-0.55) (0.05) (-0.88) Manag 0.0507** 0.0340 0.0456** 0.0346* (2.35) (1.63) (2.14) (1.65) Foreign-owned 1.935*** 0.628 1.261** 0.629 (3.65) (1.19) (2.40) (1.20) State-owned 1.863 0.938 2.376 1.829 (0.58) (0.31) (0.78) (0.62) Privately held 2.182*** -0.220 0.396 -0.257 (4.22) (-0.42) (0.74) (-0.49) Sole proprietorship 0.197 -0.143 -0.208 -0.170 (0.40) (-0.30) (-0.43) (-0.36) Dummy
- Country#year No No Yes No Yes
- Sector#year No No No Yes Yes
Obs. 18232 18232 18232 18232 18232
Adj. R2 0.006 0.009 0.130 0.073 0.135
The dependent variable is the annual growth of sales (in constant US$). Robust t-statistics are reported in parentheses. *, **, *** indicate significance at 10%, 5%, and 1%, respectively
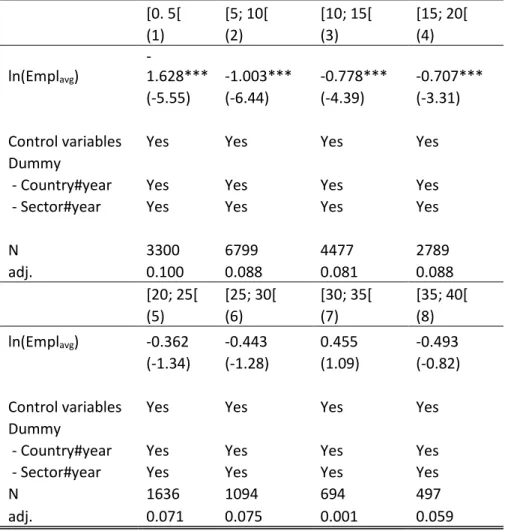
Ferdi P260 / Léon, F. and Monteiro, S. >> Financial constraints, factor combination… 14 We then investigate in Table 4 whether the relationship between firm size and firm growth is explained by the learning effect. We run our baseline model for firms of different ages (by 5-year windows). We confirm the findings obtained in previous articles (e.g., Sleuwaegen and Goedhyus, 2002) indicating that the rejection of Gibrat’s law is stronger for young firms. In particular, for firms older than 20 years, the negative relationship between firm size and employment growth vanishes. However, the learning effect hypothesis does not provide clear arguments to justify why there is an absence of impact of firm size on sales growth but a negative impact on employment growth.
Table 4: Testing Gibrat’s law by age group
[0. 5[ [5; 10[ [10; 15[ [15; 20[ (1) (2) (3) (4) ln(Emplavg) -1.628*** -1.003*** -0.778*** -0.707*** (-5.55) (-6.44) (-4.39) (-3.31)
Control variables Yes Yes Yes Yes
Dummy
- Country#year Yes Yes Yes Yes
- Sector#year Yes Yes Yes Yes
N 3300 6799 4477 2789 adj. 0.100 0.088 0.081 0.088 [20; 25[ [25; 30[ [30; 35[ [35; 40[ (5) (6) (7) (8) ln(Emplavg) -0.362 -0.443 0.455 -0.493 (-1.34) (-1.28) (1.09) (-0.82)
Control variables Yes Yes Yes Yes
Dummy
- Country#year Yes Yes Yes Yes
- Sector#year Yes Yes Yes Yes
N 1636 1094 694 497
adj. 0.071 0.075 0.001 0.059
The dependent variable is the annual growth of employment. Robust t-statistics are reported in parentheses. *, **, *** indicate significance at 10%, 5%, and 1%, respectively.
Ferdi P260 / Léon, F. and Monteiro, S. >> Financial constraints, factor combination… 15 A third explanation often advanced in the literature refers to sunk costs, i.e., costs that cannot be recovered if a firm goes bankrupt, and minimum efficient size. SMEs that invest less in the first period must rapidly adjust their capabilities to their optimum level. SMEs will thus have a higher growth rate in the first period. If this explanation is true, Gibrat’s law should hold in a sector where sunk costs are law (as in the services sectors) but should be rejected when sunk costs are high (as in the manufacturing sectors). Yet, in the case of African countries, we can show that Gibrat’s law holds for every sector. Indeed, we distinguish between firms inmanufacturing and firms in the services sector in order to test the role of minimum efficient scale (Teruel-Carrizosa, 2010). Using sub-sample analysis and interaction between firm size and a dummy for manufacturing firms, we have not found any difference in the relationship between firm size and growth for firms in the manufacturing and services sectors (Table 5).
Ferdi P260 / Léon, F. and Monteiro, S. >> Financial constraints, factor combination… 16 Table 5: Testing Gibrat’s law, by sector
MANUF. SERV. Inter.
(1) (2) (3)
ln(Emplavg) -0.741*** -0.774*** -0.746***
(-6.67) (-6.81) (-7.00)
ln(Emplavg)*Manufacturing -0.0205
(-0.15) ln(Age) -2.916*** -2.461*** -2.647*** (-13.93) (-12.39) (-18.49) Export 0.616** 0.107 0.425* (2.09) (0.30) (1.88) Subsidiary 0.976*** 0.251 0.538*** (3.26) (0.93) (2.70) Manag -0.00175 0.0282** 0.0125 (-0.13) (2.16) (1.35) Foreign-owned -0.0161 0.0439 0.0486 (-0.05) (0.14) (0.21) State-owned -0.215 0.859 0.400 (-0.14) (0.56) (0.37) Privately held 0.352 -0.234 0.0558 (1.04) (-0.71) (0.24) Sole proprietorship 0.516* -0.154 0.180 (1.76) (-0.58) (0.92) Dummy
- Country#year Yes Yes Yes
- Sector#year Yes Yes Yes
Obs. 10410 12085 22495
Adj. R2 0.126 0.106 0.115
The dependent variable is the growth of employment. Robust t-statistics are reported in parentheses. *, **, *** indicate significance at 10%, 5%, and 1%, respectively
Ferdi P260 / Léon, F. and Monteiro, S. >> Financial constraints, factor combination… 17 To summarize, the three usual suspects for this rejection of Gibrat’s law (diminishing returns, the learning process and minimum efficient size) do not help us understanding the negative relationship between firm size and employment growth. Next, we propose an alternative explanation based on credit constraint and factor combination.
4. Credit constraint, factor combination and rejection of Gibrat’s law
We argue that the negative relationship between firm size and employment growth may be, at least partially, explained by the role of firm size on the optimal factor combination. As stated earlier, small firms face higher financial constraints and limited access to capital. As a consequence, our intuition is that small firms overuse labor in their production process. This hypothesis helps us to explain why Gibrat’s law is rejected when we consider employment growth but not always when we consider sales growth (as shown previously). Below, we propose additional tests in line with our intuition.
4.1. Does credit access shape the firm’s size-growth relationship ?
In this section, we argue that the relationship between firm size and growth can be shaped by a firm’s access to credit. We firstly investigate whether correlations between size and growth are stronger for financially constrained firms than for financially unconstrained firms but only when we consider employment growth. To capture credit constraints, we employ three different frequently used measures based on a subjective evaluation of a firm’s credit constraints and objective credit experience, in line with recent works (e.g., Léon and Weill, 2018). Our three dummies have been built the same way: each dummy takes the value of zero if the firm is financially constrained and one if unconstrained. First, we consider a firm’s subjective evaluation of credit constraints (FIN1). The firms were asked in ES whether finance is an obstacle to their growth (question k30). We create a dummy equal to one if a firm declares that finance is not an obstacle, a minor obstacle, or a moderate obstacle. This dummy equals zero if the manager’s answer indicates that finance is a major or very severe obstacle. Second, we consider a firm as unconstrained if the firm has a loan or an overdraft (questions k7 and k8). We create a dummy equal to one if a firm has a loan and 0 otherwise (FIN2). Contrary to the subjective measure, this variable is based on real credit experience. Third, we consider the firm’s precise credit experience in the past year (questions k16 to k20). Indeed, firms without credit may be credit constrained or maysimply not need a loan for their operations. To control for this aspect, we create a final dummy based on credit experience in the past year (FIN3). This new variable allows us to distinguish between firms without a need for credit and those that are truly credit constrained. A firm is declared as credit constrained if (i) the firm applied for a bank loan but its application was rejected; or, (ii) the firm did not apply because it had been
Ferdi P260 / Léon, F. and Monteiro, S. >> Financial constraints, factor combination… 18 discouraged to do so. Based on the question on credit experience, we built a dummy equal to one for unconstrained firms (applied and received a loan) and 0 for rejected and discouraged firms. We therefore ignore firms that did not apply due to a lack of demand (for more details on data construction, see Léon and Weill, 2018). Descriptive statistics, displayed in Table 1, indicate that between 55% (FIN1) and 80% (FIN3) of firms are credit constrained. In Table A3 in the Appendix, we document that small firms are more credit constrained than medium-size and large firms, irrespective of the measures of financial access considered. Indeed, while more than half of large firms have access to credit (FIN3), only 12% of small firms and 28% of medium-size firms have access to credit.
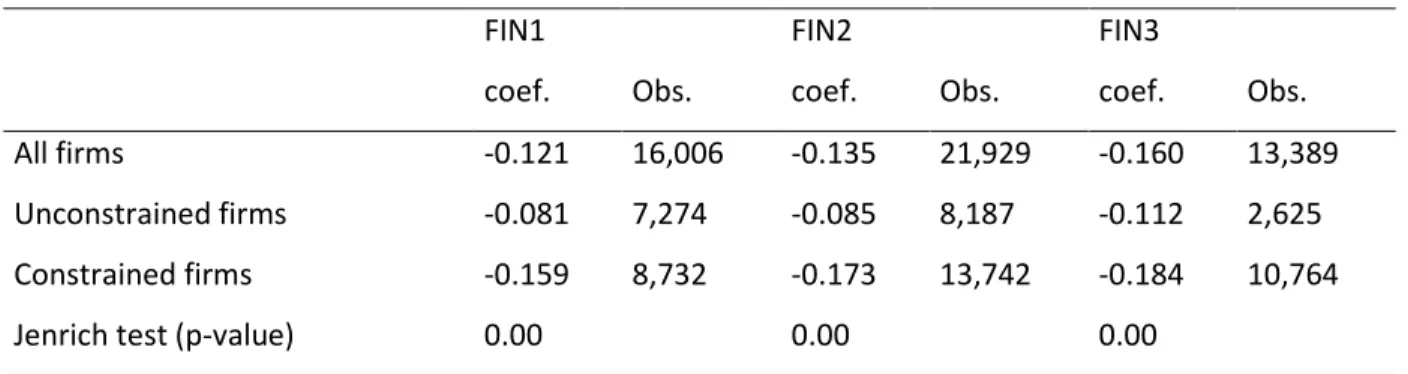
In Table 6, we display the correlation coefficients between firm growth and firm size. We report coefficients for all firms and distinguish between unconstrained firms (FIN=1) and constrained firms (FIN=0). We also report Jenrich’s (1970) test for equality of correlation coefficients between two groups. Our intuition is valid if correlation coefficients are stronger for unconstrained firms but only when we consider employment growth. Statistics and tests reported in Table 6 give support to our hypothesis. We show that correlation coefficients are stronger for constrained firms, irrespective of the measures of credit access considered; the difference is statistically significant at the 1% level. In the next sub-section, we present a more robust analysis.
Table 6: Coefficient correlations between size and growth Employment growth
FIN1 FIN2 FIN3
coef. Obs. coef. Obs. coef. Obs.
All firms -0.121 16,006 -0.135 21,929 -0.160 13,389
Unconstrained firms -0.081 7,274 -0.085 8,187 -0.112 2,625
Constrained firms -0.159 8,732 -0.173 13,742 -0.184 10,764
Jenrich test (p-value) 0.00 0.00 0.00
We then empirically test our hypothesis by adding an interaction in our baseline model, as follows: 𝑔𝑖,𝑡/𝑡−1= 𝛼𝑐𝑡+ 𝛼𝑠𝑡+ 𝛽1𝑙𝑛𝑆𝑖𝑡/𝑡−1+ 𝛽2𝑙𝑛𝑆𝑖𝑡/𝑡−1∗ 𝐹𝐼𝑁𝑖+ 𝜃𝐹𝐼𝑁𝑖+ 𝛿𝑙𝑛𝐴𝑖+ ∇𝑿𝑖+ 𝜀𝑖𝑡 (3)
Ferdi P260 / Léon, F. and Monteiro, S. >> Financial constraints, factor combination… 19
Where 𝐹𝐼𝑁𝑖 is a dummy equal to one if a firm has access to credit and zero if a firm is credit constrained.
As explained above, we employ three different ways to compute 𝐹𝐼𝑁𝑖. Our hypothesis is confirmed if 𝛽1 <
0 and 𝛽2 > 0 when we consider employment growth as the? dependent variable.
Results are displayed in Table 7. In the first three columns, we consider the subjective measures of financial access (FIN1), in columns (4-6) financial access is assessed by the use of loan or overdraft (FIN2) and in the last three columns we consider afirm’s credit experience during the previous year (FIN3) (for details, see Section 3.2.). For each proxy of financial constraint, we firstly display models without measure of financial access and interaction (because the number of observations decreases when we consider different proxies of financial access). We then include each measure of financial access (FIN1, FIN2, and FIN3) and finally we report the model with interaction. Econometric results are in line with our prediction. The coefficients associated with the interaction are positive and highly statistically significant, irrespective of the measures of financial constraints considered (FIN1, FIN2, or FIN3). In addition, in economic terms, we note that the relationship between firm size and employment growth is three times larger for constrained firms than for their unconstrained counterparts. In addition, we underline that unconstrained firms have a higher level of growth.
Ferdi P260 / Léon, F. and Monteiro, S. >> Financial constraints, factor combination… 20 Table 7: Model with interaction between size and financial constraint
FIN1 FIN2 FIN3
(1) (2) (3) (4) (5) (6) (7) (8) (9) ln(Empl) -0.635*** -0.655*** -0.964*** -0.761*** -0.842*** -1.347*** -0.973*** -1.098*** -1.406*** (-6.49) (-6.67) (-7.47) (-9.54) (-10.35) (-12.47) (-8.88) (-9.83) (-10.79) FIN 0.548*** -1.114** 0.903*** -1.949*** 1.615*** -1.370** (2.97) (-2.38) (5.22) (-4.57) (5.91) (-2.05) ln(Empl)*FIN 0.612*** 1.004*** 0.982*** (3.99) (7.55) (5.10)
Control variables Yes Yes Yes Yes Yes Yes Yes Yes Yes
Dummy
- Country#year Yes Yes Yes Yes Yes Yes Yes Yes Yes
- Sector#year Yes Yes Yes Yes Yes Yes Yes Yes Yes
Obs. 16006 16006 16006 21929 21929 21929 13389 13389 13389
Adj R² 0.110 0.111 0.112 0.112 0.113 0.115 0.132 0.134 0.136
The dependent variable is the growth of employment. Control variables as well as country-year and sector-year dummies are included but unreported. Robust t-statistics are reported in parentheses. *, **, *** indicate significance at 10%, 5%, and 1%, respectively.
Ferdi P260 / Léon, F. and Monteiro, S. >> Financial constraints, factor combination… 21 In an unreported analysis (available upon request), we test whether these econometric results are robust to alternative specifications. First, we consider sub-samples instead of an interaction between financial access and firm size. Our conclusions are not altered by this change. In addition, financially constrained firms can be the most dynamic ones. To control for this aspect we add sales growth in models as independent variable (in spite of its endogeneity). Econometric results are largely unchanged.
4.2. Relationship between credit access and capital-labor ratio
According to our hypothesis, we expect that the ratio of capital to labor is lower for constrained firms than for unconstrained firms, hence small firms should have a lower capital to labor ratio because they are more financially constrained. This hypothesis is confirmed by our data: large firms have a capital to labor ratio eighteen times higher than small firms.
To empirically test this prediction, we run the following model:
𝑘/𝑙𝑖,𝑡= 𝛼𝑐𝑡+ 𝛼𝑠𝑡+ 𝛽𝐹𝐼𝑁𝑖𝑡+ ∇𝑿𝑖+ 𝜀𝑖𝑡 (4)
where 𝑘/𝑙𝑖,𝑡 is the ratio of capital to labor for firms i, 𝐹𝐼𝑁𝑖𝑡 is an index of financial access (see above), and
𝑿𝑖 is a matrix of control variables, including the average firm’s size, age, and other control variables
employed above. According to our hypothesis, we expect that 𝛽 > 0, indicating that firms with credit access employed more capital per worker. To compute the capital-labor ratio, we need a measure of capital intensity and of labor intensity. We follow Enterprise Surveys staff (World Bank Group – Enterprise Analysis Unit, 2017) that define a measure of capital and labor in order to assess the total productivity factor. Capital is assessed by the replacement value of machinery, vehicles, and equipment (question n7a) and labor is proxied by the total annual cost of labor (question n2a). Our aim is not to provide a casual analysis but rather to offer some advanced stylized facts between the capital-labor ratio and financial constraints.
Econometric results are displayed in Table 8, where we scrutinize the determinants of the capital-labor ratio. We first report the model without the measure of financial access and then include it. We consider the three measures of financial access presented above. First, it should be noted that we are only able to compute the ratio of capital to labor for less than half of the firms (due to lack of data). Nonetheless, results displayed in Table 7 indicate that firms with access to credit have a higher level of capital per worker. Specifically, coefficients associated with financial access are always positive and statistically significant when we consider the fact that they have a loan (FIN2). Among control variables, we observe that firm size is not related to capital intensity, contrary to firm age or to be a subsidiary.
Ferdi P260 / Léon, F. and Monteiro, S. >> Financial constraints, factor combination… 22 Table 8: Determinants of capital-labor ratio
(1) (2) (3) (4) (5) (6) ln(Empl) -0.199 -0.205 0.0528 -0.0373 -0.473* -0.558** (-0.67) (-0.69) (0.21) (-0.15) (-1.75) (-2.07) ln(Age) 1.419*** 1.421*** 0.541 0.529 0.826* 0.812* (2.62) (2.62) (1.26) (1.23) (1.80) (1.77) Export -0.152 -0.157 -0.480 -0.543 -0.326 -0.424 (-0.21) (-0.22) (-0.84) (-0.95) (-0.47) (-0.61) Subsidiary 1.226 1.217 1.674*** 1.643*** 1.944** 1.903** (1.56) (1.55) (2.66) (2.61) (2.24) (2.19) Manag -0.0255 -0.0256 -0.00268 -0.00203 -0.0165 -0.0165 (-0.78) (-0.79) (-0.10) (-0.08) (-0.51) (-0.51) Foreign-owned 0.931 0.925 0.651 0.674 1.572* 1.600* (1.12) (1.11) (0.99) (1.03) (1.85) (1.88) State-owned 7.658 7.666 5.349 5.429 4.654 4.783 (1.02) (1.02) (1.03) (1.04) (1.02) (1.05) Privately held -0.0345 -0.0422 0.351 0.282 0.102 0.0578 (-0.04) (-0.05) (0.53) (0.43) (0.14) (0.08) Sole proprietorship -1.134 -1.133 -0.752 -0.705 -1.222* -1.196 (-1.41) (-1.41) (-1.14) (-1.07) (-1.66) (-1.62) FIN1 0.168 (0.33) FIN2 0.988** (2.09) FIN3 0.994 (1.35) Obs. 4913 4913 7285 7285 4870 4870 Adj R² 0.051 0.051 0.066 0.066 0.069 0.069
The dependent variable is the ratio of capital to labor. FIN1, FIN2, and FIN3 take value one for unconstrained firms and 0 for constrained firms. Robust t-statistics are reported in parentheses. *, **, *** indicate significance at 10%, 5%, and 1%, respectively.
Ferdi P260 / Léon, F. and Monteiro, S. >> Financial constraints, factor combination… 23 5. Conclusion
Using a database of over 22,000 firms from 45 African countries over the period 2006-2016, our results indicate a strong link between firm size and employment growth. The rejection of Gibrat’s law in Africa implies that SMEs create more jobs than their larger counterparts do. These findings appear to be of particular interest and make an important contribution to the literature on firm growth. To date, most of the research has focused on developed economies, with a particular emphasis on the United States. One may legitimately question to what extent the American experience generalizes to other economies, especially less developed countries such as African countries. We provide evidence on this issue using Enterprise Surveys data covering a broad range of sub-Saharan African countries in various sectors including both the manufacturing and services sectors.
While the literature would explain this finding by either diminishing returns, the learning process or minimum efficient size, we show that these factors are irrelevant. We propose a new channel to shed light on our econometric results. We argue that SMEs use a different combination of production factors , regardless of the sector. SMEs tend to overuse labor because of a lack of access to capital. Indeed, small firms are more financially constrained and therefore cannot employ capital as they would like. As a result, SMEs have a lower capital-labor factor because they tend to underuse capital and overuse labor to grow hence their greater job growth momentum. Different econometric tests provide support to our hypothesis. Specifically, we prove that the negative relationship between firm size and growth is more than two times greater for financially constrained firms than for unconstrained firms. This finding is robust to several measures of financial access. We then document that the capital-labor ratio is smaller for small firms and for constrained firms, in line with our hypothesis.
These results have strong implications for African countries. Because small businesses are at the heart of job creation in Africa, fostering the emergence of small businesses must be a top priority In order to provide job opportunities to all Africans in the workforce this raises the question of financial support for small businesses. Ironically, providing financing to small businesses to allow them to grow could slow down their job creation dynamics. Relieving their financial constraint, may encourage their use of capital to the detriment of labor. On the other hand, our study does not take productivity gain and survival probability into account. Providing SMEs greater access to financing might also enable them to survive and stay on the market. Further research is still needed to better understand the consequences of providing SMEs access to funding at a more aggregated level.
Ferdi P260 / Léon, F. and Monteiro, S. >> Financial constraints, factor combination… 24 References
Aga, G., D. C. Francis, and J. R. Meza (2015), “SMEs, age, and jobs”, World Bank Group Policy Research
Working Paper, 7493, 1-39.
Arrow, J., Kerr, A., and Wittenberg, M. (2014) “Job Creation and Destruction in South Africa”, South
African Journal of Economics 82(1):1-18.
Audretsch, D.B., L. Klomp, E. Santarelli, and A.R. Thurik (2004), “Gibrat’s Law: Are the services different?”,
Review of Industrial Organization, 24: 301-324.
Ayyagari, M., A. Demirgüç-Kunt and V. Maksimovic (2014), “Who creates jobs in developing countries?”,
Small Business Economics, 43(1), 75-99.
Ayyagari, M., P. Juarros, M.S. Martinez Peria and S. Singh (2016), “Access to Finance and Job Growth: Firm-level Evidence across Developing Countries”, World Bank Group Policy Research Working Paper, 7604, 1-46.
Beck, T., A. Demirgüç-Kunt and V. Maksimovic (2005), “Financial and legal constraints to growth: Does firm size matter?”, Journal of Finance, 60(1), 137-177.
Benmelech, E., N.K. Bergman and A. Seru (2011), “Financing Labor”, NBER Working Paper Series, 17144. Biggs, T. and M. Shah (2003). The problem of African entrepreneurial development. In Pathways Out of
Poverty: Private Firms and Economic Mobility in Developing Countries. Fields, G. S., & Pfeffermann, G. P.
(Eds.). Boston: Kluwer Academic Publishers.
Bigsten, A. and Gebreeyesus, M. (2007) “The Small, the Young, and the Productive: Determinants of Manufacturing Firm Growth in Ethiopia”, Economic Development and Cultural Change, 55 (4):813-840. Boustanifar, H. (2014), “Finance and Employment: Evidence from U.S. banking reforms”, Journal of
Banking & Finance, 46, 343-354.
Cabral, L. (1995), “Sunk costs; firm size and firm growth”, Journal of Industrial Economics, 43, 161-172. Chesner, A. (1979), “Testing the law of proportionate effect”, Journal of Industrial Economics, 27, 403-411. Daunfeld, S-O. and N. Elert (2013), “When is Gibrat’s law a law?”, Small Business Economics, 41, 133-147. Davis, S.J., J. Haltinwanger, and S. Schuh (1996), Job Creation and Destruction, Cambridge, MA: MIT Press.
Ferdi P260 / Léon, F. and Monteiro, S. >> Financial constraints, factor combination… 25 Dao, M.C. and L.Q. Liu (2017). “Finance and Employment in Developing Countries: The Working Capital Channel”, IMF Working Paper, WP/17/189, 1-46.
Garmaise, M.J. (2008), “Production in Entrepreneurial Firms: The Effects of Financial Constraints on Labor and Capital”, The Review of Financial Studies, 21(2), 543-577.
Gibrat, R. (1931). Les inégalités économiques. Paris : Librairie du Recueil, Sirey.
Haltiwanger, J., R.S. Jarmin, and J. Miranda (2013), “Who creates jobs? Small versus large versus young”,
Review of Economics and Statistics, 85(2), 347-361.
Harrison, A.E., J.Y. Lin, and L.C. Xu (2014), “Explaining Africa’s (dis)advantage”, World Development, 63, 57-77.
Jenrich, R.I. (1970), “An asymptotic χ² test for the equality of two correlation matrices”, Journal of the
American Statistical Association, 65, 904-912.
Léon, F. and L. Weill (2018), “Islamic banking development and access to credit”, Pacific-Basin Finance
Journal, forthcoming.
Lotti, F., Santarelli, E., and M. Vivarelli (2009), “Defending Gibrat’s law as a long-run regularity”, Small
Business Economics, 32, 31-44.
Mansfield, E. (1962), “Entry, Gibrat’s Law, innovation, and the growth of firms”, American Economic
Review, 52(5), 1023-1051.
McKinsey Global Institute (2012), “Africa at work: Job creation and inclusive growth”.
Nassar, I.A., M.K. Almsafir, M.H. Al-Mahrouq (2014), “The validity of Gibrat’s Law in developed and developing countries (2008-2013): Comparison based assessment”, Procedia Social and Behavioral
Sciences, 129, 266-273.
Page, J. and Soderbom, M. (2015) “Is Small Beautiful? Small Enterprise, Aid and Employment in Africa”, African Development Review, 27, S1, 44-55
Rijkers, B., H. Arourib, C. Freund, and A. Nucifora (2014), “Which firms create the most jobs in developing countries? Evidence from Tunisia”, Labour Economics, 31, 84-102.
Ferdi P260 / Léon, F. and Monteiro, S. >> Financial constraints, factor combination… 26
Santar elli, E., L. Klomp, and A.R. Thurik (2006). Gibrat’s law: An overview of the empirical literature. In
Entrepreneurship, growth, and innovation, Springer US, Chapter 3, pp. 41-73.
Sleuwaegen, L. and M. Goedhyus (2002), “Growth of firms in developing countries, evidence from Côte d’Ivoire”, Journal of Development Economics, 68, 117-135.
Sutton, J. (1997), “Gibrat’s legacy”, Journal of Economic Literature, 35(1), 40-59.
Teal, F. (1999), “The Ghanaian manufacturing sector 1991-95: Firm growth, productivity and convergence”, Journal of Development Studies, 36, 109-127.
Teruel-Carrizosa, M. (2010), “Gibrat’s law and the learning process”, Small Business Economics, 34, 355-373.
World Bank Group, Enterprise Analysis Unit (2017) “Firm Level Productivity Estimates: Methodological note”.
Ferdi P260 / Léon, F. and Monteiro, S. >> Financial constraints, factor combination… 27 -Appendix-
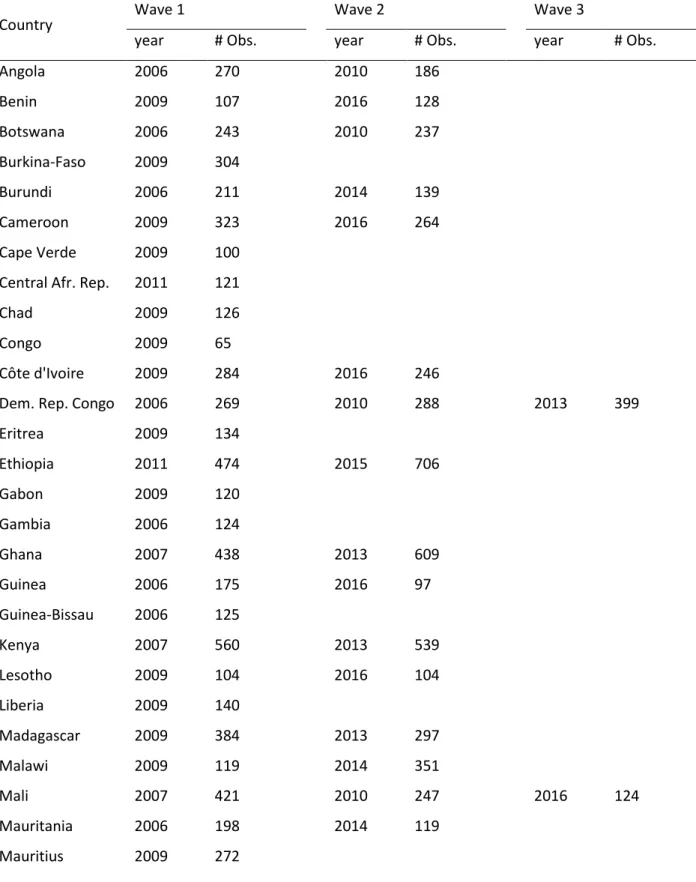
Table A1: Sample description
Country Wave 1 Wave 2 Wave 3
year # Obs. year # Obs. year # Obs.
Angola 2006 270 2010 186 Benin 2009 107 2016 128 Botswana 2006 243 2010 237 Burkina-Faso 2009 304 Burundi 2006 211 2014 139 Cameroon 2009 323 2016 264 Cape Verde 2009 100
Central Afr. Rep. 2011 121
Chad 2009 126
Congo 2009 65
Côte d'Ivoire 2009 284 2016 246
Dem. Rep. Congo 2006 269 2010 288 2013 399
Eritrea 2009 134 Ethiopia 2011 474 2015 706 Gabon 2009 120 Gambia 2006 124 Ghana 2007 438 2013 609 Guinea 2006 175 2016 97 Guinea-Bissau 2006 125 Kenya 2007 560 2013 539 Lesotho 2009 104 2016 104 Liberia 2009 140 Madagascar 2009 384 2013 297 Malawi 2009 119 2014 351 Mali 2007 421 2010 247 2016 124 Mauritania 2006 198 2014 119 Mauritius 2009 272
Ferdi P260 / Léon, F. and Monteiro, S. >> Financial constraints, factor combination… 28 Mozambique 2007 402 Namibia 2006 232 2014 370 Niger 2009 102 2017 98 Nigeria 2007 1 637 2014 1 267 Rwanda 2006 151 2011 196 Senegal 2007 408 2014 453 Sierra Leone 2009 138 South Africa 2007 781 South Sudan 2014 379
(Continued on the next page)
Sudan 2014 197 Swaziland 2006 198 2016 92 Tanzania 2006 354 2013 463 Togo 2009 117 2016 130 Uganda 2006 485 2013 553 Zambia 2007 394 2013 608 Zimbabwe 2011 478 2016 437
Ferdi P260 / Léon, F. and Monteiro, S. >> Financial constraints, factor combination… 29 Table A2: Variable definition
Variable Definition
Gr(Empl) Growth of the total number of permanent and full-time employees (annual average)
Gr(Sales) Growth of the total sales, deflated using the GDP deflator (annual average)
Empl Number of permanent full-time employees (average of the period)
Age Age of the firm (in years)
Export Dummy variable equal to 1 if 10% or more of sales are exported
Subsidiary Dummy variable equal to 1 if the rm is part of larger firm
Manag Exp Experience that the top manager has in this sector (in years)
Foreign-owned Dummy variable equalto 1 if 50% or more of the firm is owned by a foreign organization
State-owned Dummy variable equal to 1 if 50% or more of the firm is owned by the government
Privately-held Dummy variable equal to 1 if the firm is a limited liability company
Sole proprietorship Dummy variable equal to 1 if the firms is a sole proprietorship
FIN1
Dummy variable equal to 1 if a firm declared that access to financing is not an obstacle or a minor obstacle to its current operations
FIN2 Dummy variable equal to 1 if a firm has a loan or an overdraft
FIN3
Dummy variable equal to 1 if a firm that desired bank loan had access to credit and 0 if a firm that desired bank loan refused to apply for a loan or applied but was turned down.
Table A3: Firm access to credit, by firm size category
FIN1 FIN2 FIN3
Small 41.91 26.08 12.16
Medium 49.85 49.46 28.43
Large 55.46 69.35 50.74
All 45.55 37.33 19.61
Ferdi P260 / Léon, F. and Monteiro, S. >> Financial constraints, factor combination… 30 Figure A1: Firm size distribution (excluding firms with over 100 employees)
0 .0 2 .0 4 .0 6 .0 8 D e n si ty 0 20 40 60 80 100 size_avg