Cohesin Loss Eliminates All Loop Domains
The MIT Faculty has made this article openly available.
Please share
how this access benefits you. Your story matters.
Citation
Rao, Suhas S.P. et al. “Cohesin Loss Eliminates All Loop Domains.”
Cell 171, 2 (October 2017): 305–320 © 2017 Elsevier Inc
As Published
http://dx.doi.org/10.1016/J.CELL.2017.09.026
Publisher
Elsevier
Version
Author's final manuscript
Citable link
http://hdl.handle.net/1721.1/118942
Terms of Use
Creative Commons Attribution-NonCommercial-NoDerivs License
Cohesin loss eliminates all loop domains
Suhas S. P. Rao1,2,3, Su-Chen Huang1,2, Brian Glenn St Hilaire1,2,4, Jesse M. Engreitz5,
Elizabeth M. Perez5, Kyong-Rim Kieffer-Kwon6, Adrian L. Sanborn1,4,7, Sarah E.
Johnstone5,8, Gavin D. Bascom9, Ivan D. Bochkov1,2, Xingfan Huang1,10, Muhammad S.
Shamim1,2,10, Jaeweon Shin1,10, Douglass Turner1,11, Ziyi Ye1,10, Arina D. Omer1,2, James
T. Robinson1,5,11, Tamar Schlick9,12,13, Bradley E. Bernstein5,8, Rafael Casellas6,14, Eric S.
Lander5,15,16, and Erez Lieberman Aiden1,2,4,5,10,*
1The Center for Genome Architecture, Baylor College of Medicine, Houston, TX 77030, USA. 2Department of Molecular and Human Genetics, Baylor College of Medicine, Houston, TX 77030,
USA.
3Department of Structural Biology, Stanford University School of Medicine, Stanford, CA 94305,
USA.
4Center for Theoretical Biological Physics, Rice University, Houston, TX 77030, USA. 5Broad Institute of Harvard and MIT, Cambridge, MA 02139, USA.
6Genomics & Immunity, NIAMS, NIH, Bethesda, MD 20892, USA.
7Department of Computer Science, Stanford University, Stanford, CA 94305, USA.
8Department of Pathology and Center for Cancer Research, Massachusetts General Hospital and
Harvard Medical School, Boston, MA 02114, USA.
9Department of Chemistry, New York University, New York, NY 10003, USA.
10Departments of Computer Science and Computational and Applied Mathematics, Rice
University, Houston, TX 77030, USA.
11Department of Medicine, University of California San Diego, La Jolla, CA 92037, USA. 12Courant Institute of Mathematical Sciences, New York University, New York, NY 10012, USA. 13NYU-ECNU Center for Computational Chemistry, NYU Shanghai, Shanghai 200062, China. 14Center of Cancer Research, NCI, NIH, Bethesda, MD 20892, USA.
*Lead Contact, Correspondence to: [email protected].
Publisher's Disclaimer: This is a PDF file of an unedited manuscript that has been accepted for publication. As a service to our
customers we are providing this early version of the manuscript. The manuscript will undergo copyediting, typesetting, and review of the resulting proof before it is published in its final citable form. Please note that during the production process errors may be discovered which could affect the content, and all legal disclaimers that apply to the journal pertain.
Author Contributions: S.S.P.R. and E.L.A. conceived this project and designed all experiments. S-C.H. and B.G.S.H., and A.D.O.
performed Hi-C experiments. J.M.E. aided with the design of the PRO-Seq experiments and J.M.E. and E.M.P. performed PRO-Seq experiments. K-R.K-K., S.E.J., and S-C.H. performed ChIP-Seq experiments. A.L.S. performed extrusion and compartmentalization simulations. G.B. and T.S. designed and analyzed nucleosome simulations, which were performed by G.B. I.D.B. performed
HHS Public Access
Author manuscript
Cell
. Author manuscript; available in PMC 2018 October 05.Published in final edited form as:
Cell. 2017 October 05; 171(2): 305–320.e24. doi:10.1016/j.cell.2017.09.026.
A
uthor Man
uscr
ipt
A
uthor Man
uscr
ipt
A
uthor Man
uscr
ipt
A
uthor Man
uscr
ipt
15Department of Biology, MIT, Cambridge, MA 02139, USA.
16Department of Systems Biology, Harvard Medical School, Boston, MA 02115, USA.
SUMMARY
The human genome folds to create thousands of intervals, called “contact domains,” that exhibit enhanced contact frequency within themselves. “Loop domains” form because of tethering between two loci – almost always bound by CTCF and cohesin – lying on the same chromosome. “Compartment domains” form when genomic intervals with similar histone marks co-segregate. Here, we explore the effects of degrading cohesin. All loop domains are eliminated, but neither compartment domains nor histone marks are affected. Loss of loop domains does not lead to widespread ectopic gene activation, but does affect a significant minority of active genes. In particular, cohesin loss causes superenhancers to co-localize, forming hundreds of links within and across chromosomes, and affecting the regulation of nearby genes. We then restore cohesin and monitor the re-formation of each loop. Although reformation rates vary greatly, many megabase-sized loops recovered in under an hour, consistent with a model where loop extrusion is rapid.
eTOC
Cohesin loss results in elimination of loop domains, but neither compartment domains nor histone marks are affected.
INTRODUCTION
Many studies have shown that the insulator protein CTCF and the ring-shaped cohesin complex colocalize on chromatin (Wendt et al., 2008) and lie at the anchors of loops (Rao et al., 2014; Splinter et al., 2006) and the boundaries of contact domains (also called
“topologically constrained domains”, “topologically associated domains”, or “physical domains”) (Dixon et al., 2012; Lieberman-Aiden et al., 2009; Nora et al., 2012; Rao et al.,
A
uthor Man
uscr
ipt
A
uthor Man
uscr
ipt
A
uthor Man
uscr
ipt
A
uthor Man
uscr
ipt
2014). This suggests that these proteins help regulate genome folding (Merkenschlager and Nora, 2016). Consistent with this, deletion of CTCF sites interferes with loop and contact domain formation (Guo et al., 2015; Sanborn et al., 2015; de Wit et al., 2015). However, initial, low-resolution experiments examining genome-wide depletion of CTCF and cohesin observed only limited effects, reporting that compartments and contact domains still appear to be present (Seitan et al., 2013; Sofueva et al., 2013; Zuin et al., 2014). These results have made it difficult to ascertain the role of CTCF and cohesin in regulating genome
architecture.
Here, we examine the effects of cohesin loss on nuclear architecture, epigenetic state, and transcription.
RESULTS
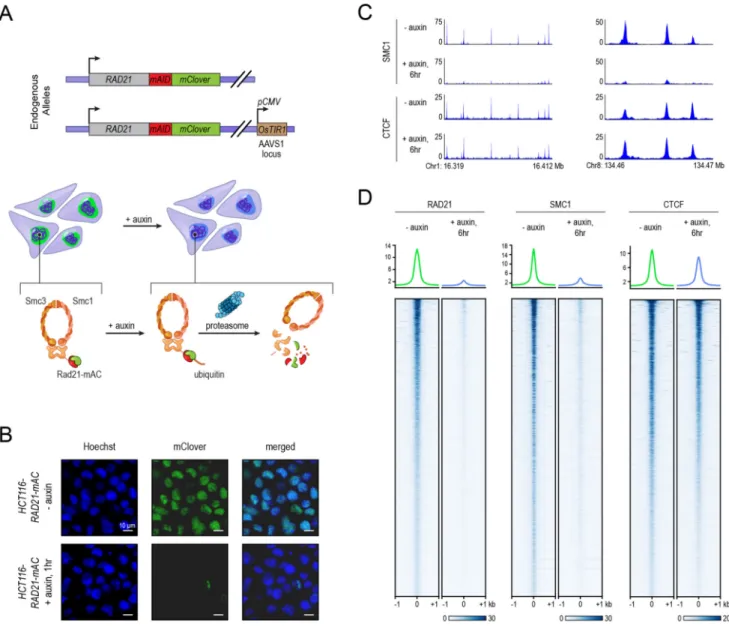
Rapid degradation of RAD21 using an auxin-inducible degron system
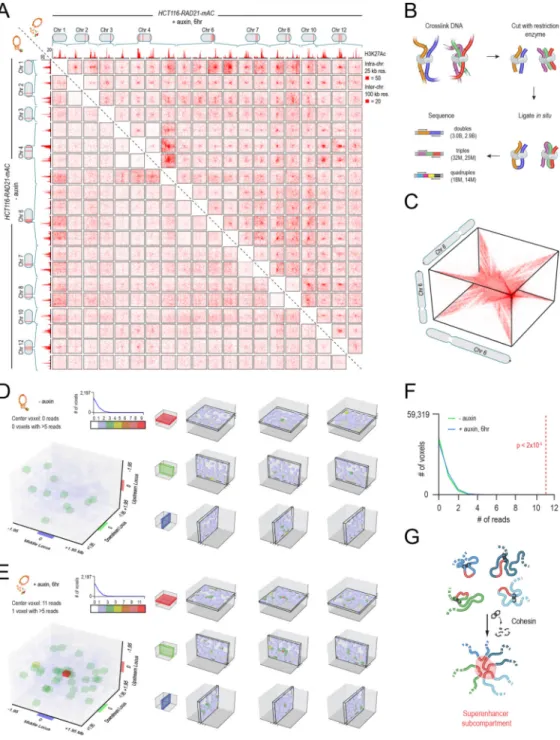
We employed an auxin-inducible degron (AID) (Natsume et al., 2016) to destroy RAD21, a core component of the cohesin complex. In this system, constitutive expression of the auxin-activated ubiquitin ligase TIR1 leads, in the presence of auxin, to rapid degradation of proteins tagged with an AID domain. We used this system in HCT-116, a human colorectal carcinoma cell line. This cell line had been previously modified by (Natsume et al., 2016) so that both RAD21 alleles were tagged with an AID domain and a fluorescent mClover (“RAD21-mAC”) (Fig. 1A). We confirmed that RAD21-mAC was efficiently degraded after 6 hours of auxin treatment using fluorescence microscopy and ChIP (Fig. 1B, S1, see Methods), and that cohesin could no longer associate with DNA using ChIP-Seq with antibodies for SMC1, a different cohesin subunit (Fig. 1C, D).
Histone modification patterns are unaffected by cohesin loss
We first examined the effects of cohesin degradation on key epigenomic features associated with genome folding, using ChIP-Seq. We examined the distribution of CTCF (associated with loop anchors) and the histone modifications H3K27me3, H3K36me3, H3K27Ac, H3K4me1, H3K4me3, H3K9me3, H4K16Ac, H4K20me3, H3K79me2, and H2.AZ
(associated with compartment intervals). Cohesin loss had little effect on these features (Fig. 1C,D; Fig. S1C–E, see Methods).
Loop domains are rapidly lost after degradation of cohesin
We then turned to study genome folding itself, beginning with loop domains. Loops arise when two loci on the same chromosome are tethered together. (For clarity, the loci will be referred to as “loop anchors”, the tethered pair as a “link”, and the interval between them as a “loop”.) Loop anchors are typically a pair of DNA motifs in the convergent orientation (i.e., the motifs face each other) that bind CTCF and cohesin (Rao et al., 2014). Loops frequently form a contact domain—that is, an interval in which all loci exhibit higher contact frequency with one another (than random loci at similar distance along the genome sequence); this structure is called a “loop domain” (Rao et al., 2014).
A
uthor Man
uscr
ipt
A
uthor Man
uscr
ipt
A
uthor Man
uscr
ipt
A
uthor Man
uscr
ipt
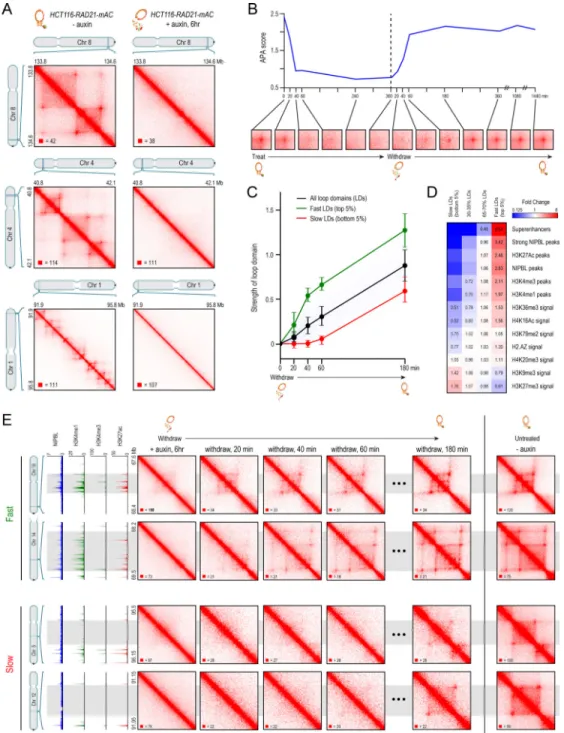
To examine loop domains, we used in situ Hi-C (Rao et al., 2014), which combines DNA-DNA proximity ligation and high-throughput sequencing to create maps showing the frequency of physical contact between all pairs of loci across the genome. Loop domains are manifest in Hi-C maps as a bright “peak” pixel (indicating the link between the two loop anchors) at the corner of a bright square (indicating the presence of a contact domain). We generated roughly 6 billion Hi-C contacts from HCT-116 cells before (3.0B) and immediately after (2.9B) auxin treatment. In the untreated cells, our algorithms annotated 3,170 loops, of which 2,140 were loop domains. Strikingly, the loop domains disappeared upon cohesin loss. The result was evident by visual examination (Fig. 2A, Fig. S2C, Data S1, I; (Durand et al., 2016a)). Moreover, the algorithms found only 9 loop domains after auxin treatment. Upon close inspection, all were found to be false positives (see Methods). (We return below to examine loops not associated with contact domains.)
To see if these changes were reversible, we performed a time-course analysis in which untreated cells were exposed to auxin for six hours, after which auxin was withdrawn (Fig. 2B, Fig. S2B). Low resolution Hi-C was performed immediately before treatment, as well as at a series of time points during treatment (at 20, 40, 60, 240, and 360 minutes) and after withdrawal (at 20, 40, 60, 180, 360, 1080, and 1440 minutes). To assess whether the anchors of the loop domains seen in the pre-treatment data continued to be linked (that is, co-located in space) subsequently, we used a method called Aggregate Peak Analysis (APA) (Durand et al., 2016b), which superimposes the signals from a set of peak pixels, thus allowing us to observe an aggregate signal even in sparse datasets where individual signals cannot be resolved (Fig. 2B). The APA signal was initially strong, but was gone by 40 minutes after treatment, and remained absent throughout the rest of the treatment period (Fig. 2B, S2B). The disappearance of the loop-domain links closely mirrored the depletion of cohesin levels in the samples during the treatment period, as ascertained by measuring mClover
fluorescence (Fig. S1). After auxin was withdrawn, the APA signal quickly increased, largely recovering by 1 hour (Fig. 2B, S2B).
These results indicate that the formation of loop domains requires cohesin; that loop domains rapidly disappear after the cohesin tethering the link has been degraded; and that the restoration of cohesin rescues the loop domains.
Loop domains spanning NIPBL and superenhancers recover more rapidly
To explore the formation process for individual loop domains, we generated 2.6 billion additional contacts from our Hi-C experiments after 20, 40, 60 and 180 minutes of auxin withdrawal (678M, 665M, 618M, and 675M contacts, respectively). Using these improved maps, we were able to calculate individual recovery curves for 2038 of the 2140 loop domains observed in the untreated cells (Fig. 2C, see Methods). (The time-resolved maps were not sufficiently deep to assess the 102 loop domains shorter than 100kb.) Recovery rates for individual loop domains varied dramatically. Faster recovery was strongly associated with high levels of NIPBL binding between the loop anchors, as well as enrichment of promoter and enhancer elements, and of activating histone marks like H3K36me3 and H4K16Ac. By contrast, loop domains that recovered slowly were typically depleted for these features, but enriched for repressive marks like H3K27me3 and H3K9me3
A
uthor Man
uscr
ipt
A
uthor Man
uscr
ipt
A
uthor Man
uscr
ipt
A
uthor Man
uscr
ipt
(Fig. 2D–E, Fig. S2D–F, Data S1, II). The most extreme difference we found was in the presence of superenhancers (also called stretch enhancers, or SEs), which are regions of the mammalian genome containing a very high density of enhancer elements, and which are marked by extremely high levels of H3K27 acetylation (Hnisz et al., 2013; Parker et al., 2013). Fast loop domains (recovery rate > 95th percentile) were 159-fold more likely than slow loop domains (<5th percentile) to span an SE (2.94 SEs/Mb vs. 0.02 SEs/Mb), and 26-fold more likely to contain strong NIPBL binding sites (4.23/Mb vs. 0.17/Mb) (Fig. S2E–F). Taken together, these results indicate that the rate of loop domain re-formation varies greatly across the genome, and is associated with factors ranging from cohesin loading to local regulatory activity.
Loss of cohesin is associated with stronger genome compartmentalization
Next, we examined the effects of cohesin loss on compartmentalization.
Compartmentalization refers to the fact that the genome is partitioned into intervals (which can range from 14 kb to more than 5 Mb) belonging to a small number of types, such that intervals of the same type exhibit an enhanced contact frequency with one another (Lieberman-Aiden et al., 2009; Rao et al., 2014). Intervals are thereby assigned to two compartments (A or B, closely associated with open and closed chromatin, respectively) and, more finely, into six subcompartments (A1, A2, B1, B2, B3, B4). The “compartment intervals” that lie in a particular compartment are associated with distinctive patterns of chromatin marks (Rao et al., 2014). Because loci within a compartment interval are of the same type, they exhibit an increased contact frequency with one another and frequently form contact domains. In this case, we call the contact domain a “compartment domain.” The enhanced contact frequency between compartment intervals in the same subcompartment also gives rise to a plaid pattern in Hi-C maps (Lieberman-Aiden et al., 2009).
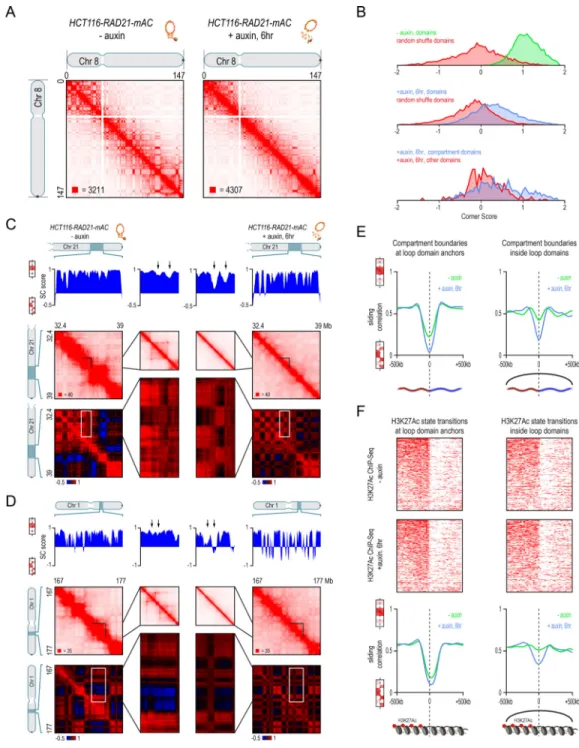
Whereas loop domains disappear entirely after cohesin loss, compartmentalization is preserved (Fig. 3A). Following auxin treatment, there is no significant change in either the compartment domains, as defined by the presence of the corresponding squares along the diagonal in the Hi-C contact map (Fig. 3B; see Methods), or in the plaid pattern, as defined by the eigenvectors of the Hi-C correlation map (Fig. 3A; mean Pearson’s r = 0.968 across all chromosomes). Our data is consistent with a previous report that genome
compartmentalization is preserved after depletion of cohesin (Seitan et al., 2013) or CTCF (Nora et al., 2017).
We then examined the interaction between compartments and loop domains. Specifically, we examined the compartment boundaries (transition points between compartment intervals) that either (i) lay in the interior of a loop domain in untreated cells or (ii) coincided with a loop-domain anchor in untreated cells (Fig. 3C–E). In the former case, the correlation in the genome-wide contact pattern on opposite sides of compartment boundaries showed a much greater decrease in treated vs. untreated cells—that is, the plaid pattern across the genome became much stronger in the absence of cohesin (Fig. 3C–E, Data S1,III). The results were similar when we examined boundaries between intervals that were enriched vs. depleted for H3K27Ac (which marks intervals in the “A” compartment (Rao et al., 2014)) or intervals that were enriched vs. depleted for H3K27me3 (which marks intervals in the “B1”
A
uthor Man
uscr
ipt
A
uthor Man
uscr
ipt
A
uthor Man
uscr
ipt
A
uthor Man
uscr
ipt
subcompartment (Rao et al., 2014)) (Fig. 3F, S3A–D, see Methods). These data indicate that the compartmentalization process that brings together loci with similar histone marks does not rely on cohesin. On the contrary, the strengthening of the plaid pattern after cohesin loss suggests that the formation of cohesin-dependent loop domains interferes with
compartmentalization by promoting the co-localization of locus pairs with different histone modification patterns. Our data is consistent with the observation that genome
compartmentalization is weakened in cells where the cohesin-antagonist WAPL is knocked out, leading to larger loop domains (Haarhuis et al., 2017).
Links between superenhancers strengthened after loss of cohesin
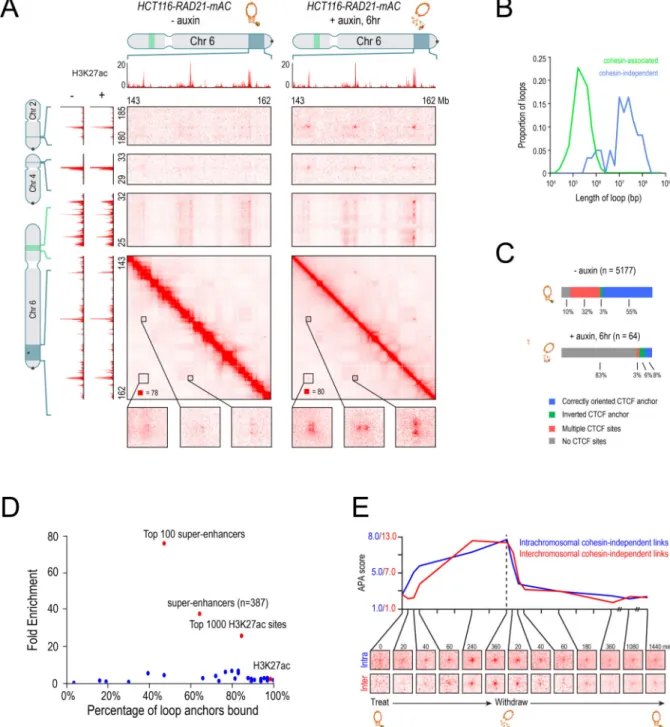
Next, we examined loops not associated with contact domains. Whereas 1,030 such loops were annotated in untreated cells, only 72 were annotated after cohesin loss. Upon close examination, 57 were false positives (see Methods). (The loop-detection algorithms have a higher false-discovery rate after cohesin loss, since true positives are so rare.) The remaining 15 loops were much larger than those seen in untreated cells (median: 1.75 Mb, vs. 0.275 Mb). Given their large size, we found that loops could be more reliably identified in treated cells by running our peak detection algorithm at coarser resolution (50–100 kb vs. 5–10 kb) (see Methods). This identified an additional 46 loops that were confirmed by manual inspection (Fig. 4A, S4A, see Methods). Afterwards, the size difference between the 61 “cohesin-independent loops” and the cohesin-associated loops was even more dramatic (Fig. 4B, median size: 23.15 Mb).
We sought to understand the basis of these “cohesin-independent loops.” We found that they do not demarcate the boundaries of contact domains (0 of 61 [0%]; vs. 2140 of 3170 [68%] for cohesin-associated loops). Remarkably, many cohesin-independent loop anchors form links with each another – manifest as focal peaks in the Hi-C heatmap – even when the anchors reside on different chromosomes (Fig. 4A, Data S1,IV). In total, we identified 203 such interchromosomal links. Interchromosomal links are not seen between the anchors of cohesin-associated loops.
The anchors of cohesin-independent loops also exhibit very different patterns of protein binding. The proportion that binds CTCF is much lower (20% vs. 90% for
cohesin-associated loops; Fig. 4C, Fig. S4A). Moreover, there is no tendency for the CTCF motifs at loop anchors to point into the loop (5 of 9 (56%) point inward vs. 2770 of 2919 (95%) for cohesin-associated loops.
Notably, the cohesin-independent loop anchors are highly enriched for superenhancers. We found that 41 of the 64 cohesin-independent loop anchors overlapped with the 387
superenhancers in HCT116 cells—a 37.5-fold enrichment (p<10−15). For the 100 strongest superenhancers, the enrichment was 76- fold (30 of 64, p<10−15; Fig. 4D, S4B).
Interestingly, cohesin-independent loops and the associated loops and links between superenhancers could be seen in the untreated cells as well, but were much weaker (Fig. 4A,E, Fig. 5A, Fig. S4C–E, Data S1,IV, see Methods).
A
uthor Man
uscr
ipt
A
uthor Man
uscr
ipt
A
uthor Man
uscr
ipt
A
uthor Man
uscr
ipt
Strikingly, we observed large cliques forming between the anchors of the
cohesin-independent loops (Fig. 5A, Data S1,V). Large cliques are not seen for cohesin-associated loops (Fig. S2A).
In many respects, the cohesin-independent loops resemble the superloops we previously observed on the inactive X chromosome (Darrow et al., 2016; Rao et al., 2014): they are very large (up to 77Mb), the intervals they span do not form contact domains, and their anchors tend to form cliques and are marked by H3K27 acetylation (Fig. S4F). We also found that the superloops tend to occur simultaneously, forming hubs containing 3 or more loci. We therefore wondered if cohesin-independent loop anchors would exhibit the same behavior.
To probe this question, we examined concatemers—that is, Hi-C reads which bring together 3 or more loci, and indicate that the loci in question were simultaneously co-located in a particular cell during the Hi-C experiment. We identified 57 million unique “triples,” which bring together 3 loci; 32 million unique quadruples, and 130 thousand quintuples (Fig. 5B, see Methods). Instead of a 2-dimensional heatmap, concatemers are naturally represented as an n-dimensional matrix, or tensor, showing the collision frequency (i.e. the frequency of simultaneous physical contact) between any set of n loci in the genome (Fig. 5C). Hubs involving n loci manifest in the n-dimensional contact tensor as peaks in collision frequency with respect to the local n-dimensional neighborhood.
Because the number of entries in an n-dimensional contact tensor scales as the genome size to the nth power, contact tensors can be exceedingly sparse. We therefore did not expect to see triples corresponding to any particular set of three cohesin-independent loop anchors. Instead, we developed a variant of APA for contact tensors, superimposing the signal from all possible sets of three cohesin-independent loop anchors that lie on a single chromosome (see Methods). This analysis revealed 11 collisions involving three cohesin-independent loop anchors in the auxin-treated data, as compared to an expected value of 0.41 collisions based on the density of collisions in the local neighborhood (Fig. 5D–F, Fig S5A–B). These findings indicate that, like superloops, cohesin-independent loop anchors tend to form hubs involving three or more loci. By contrast, no collisions were found in the untreated data. This is consistent with our finding that cohesin-independent loops are much weaker in the presence of cohesin.
Molecular dynamics simulations integrating extrusion and compartmentalization can recapitulate Hi-C experimental results
To test the hypothesis that the Hi-C contact maps we observed are consistent with the presence of two distinct folding mechanisms, we modeled a 2.1 Mb region on chromosome 3 (Sanborn et al., 2015). Our model treated the region as a block copolymer consisting of two types of chromatin, A or B, determined by classifying loci based on ChIP-Seq binding data; and containing CTCF binding sites, whose position and strength were derived from CTCF and SMC1 ChIP-Seq tracks, and whose orientation was determined by examining the human genome reference (Fig. 6A, see Methods). We used molecular dynamics simulations to examine the behavior of this polymer in a solvent containing extrusion complexes (thus modeling loop extrusion (Fudenberg et al., 2016; Sanborn et al., 2015)), and in the presence
A
uthor Man
uscr
ipt
A
uthor Man
uscr
ipt
A
uthor Man
uscr
ipt
A
uthor Man
uscr
ipt
of attractive forces between like monomers (thus modeling compartmentalization (Di Pierro et al., 2016)). The resulting ensemble was used to create an in silico contact map for the region.
We found that the resulting contact maps accurately recapitulated the experimental results in both untreated and treated cells (Figure 6A,B), and illustrate the change in long-range contact pattern that is seen when a loop spans a compartment boundary (Data S1,VI). These findings suggest that the most prominent features observed in Hi-C data sets (loops, domains, and compartments) can be recapitulated by simulations that use only ChIP-Seq data as input, in the context of a model combining extrusion and compartmentalization. The above simulations assume that phase separation leads to the compartmentalization of chromatin intervals bearing similar patterns of histone marks. There are multiple models that could account for such a tendency. In one, phase separation is facilitated by protein
chaperones that recognize histone tails. Alternatively, similar nucleosomes might directly attract one another through histone tail interactions. To see whether tail interactions can guide folding at the oligonucleosome scale given the mechanical, electrostatic, and entropic constraints on chromatin fibers we simulated short fibers using a mesoscale approach (Bascom and Schlick, 2017; Bascom et al., 2017; Grigoryev et al., 2016). These simulations have three components: linker DNA beads (each representing 9 bp), nucleosome core particles (rigid bodies with charged surfaces), and histone tail beads (each representing 5 aa) (Fig. S6A–B). We found that histone tail interactions overcame constraints on the chromatin chain, leading either to focal contacts between short chromatin intervals or to global condensation, depending on the initial configuration and epigenetic state of the fiber (Fig S6C–E). Of course, these findings do not rule out a central role for protein chaperones in vivo.
Cohesin loss results in strong down-regulation of genes near superenhancers, but does not bring about widespread ectopic activation
Finally, we sought to investigate the role of cohesin in regulating gene expression. Cohesin has been proposed to facilitate interactions between enhancers and promoters (Kagey et al., 2010; Merkenschlager and Nora, 2016). Loop domains are thought to regulate this process by preventing enhancers from forming ectopic interactions with targets that lie in a different loop domain (Lupiáñez et al., 2015; Flavahan et al., 2016). We therefore characterized the effects of cohesin loss on nascent transcription by performing precision nuclear run-on sequencing (PRO-Seq) in treated and untreated HCT116 cells (Engreitz et al., 2016; Jonkers and Lis, 2015) (Fig. 7A). We chose an early timepoint – 6 hours after auxin treatment – with the aim of examining direct consequences, rather than indirect effects due to changes in cell state.
To look for signs of ectopic activation, we examined the 14,853 genes that were not expressed (RPKM<0.5) in untreated cells. Of these genes, 1% (216) were activated after treatment (p<0.05, >30% change in RPKM, RPKM>0.5 in treated cells). Thus, while cohesin plays a role in preventing ectopic activation, most genes remain inactivated even in the absence of cohesin and loop domains.
A
uthor Man
uscr
ipt
A
uthor Man
uscr
ipt
A
uthor Man
uscr
ipt
A
uthor Man
uscr
ipt
We next looked for changes in the 12,222 genes that were expressed (RPKM>0.5) in untreated cells (Fig. 5B). Here again, most genes (87%, 10,615) exhibited similar levels of transcription after cohesin degradation (RPKM changed by less than 30%). Strong effects were infrequent: 64 genes (0.5%) showed a 2-fold change, and 2 genes showed a 5-fold change (Fig. 7B). While the quantitative impact may seem modest, such changes can have important biological impacts (Flavahan et al., 2016).
Of genes that exhibited a strong change in transcription, more were downregulated than upregulated (61% vs. 39%)—suggesting that cohesin-associated loops may both facilitate activation of promoters by their distal enhancer elements and block activation by
inappropriate enhancers, with the former being somewhat more common.
We wondered how cohesin facilitated these promoter-enhancer contacts. We noticed that many of the genes that were downregulated (by >1.75-fold) were located within 500kb of superenhancers (23 of 49, 4.8-fold enrichment, Fig. 7C,D; S7A–B). Of these genes, 29% were located with 500kb of one of the top 100 superenhancers (8.5-fold enrichment). Strikingly, these superenhancers were often located at the anchors of the cohesin-independent links seen in treated cells (8 of 19, a 13.7-fold enrichment).
The above results are interesting from the standpoint of transcriptional regulation. In the absence of cohesin, superenhancers associated with the downregulated genes exhibit a strong tendency to form links with one another. By contrast, in the presence of cohesin, the majority of these superenhancers were located in the interior of cohesin-associated loop (in 13 of 19 cases) and the long-distance cohesin-independent links were much weaker.
DISCUSSION
Here, we explore the 4D Nucleome of a human colon cancer cell line during cohesin loss and recovery, achieving Hi-C map resolutions of 5kb with a time resolution of 20 minutes. We find that cohesin is required for the establishment and maintenance of loop domains. After cohesin loss, we also find that: (i) histone marks are unchanged; (ii) compartment structure is strengthened in the absence of cohesin, as loop domains spanning multiple compartment intervals lead to mixing among loci in different compartments; (iii) only a small subset of genes exhibit large changes in transcription level. As auxin is withdrawn, cohesin levels recover, and we are able to measure the rate of formation for nearly every loop domain, genome-wide. Loop domains that recover quickly are much more likely to span superenhancers and binding sites of the cohesin loading factor NIPBL. Finally, we identify a class of cohesin-independent loops, links and hubs connecting superenhancer loci on many chromosomes.
Comparison with other studies
It is important to set our results in the context of other studies related to loop formation. While there is clear agreement that deletion of individual CTCF binding sites can result in a loss of cohesin binding and can abolish loops and contact domains (Guo et al., 2015; Sanborn et al., 2015; de Wit et al., 2015), there have been conflicting reports about the effects of depleting cohesin or CTCF.
A
uthor Man
uscr
ipt
A
uthor Man
uscr
ipt
A
uthor Man
uscr
ipt
A
uthor Man
uscr
ipt
Early Hi-C studies of cohesin and CTCF depletion, using both gene knockouts and proteolytic cleavage, reported that contact domains remained (Seitan et al., 2013; et al., 2013; Zuin et al., 2014). The discrepancy may be due to (i) the fact that low resolution Hi-C analysis cannot not distinguish between loop domains, which are sensitive to cohesin depletion, and compartment domains, which are not; and (ii) the possibility that the cohesin depletion was incomplete (Fig. S2C). More recently, CTCF depletion followed by higher-resolution Hi-C (Nora et al., 2017) revealed the disappearance of a subset of contact domains. Our data for cohesin depletion is consistent with is study.
Two recent studies have also sought to examine the effects of depletion of NIPBL, which encodes a cohesin loader protein. They report opposite conclusions. The (Schwarzer et al., 2016) preprint reported, on the basis of new experiments, that the genome-wide aggregate signal from loop domains is absent following NIPBL deletion. By contrast, a recent publication reported the continued presence of individual loop domains after the near-complete depletion of NIPBL, although these loop domains were abnormally small (Haarhuis et al., 2017). In any case, it is unclear what effect NIBPL depletion would be expected to have on loop domain formation because, although NIPBL facilitates cohesin loading, it may not be essential for cohesin loading. Indeed, cohesin loading independent of NIPBL has been observed in vitro, albeit at low efficiency (Davidson et al., 2016; Stigler et al., 2016).
Finally, an exciting recent experiment demonstrated that deletion of WAPL, a cohesin antagonist that removes cohesin from chromatin, results in the formation of thousands of new loops and loop domains, which are larger than those found when WAPL is intact (Haarhuis et al., 2017). Our results are consistent with these findings.
Two mechanisms that guide genome folding
Our results highlight two distinct mechanisms that guide genome folding.
The first is the cohesin-dependent formation of loop domains. The data presented above are consistent with several models of this process. We (Sanborn et al., 2015) and others (Alipour and Marko, 2012; Fudenberg et al., 2016; Nasmyth, 2001) have hypothesized that the underlying physical process is the formation of loops by extrusion. In this model, loop domains form when a hypothetical cohesin-based extrusion complex (“Xcom”), which comprises two physically tethered subunits, binds chromatin at a particular location; subsequently, the subunits slide in opposite directions until they arrive at a bound CTCF protein. Thus, the disappearance of cohesin can eliminate all loop domains without influencing CTCF binding. Other models include the initial formation of loops via 3D diffusion of anchor loci, followed by cohesin-mediated stabilization. See (Sanborn et al., 2015) for a fuller discussion.
The second mechanism is the cohesin-independent compartmentalization of chromatin intervals with similar histone marks (Lieberman-Aiden et al., 2009; Rao et al., 2014). This observation is also compatible with several models: histone modifications might drive the formation of compartments (i.e., “phase separation” (Hnisz et al., 2017; Jost et al., 2014; Di
A
uthor Man
uscr
ipt
A
uthor Man
uscr
ipt
A
uthor Man
uscr
ipt
A
uthor Man
uscr
ipt
Pierro et al., 2016)); compartmentalization might lead to histone remodeling; or both processes might be caused by a third mechanism.
The data presented above – specifically, the fact that cohesin loss does not affect histone modifications, but does cause long-range contact patterns to better match patterns of histone marks – is more consistent with histone patterns governing genome compartmentalization, rather than the reverse. This phase separation process could involve histone-tail interactions, or the binding of reader proteins that target modified histones to specific locations in the nucleus (Wijchers et al., 2016). Interestingly, two recent studies have provided evidence that the protein HP1a, which binds the heterochromatic H3K9me mark, forms liquid droplets in vivo via phase separation, such that H3K9me heterochromatin is contained within the droplets (Larson et al., 2017; Strom et al., 2017). Of course, it remains possible that independent mechanisms may shape both histone mark patterns and genome compartmentalization.
The speed of loop extrusion
We show that loop domains disappear shortly after auxin-induced cohesin loss, and reappear shortly after auxin withdrawal, implying that (i) they require cohesin both for formation and maintenance; and (ii) they do not represent stable states of chromosome condensation. In the loop extrusion model, the two physically tethered subunits of the Xcom bind chromatin at a single site, and then slide in opposite directions along chromatin.
Measurements of loop re-formation enable estimates of extrusion speed. For instance, in figure 2E, we show a ~900kb loop that is restored within 40 minutes of auxin withdrawal. Thus, this loop is extruded at an average rate of no less than 375 bp/s, with each Xcom subunit sliding at no less than 188 bp/s. Our estimates are lower bounds, as they ignore the time needed for auxin to disappear and for cohesin to re-form and be loaded on chromatin. (Given the correlation between loop reformation speed and Nipbl, loading time may be a significant consideration.)
These estimates are similar to ones obtained studying the SMC complex in B. subtilis [500– 1000 bp/s] (Wang et al., 2017).
The rate estimates bear on the protein motors involved when Xcom subunits slide. For instance, it is possible that cohesin itself serves as a motor during the extrusion process. However, single molecule studies of cohesin translocation in vitro, have yielded an estimated sliding rate of only 1–2bp per second on chromatin (Davidson et al., 2016; Stigler et al., 2016). These could indicate that cohesin alone – under the conditions probed in those experiments – is unlikely to be the principal source of translocase activity. Similarly, RNA polymerase II can push cohesin along DNA (Davidson et al., 2016) but elongation rate estimates (9–90 bp/s; (Jonkers and Lis, 2015)) are slower than what we observe. This suggests that other translocases may be involved in loop extrusion.
Two classes of loops
We observe a population of loops that are frequently anchored at superenhancers and do not depend on cohesin.
A
uthor Man
uscr
ipt
A
uthor Man
uscr
ipt
A
uthor Man
uscr
ipt
A
uthor Man
uscr
ipt
One explanation is that these loops, too, form by extrusion, but using alternative protein complexes, such as condensin, instead of cohesin. However, the superenhancer anchors also form links with one another when they lie on different chromosomes, whereas loop
extrusion cannot form interchromosomal links. Our data is therefore less consistent with a model where where superenhancer loops form by extrusion, and more consistent with the presence of an alternative mechanism, perhaps based on some form of facilitated diffusion or phase separation (Sanborn et al., 2015).
In particular, superenhancer links may represent compartmental co-segregation of small, H3K27-acetylated intervals (Fig. 5G), which accounts for why these links can join loci on different chromosomes, why they are weaker in the presence of cohesin, and why their anchors form large cliques and highe-rorder hubs.
Notably, loops and links between superenhancers increase in strength rapidly following cohesin loss, reaching a plateau within hours. This implies that compartmentalization is capable of inducing intrachromosomal loops and interchromosomal links at rapid rates, comparable to those of loop-domain formation. (Our findings may be related to those of other studies, which have noted enhanced interactions between higher-order
intrachromosomal interactions between domains containing superenhancers (Beagrie et al., 2017).)
The interplay between loop extrusion and compartmentalization
Using our high-resolution contact maps, we are also able to examine the ways in which loop domain formation and compartmentalization interact. It is commonly thought that
compartment intervals are typically megabases in length, and are subdivided into smaller domains in a hierarchical fashion (Dixon et al., 2012; Nora et al., 2012). Here, we
demonstrate that compartment intervals can be as short as tens of kilobases, and can overlap loop domains in complex ways. For instance, we observe numerous examples of loop domains spanning multiple compartment intervals.
In such cases, we find that loop extrusion, by facilitating contacts between all loci in the loop domain, can enhance the contact frequency of loci that would ordinarily lie in different subcompartments. Thus, the long-range contact pattern seen for each locus is a mixture of the pattern that would ordinarily be seen for loci in the corresponding subcompartment, and the pattern seen for other loci in the loop. This mixing disappears upon cohesin depletion (Fig. 7E). Similarly, deletion of WAPL appears to increase the processivity of the Xcom, and thus increases the size of loops (Haarhuis et al., 2017). Consistent with our observations, these larger loops are associated with extensive mixing, which obscures long-range compartment patterns.
The interplay between cohesin and gene regulation
Many studies have proposed that cohesin facilitates interactions between enhancers and promoters, thereby upregulating the transcription of many genes (Kagey et al., 2010; Merkenschlager and Nora, 2016). Moreover, studies have also suggested that loop domains formed between CTCF and cohesin binding sites create insulated regulatory neighborhoods —partially protecting genes with a loop domain from the influence of enhancers outside the
A
uthor Man
uscr
ipt
A
uthor Man
uscr
ipt
A
uthor Man
uscr
ipt
A
uthor Man
uscr
ipt
domains (Flavahan et al., 2016; Lupiáñez et al., 2015). Our study, combining rapid depletion of cohesin and measurement of nascent transcription using PRO-Seq, allows us to more clearly dissect the direct effects of cohesin loss on transcription.
We find that a very small set of genes, often lying near superenhancers, becomes strongly downregulated after cohesin loss. However, most genes are not strongly affected. This suggests that cohesin-dependent loop domains themselves play at most a modest role in facilitating or disrupting interactions between promoters and enhancers. Of course, we cannot dismiss modest effects on overall level of transcription as unimportant. For example, modest increases in the expression of receptor tyrosine kinase genes can have meaningful effects on cell proliferation (Flavahan et al., 2016).
Nevertheless, it is particularly interesting to compare the above findings with earlier studies, using similar methods, that showed a strong correlation between the presence of a loop domain and many-fold increases in the expression of genes at the loop domain anchor (Kagey et al., 2010; Rao et al., 2014). Taken in isolation, these earlier results are consistent with a model where the formation of loop domains routinely causes many-fold changes in gene expression. By contrast, the data presented here are more consistent with a model where the formation of loop domains influences gene transcription, but rarely causes many-fold changes.
One possibility is that both processes might be independent consequences of upstream regulatory events. For example, changes in accessibility of a gene promoter might facilitate both transcription factor binding, activating the gene, and cohesin arrest, activating the loop domain. Alternatively, large increases in gene expression may alter the accessibility of CTCF motifs at the promoter and cause loop domain formation.
Our study suggests a model where cohesin-associated looping, by increasing the frequency of contact between loci within loop domains and by disturbing patterns of
compartmentalization, facilitates mixing between elements (such as genes and superenhancers) that would otherwise be segregated. Thus, compartmentalization and extrusion – through independent and complementary mechanisms – interact to shape transcription.
STAR METHODS
CONTACT FOR REAGENT AND RESOURCE SHARING
All requests for information, reagents and resources should be directed to the Lead Contact, Erez Lieberman Aiden ([email protected]).
EXPERIMENTAL MODEL AND SUBJECT DETAILS
HCT-116 cells—We obtained HCT-116-CMV-OsTir1 and HCT-116-RAD21-mAID-mClover cells (HCT-116 RAD21-mAC) from (Natsume et al., 2016). The cells were cultured in McCoy’s 5A medium supplemented with 10% FBS, 2 mM L-glutamine, 100 U/ml penicillin, and 100ug/ml streptomycin at 37C with 5% CO2. Degradation of the AID-tagged RAD21 was induced by the addition of 500uM indole-3-acetic acid (IAA; Sigma
A
uthor Man
uscr
ipt
A
uthor Man
uscr
ipt
A
uthor Man
uscr
ipt
A
uthor Man
uscr
ipt
Aldrich). For our standard in situ Hi-C, ChIP-Seq, and PRO-Seq experiments on untreated cells and cells treated for 6 hours, medium was aspirated at t=0, and either replaced with fresh medium (untreated) or medium containing 500uM IAA. The cells were then washed, trypsinized and processed for downstream experiments at t=6hrs.
For our time course experiments, cells were treated with 500uM IAA and crosslinked with 1% formaldehyde directly in wells of a 6-well plate at various time points after treatment (20, 40, 60, 240, 360 minutes). For the auxin withdrawal experiments, after 6 hours treatment with 500um IAA, the cells were trypsinized, washed twice in fresh media and replated in 6-well plates in fresh media. They were then crosslinked with 1% formaldehyde directly in the 6-well plates at various time points after auxin withdrawal (20, 40, 60, 180, 360, 1080, 1440 minutes).
In order to ensure that our results were not due to the HCT-116 cells stalling in mitosis, we also repeated our Hi-C experiments after cell synchronization and arrest of the cells at the G1/S boundary. First, we added 2mM thymidine to arrest the cells in S-phase and incubated the cells for 12 hours. We then trypsinized and spun down the cells and replated in fresh media, allowing the cells to grow for 12 hours to exit from S-phase. We then added
mimosine to a final concentration of 400uM and incubated the cells for 12 hours to arrest the cells at the G1/S boundary. We then replaced media with either complete media + 500uM IAA + 400uM mimosine (treated cells) or complete media + 400uM mimosine (untreated cells) and incubated the cells for 6 hours before processing for downstream experiments.
METHOD DETAILS
Microscopy—Live HCT116 RAD21-mAC cells in growth medium without phenol red were added to a chambered coverglass (Lab-Tek #155409) 24 hours prior to imaging and incubated at 37°C, 5%CO2, allowing them to attach to the coverglass. One hour before imaging, the growth medium was replaced with 2 µg/ml of Hoechst 33342 in phosphate-buffered saline (PBS) to visualize nuclei. Time-lapse widefield fluorescence microscopy was performed on a DeltaVision OMX microscope (GE Healthcare) equipped with a 37°C incubation chamber, using a 60× oil immersion objective. Cells were treated with 500µM of IAA immediately before imaging. Images were collected every 10 minutes from 0 to 60 minutes following treatment (DAPI filter at 5%T, 100ms for Hoechst; FITC filter at 100%T, 100ms for mClover), and deconvolved using the built-in SoftWoRx software. The Hoechst images were adjusted in Photoshop by increasing brightness by 92 and contrast by 92 in legacy mode (applied equally to the entire image for all timepoints). The mClover images were adjusted in Photoshop by increasing brightness by 164 and contrast by 123 in legacy mode (applied equally to the entire image for all timepoints). The images were merged in Photoshop using the “screen” function.
In situ Hi-C—We generated 69 in situ Hi-C libraries using the MboI restriction enzyme following the protocol described in(Rao et al., 2014) without modifications. In brief, the in situ Hi-C protocol involves crosslinking cells with formaldehyde, permeabilizing them with nuclei intact, digesting DNA with a suitable 4-cutter restriction enzyme, filling the 5’-overhangs while incorporating a biotinylated nucleotide, ligating the resulting blunt-end
A
uthor Man
uscr
ipt
A
uthor Man
uscr
ipt
A
uthor Man
uscr
ipt
A
uthor Man
uscr
ipt
fragments, shearing the DNA, capturing the biotinylated ligation junctions with streptavidin beads, and analyzing the resulting fragments with paired-end sequencing.
We generated 7 libraries each for our main maps (untreated HCT-116 RAD21-mAC cells and HCT-116 RAD21-mAC cells treated for 6 hours with IAA) comprised of two sets of biological replicates each (three and four technical replicate libraries per biological
replicate). In addition, we generated four technical replicate libraries each for untreated and treated HCT-116 RAD21-mAC cells after cell synchronization and arrest. We also generated an additional 5 libraries from untreated HCT-116 RAD21-mAC cells and 4 libraries from HCT-116 RAD21-mAC cells treated for 6 hours with IAA (two additional biological replicates each) that were not included in our main maps, but were used for analysis of higher-order contacts (see below). We generated four libraries (two biological replicates) for each of our loop-resolution maps along the auxin withdrawal time course (20, 40, 60 and 180 mins after auxin withdrawal). Finally, we generated two technical replicate libraries per time point of our auxin treatment and withdrawal time course. Similar results were obtained with Hi-C libraries from synchronized and arrested cells (Data. S1, I), so for all analyses presented in the main text and figures of the manuscript (other than the time course analyses), we utilized our high resolution maps from the unsynchronized cells. Further details about the Hi-C libraries and details about which experiments were used in which figures are provided in Table S1.
ChIP-Seq—ChIP-Seq for H3K27Ac, H3K4me1, H3K4me3, H3K36me3, H3K27me3, H3K9me3, H4K16Ac, H4K20me3, H3K79me2, and H2.AZ was performed using a native ChIP-Seq protocol. Chromatin from untreated HCT-116 RAD21-mAC cells or cells treated for 6 hours with 500uM IAA was digested with Mnase (Sigma) in digestion buffer (50 mM Tris-HCl, pH7.6, 1 mM CaCl2, 0.2% Triton X-100, butyrate 5 mM) for 5’ at 37°C and
dialyzed against RIPA buffer for 2hrs at 4°C. Five microgram of respective antibody was incubated with 40 µl of Dynabeads Protein A (or G) for 40 min at room temperature. Antibody-bound beads were added to 500 µl of sonicated or Mnase-digested chromatin, incubated at 4°C overnight, and washed twice with RIPA buffer, twice with RIPA buffer containing 0.3M NaCl, twice with LiCl buffer (0.25 M LiCl, 0.5% Igepal-630, 0.5% sodium deoxycholate), once with TE (pH 8.0) plus 0.2% Triton X-100, and once with TE (pH 8.0). ChIP DNA was purified by phenol-chloroform extraction followed by ethanol precipitation. Libraries were prepped for Illumina sequencing and 50bp single-end reads were sequenced on a HiSeq2000 or 2500 (Illumina). We also performed ChIP-Seq for RAD21 and CTCF following the same protocol as above, except that cells were fixed with 1% formaldehyde for 10 minutes at 37°C and fixation was quenched by the addition of glycine to a final
concentration of 125mM for 10 minutes. The fixed cells were sonicated using a Branson sonifier at amplitude 35%, 12 cycles of 20 seconds of sonication and 30 seconds of pause. Antibody was added to the sonicated chromatin as above and the samples were further processed as above.
We also performed ChIP-Seq for SMC1 and an additional replicate for CTCF following the protocol outlined by the ENCODE consortium (2012).
All ChIP-Seq experiments were processed in parallel with whole cell extract input controls.
A
uthor Man
uscr
ipt
A
uthor Man
uscr
ipt
A
uthor Man
uscr
ipt
A
uthor Man
uscr
ipt
PRO-Seq—To measure changes in transcription resulting from cohesin loss, we performed precision run-on sequencing (PRO-Seq) (Jonkers and Lis, 2015), a variant of global run-on sequencing (GRO-Seq), using a single biotinylated nucleotide (biotin-11-CTP) as previously described (Engreitz et al., 2016). We made one modifications to the protocol: at the end of each biotin enrichment, we eluted biotinylated RNAs from the streptavidin-coated magnetic beads by heating beads in 25 µl of 20 mM Tris-HCl pH 7.5, 10 mM EDTA, 2%
N-lauroylsarcosine at 95°C for 5 minutes, followed by a magnetic-bead nucleic acid purification with 20 µl of MyONE SILANE beads. During the nuclei preparation step, we processed pairs of RAD21-mAC cells with and without auxin treatment in parallel. In addition, we performed PRO-Seq on HCT-116 CMV-OsTIR1 cells, the parental cell line of RAD21-mAC containing the OsTIR1 gene integrated at the AAVS1 locus and no mAID tags integrated on any protein. By performing PRO-Seq on CMV-OsTIR1 cells with and without auxin treatment, we could control for transcriptional effects of the auxin treatment itself on HCT-116 cells, as well as any consequences of tagging the RAD21 protein.
QUANTIFICATION AND STATISTICAL ANALYSIS
Hi-C Data Processing—All Hi-C libraries were sequenced either on an Illumina
NextSeq500 (either 80 or 85bp paired-end reads) or a HiSeqX (150bp paired-end reads). All resulting data was processed using Juicer (Durand et al., 2016b; Rao et al., 2014). The data was aligned against the hg19 reference genome. All contact matrices used for further analysis were KR-normalized with Juicer. Loops were annotated in both untreated and treated maps using HiCCUPS (Durand et al., 2016b; Rao et al., 2014).
Loops were called at 5kb, 10kb, and 25kb resolutions and merged as described in (Rao et al., 2014). Default parameters as described in (Durand et al., 2016b; Rao et al., 2014) were used with the exception that an additional enrichment filter was added. We noted that due to karyotypic abnormalities in the HCT-116 cell line, many rearrangements were annotated in both the untreated and treated maps. Since rearrangements appear as very intense pixels off-diagonal, we removed any peak calls that displayed an observed/expected enrichment of >4.5. Empirically, this max threshold removed peak annotations due to rearrangements; notably, nearly the same number of annotated peaks were removed from the untreated and the treated annotations, 277 and 269 respectively. In the end, we annotated 3,170 loops in our untreated maps and 81 loops in our treated maps.
Domains were annotated in both untreated and treated maps using Arrowhead (Durand et al., 2016b; Rao et al., 2014). Domains were called at 5kb and 10kb resolutions using default parameters and merged (retaining the 5kb domain annotation for any pair of domains annotated in both the 5kb and 10kb annotations). We annotated 9,845 domains in our untreated maps and 2,090 domains in our treated maps.
ChIP-Seq Data Processing—All ChIP-Seq data was aligned to hg19 with BWA (Li and Durbin, 2010) (Li and Durbin, 2010) (Li and Durbin, 2010), deduplicated using PicardTools, and analyzed with MACS 2.0 (Liu, 2014). All data was normalized against the
corresponding input control using the ‘-c’ option of MACS 2.0. ChIP-Seq peaks were called using the ‘callpeak’ function of MACS 2.0 with default parameters. For H3K4me3 and
A
uthor Man
uscr
ipt
A
uthor Man
uscr
ipt
A
uthor Man
uscr
ipt
A
uthor Man
uscr
ipt
H3K4me1, we additionally used the ‘–broad’ option of MACS 2.0 and merged close by peaks to identify broad peaks. Finally, for H3K4me1 and H3K27Ac, we filtered peaks called by MACS by requiring an adjusted -log10 p-value of at least 7 and 5 respectively in order to ensure that we had a high quality peak annotation. Finally, in order to annotate broad-source domains, we utilized RSEG (Song and Smith, 2011) using the following flags: b 25000’, ‘-i 20’, ‘-mode 2’.
Signal tracks were calculated by using the ‘bdgcmp’ option of MACS 2.0 with the ‘FE’ (fold-enrichment) method. All data for downstream analysis was averaged and extracted from these tracks.
PRO-Seq Data Processing—For analysis of PRO-Seq data, we aligned 30-bp paired-end reads to the hg19 reference (bowtie2 v2.1.0, (Langmead and Salzberg, 2012)), removed duplicate reads (Picard http://picard.sourceforge.net), and discarded reads with MAPQ < 30. We counted reads overlapping RefSeq genes (collapsed by gene symbol to the longest isoform) — this quantification procedure includes signal both at the paused position (near the TSS) as well as in the gene body. We identified genes showing significant differences in transcription with DESeq2 (Love et al., 2014), excluding genes with zero coverage in all samples and calling significance at Benjamini-Hochberg corrected p-value < 0.05.
To determine whether there were global changes in the total amount of transcription (up or down) that would affect the normalization and analysis of these experiments, we included a spike-in control in three of the four PRO-Seq replicates for each of untreated and treated RAD21-mAC and CMV-OsTIR1 cells. Specifically, we added ~500,000 Drosophila S2 cells at the beginning of the protocol. Upon sequencing of these libraries, we counted the number of spike-in reads by aligning to the Drosophila genome (dmel3) with bowtie2 v2.1.0. We observed similar fractions of reads mapping to the Drosophila spike-in in the matched pairs of degron-expressing and control replicate experiments, indicating that there are not significant global changes in the total amount of transcription upon cohesin loss.
Random Shuffle Annotations—When performing quantitative analyses on our feature annotations, it was frequently desirable to have a “random control” for the feature annotation in question. We generated such annotations through a random permutation procedure. For one-dimensional features, such as peak loci, we randomly placed the one-dimensional features throughout the genome such that (1) the number of features on any one chromosome stayed the same; (2) the random features did not overlap any gaps in the assembly (i.e. centromeres, telomeres, etc.). Similarly, for two-dimensional features (domains, peaks), we randomly placed the two ends of the features across the genome such that (1) the size distribution of the two-dimensional features stayed the same; (2) the number of features on any one chromosome stayed the same; (3) the interval between the ends of the randomized two-dimensional features did not overlap any gaps in the assembly.
Analysis of CTCF and cohesin binding—In order to confirm that degradation of RAD21 resulted in abrogation of full cohesin complex binding to chromatin, we performed ChIP-Seq for RAD21 and SMC1 (see above for experimental details). We visually
confirmed that cohesin binding was significantly diminished (see Fig. 1C). We also analyzed
A
uthor Man
uscr
ipt
A
uthor Man
uscr
ipt
A
uthor Man
uscr
ipt
A
uthor Man
uscr
ipt
the RAD21 and SMC1 signal at all ChIP-Seq peaks called in our data from untreated cells using MACS 2.0. The heatmaps clearly showed that cohesin binding was eliminated upon degradation of RAD21. We saw an average 81% reduction in binding strength of RAD21 (mean enrichment = 12.58 in untreated HCT-116 RAD21-mAC cells; mean enrichment = 2.39 in treated cells) and 75% reduction of SMC1 (mean enrichment = 16.23 in untreated HCT-116 RAD21-mAC cells; mean enrichment = 4.00 in treated cells). Moreover, 97% of peaks called in untreated cells (from a merged list of peaks binding both RAD21 and SMC1) were not called after auxin treatment (Fig. S1C). These results demonstrate that we were able to quickly abrogate cohesin binding to chromatin to near completion using our auxin-inducible degron system.
We also performed ChIP-Seq for CTCF to establish whether CTCF binding was dependent on cohesin binding or not. Visual inspection and analysis of signal at all peaks called in data from untreated cells using MACS 2.0 clearly demonstrated that CTCF remained bound after RAD21 degradation (Fig. 1C,D). The average enrichment at all CTCF binding sites called by ENCODE was 10.89 in untreated cells and 8.93 in treated cells (The difference in enrichment was likely due to differential quality of the immunoprecipitation rather than true biological differences; one of our replicate experiments showed an average increase of CTCF binding after auxin treatment and the other showed an average decrease.) This data supports a model in which cohesin is a member of an extrusion complex that slides across DNA, whereas CTCF finds it binding sites independently of the extrusion complex and acts as an oriented brake to halt extrusion complex translocation.
Analysis of histone modification patterns—We calculated average signal over 5kb bins across the entire genome and correlated signal between ChIP-Seq experiments before and after auxin treatment for each of CTCF, H3K27me3, H3K9me3, H3K4me1, H3K4me3 and H3K27Ac. All modifications showed high correlations before and after auxin treatment (Spearman’s r = 0.80 [CTCF]; 0.95 [H3K27me3]; 0.95 [H3K9me3]; 0.94 [H3K4me1], 0.70 [H3K4me3]; 0.90 [H3K27Ac]; 0.96 [H2.AZ]; 0.94 [H3K36me3]; 0.96 [H3K79me2]; 0.89 [H4K20me3]; 0.95 [H4K16Ac]).
Additionally, we examined overlaps of our ChIP-Seq peak annotations before and after auxin treatment for H3K4me3, H3K4me1 and H3K27Ac. High overlap (90%, 85% and 81% respectively) was seen for all three marks, indicating that the positions of active promoters and enhancers are largely unchanged after cohesin loss (Fig. S1D).
Finally, we examined the positions and enrichments of broad source marks (H3K27me3, H3K9me3, H2AZ, H3K36me3, H4K17Ac, H3K79me2). We called broad domains in our data from untreated cells using RSEG (see above), and identified a high-quality list of boundaries by retaining only the broad domains that were >=100kb in size and restricting to boundaries of these domains where at least a 50% change in signal across the boundary was seen (when averaging over the 50kb upstream and downstream of the boundary). We identified 2907 such boundaries for H3K27me3, 2647 boundaries for H3K9me3, 6356 boundaries for H2.AZ, 4829 boundaries for H3K36me3, 2515 boundaries for H4K16Ac, and 3634 boundaries for H3K79me2. We then extracted the data +/− 200kb from the boundary in both untreated and auxin-treated cells for each mark. The heatmaps and average profiles
A
uthor Man
uscr
ipt
A
uthor Man
uscr
ipt
A
uthor Man
uscr
ipt
A
uthor Man
uscr
ipt
across the boundaries called in untreated cells indicated that the positions of the boundaries was unchanged after auxin treatment (i.e. there was no spreading of histone modifications) and the average enrichments of histone modifications over the broad enriched domains were unchanged (Fig. S1E).
Taken together, these results suggest that histone modification patterns are largely unaffected by loss of cohesin.
Evaluation of loops and loop domains—We used HiCCUPS to calculate local enrichments on treated maps for the 3,170 loops we annotated with HiCCUPS in untreated maps. No loop showed at least 1.3-fold enrichment over local backgrounds and <30% FDR q-value. This clearly demonstrates that the vast majority of looping is lost after cohesin degradation.
We identified loop domains as in (Rao et al., 2014), by searching for loop-domain pairs where the peak pixel was within the smaller of 50kb or 0.2 of the length of the domain at the corner of the domain. Using this procedure, we identified 2,140 loop domains in untreated cells and only 9 in treated cells. Of the 9, 8 were false positives due to rearrangements in HCT-116 cells and one was a false positive due to extensive compartmentalization that was mistakenly annotated as a loop by HiCCUPS. Notably, the high false discovery rate after auxin treatment is due to the very small number of true positives (in this case, no detectable true positives). The false discovery rates of HiCCUPS and Arrowhead before auxin treatment were comparable to the FDRs documented in (Rao et al., 2014). This clearly demonstrates that loop domains are lost after cohesin degradation.
We also assessed the loss of loop domains and loops via aggregate peak analysis (APA). We used default parameters at 10kb resolution, excluding loop domains and loops within 300kb of the diagonal to avoid distance decay effects and extracting a 200kb by 200kb submatrix around every loop domain or loop. In aggregate, the signal from loop domains and loops was clearly and completely lost after auxin treatment: the APA score (fold-enrichment of the peak pixel over the mean value of the 36 pixels in the 6×6 box in the lower left of the aggregate matrix) went from 2.10 to 0.78 for loop domains and 2.09 to 0.78 for all loops. (The APA scores <1 after treatment are expected since random pixels would show an APA score <1 because of the contact probability distance decay.) All visual signs of looping and domain formation were also lost in the aggregate matrices (Fig. S2C). In addition, we confirmed that the loss of loops/loop domains was not a result of any cell cycle effects; we visually observed loss of loop domains after auxin treatment in G1/S arrested cells (Data S1, I.H-L) and observed similar results to above via APA (Fig. S2C).
In order to assess the dynamics of loop and domain formation we used APA and aggregate domain analysis (ADA) to assess loop, loop domain, and domain strength across a time course of auxin treatment and withdrawal.
ADA uses the same principle of aggregating submatrices across a feature list, but instead of calculating a score representing the focal enrichment of a peak pixel against pixels to its lower left (the APA score), we calculate a score representing the enrichment of contacts just
A
uthor Man
uscr
ipt
A
uthor Man
uscr
ipt
A
uthor Man
uscr
ipt
A
uthor Man
uscr
ipt
inside the domain boundaries over the contacts just outside the boundary, i.e. a gradient across the boundary. More specifically, we compare the average contacts in the pixels [i+3, j-13:j-3], [i+4,j-12:j-2], [i+5,j-11:j-1], [i+1:i+11,j-5], [i+2:i+12,j-4], [i+3:i+13,j-3] (the inside domain pixels) to the pixels [i-5,j-21:j-11], [i-4,j-20:j-10], [i-3,j-19:j-9], [i+11:i+21,j +5], [i+10:i+20,j+4], [i+9:i+19,j+3] (the outside domain pixels) where (i,j) is the center of the aggregate matrix (i.e. the corner of the domains). Here, we extracted a 200kb by 200kb matrix at 5kb resolution around every domain corner.
For APA on the time course experiments, as with the APA on our deep maps, we used default parameters at 10kb resolution.
In Fig. 2B, we show the APA scores for all loop domains greater than 300kb in size. The APA scores demonstrate that after cohesin is degraded, loop domains are completely lost between 40–60 minutes after treatment. From our own imaging (Fig. S1A,B) and imaging performed in Natsume et al. (2016), we know that the half life of cohesin after auxin treatment is about 20 minutes. Thus, loop domains are lost within minutes of cohesin degradation, indicating that cohesin is required for active maintenance of loop domain structures, not just establishment. After withdrawal of auxin, loop domains form similarly quickly, with strong loop domain signal by 60 minutes after withdrawal. This time includes the time for cohesin levels to recover and thus likely represents a very conservative upper bound on the time required for loop domain formation. Additionally, it indicates that loop domain structures are dynamically maintained during interphase.
In Fig. S2B, we show similar results for all loops greater than 300kb in size called in untreated cells. Additionally, we show ADA scores for all contact domains larger than 300kb in size called in untreated cells. While the ADA scores for all domains show a sharp decline in the first 60 minutes after auxin treatment, they plateau above 1, indicating some residual domain signal from al domains. Since, as we noted in (Rao et al., 2014), not all domains are loop domains, this suggest residual retention of non-loop domains. As we noted in (Rao et al., 2014), non-loop domains are usually created by compartment intervals. The retention of compartment domains is discussed below.
Analysis of previous cohesin-depletion Hi-C data sets—Previous Hi-C studies after cohesin or CTCF depletion showed limited effects, with both contact domains and compartments present after depletion (Seitan et al., 2013; Sofueva et al., 2013; Zuin et al., 2014). However, in these studies, the authors performed low resolution Hi-C experiments, raising the possibility that either (i) the authors could not resolve the difference between loop domains (which disappear after cohesin loss) and compartment domains (which remain) due to resolution issues, or (ii) incomplete depletion of cohesin or CTCF led to modest phenotypes. The authors in all three studies acknowledge the possibility that the limited effects they see may have been due to incomplete depletions.
To test this hypothesis, we re-analyzed data from these three studies. We downloaded the raw fastqs for all Hi-C experiments performed in the studies and processed them with Juicer (in exactly the same way that we processed all the Hi-C data generated for this study. Although the experiments did not have sufficient resolution to visualize individual loops, we
A
uthor Man
uscr
ipt
A
uthor Man
uscr
ipt
A
uthor Man
uscr
ipt
A
uthor Man
uscr
ipt
looked for the statistical signal of loop enrichment in aggregate using APA (Durand et al., 2016b; Rao et al., 2014). For the mouse data sets generated in Seitan et al. and Sofueva et al., we used a loop list we had previously generated in CH12-LX mouse lymphoblast cells (Rao et al., 2014) with the added filter that we removed loops with >4.5 enrichment over local background in order to stay consistent with the methods used in this study (see above). For the human data sets generated in Zuin et al., we used the loop list of 3,170 loops in untreated HCT-116 RAD21-mAC cells described above. We observed positive APA scores (>1) and visible focal enrichment in all experiments generated in previous studies, before and after cohesin or CTCF depletion (Fig. S2C). By contrast, our maps after auxin treatment show complete loss of APA signal and no visible focal enrichment, even when APA is performed on low resolution data sets (Fig. 2B, S2C). In previous studies, the APA score was weaker after cohesin or CTCF depletion but still clearly visible and notably, positive APA signal was seen in every replicate experiment performed in previous studies. Taken together, this suggests that a major confound of previous studies was the incomplete depletion of cohesin or CTCF, and along with the low resolution of the Hi-C experiments, likely explains the limited effects seen.
Evaluation of the dynamics of loop domain formation—In order to better understand the process of loop domain reformation, we utilized loop-resolution Hi-C datasets generated after 6 hours of auxin treatment and 20, 40, 60 or 180 minutes of auxin withdrawal. We sequenced 951M, 952M, 909M, and 949M reads from each of the timepoints respectively. We then converted our list of loop domains identified in untreated RAD21-mAC cells (generated at 5kb, 10kb and 25kb resolutions) into a standard 25kb resolution, by identifying the 25kb pixel containing the peak pixel as well as the 8 25kb pixels around it, and assigning the new 25kb peak pixel as the one of nine containing the most contacts. (We analyzed the 9 25kb pixels rather than just the 25kb pixel containing the original peak pixel in order to account for small amounts of noise in the peak localization.) Using this list of 1,988 loop domains at 25kb resolution (leaving out loop domains <100kb in size which are more difficult to analyze at 25kb resolution), we used HiCCUPS to identify the observed and local expected values for all peak pixels in our untreated, auxin treated, 20 min withdrawal, 40 min withdrawal, 60 min withdrawal, and 180 min withdrawal data sets. In order to compare between datasets of different sizes, we scaled the observed and expected values for each map down by a scalar factor equal to the (# of contacts in the map/# of contacts in the 20 min withdrawal map). (The 20 min withdrawal map was our lowest sequencing depth map.) For each loop domain, we constructed a recovery curve, setting the number of observed contacts in the untreated map as 1, the number of observed contacts in the auxin treated map as 0, and (observed – [6hr treat observed])/([no treat observed] – [6hr treat observed]) as the value at every other time point (Fig. 2C). (Similar results were observed if we used an observed/local expected metric, or a z-score metric [(observed-local expected)/sqrt(local expected)]; data not shown.)
To rank loop domains by speed of recovery, we utilized a metric where we calculated the difference between the loop domain’s recovery at a particular time point and the recovery of the median loop domain at that time point. We calculated this value for all loop domains at the 40 minute and 60 minute time points and summed the two to get a recovery score for