HAL Id: hal-02396103
https://hal.archives-ouvertes.fr/hal-02396103
Submitted on 11 Dec 2020
HAL is a multi-disciplinary open access
archive for the deposit and dissemination of
sci-entific research documents, whether they are
pub-lished or not. The documents may come from
teaching and research institutions in France or
abroad, or from public or private research centers.
L’archive ouverte pluridisciplinaire HAL, est
destinée au dépôt et à la diffusion de documents
scientifiques de niveau recherche, publiés ou non,
émanant des établissements d’enseignement et de
recherche français ou étrangers, des laboratoires
publics ou privés.
Inserting polarization processes in a fluid charge
transport model: Improvements and difficulties
M. Hoang, Séverine Le Roy, G. Teyssedre, Laurent Boudou
To cite this version:
M. Hoang, Séverine Le Roy, G. Teyssedre, Laurent Boudou. Inserting polarization processes in a fluid
charge transport model: Improvements and difficulties. 2018 12th International Conference on the
Properties and Applications of Dielectric Materials (ICPADM), May 2018, Xi’an, China. pp.332-335,
�10.1109/ICPADM.2018.8401057�. �hal-02396103�
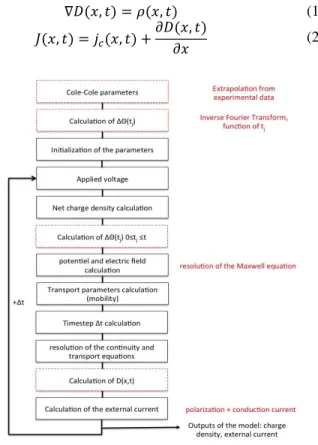
Fig. 1: Evolution of the algorithm of the fluid model taking into account the orientation polarization contribution.
Inserting Polarization Processes in a Fluid Charge
Transport Model: Improvements and Difficulties
M.Q. Hoang
Hanoi University of Industry Hanoi, Vietnam
S. Le Roy*, G. Teyssedre, L. Boudou,
Laplace, CNRS and University of Toulouse, France;
Abstract- Understanding the space charge behaviour in solid organic insulations under thermo-electrical stress is of particular interest as charge dynamics is closely related to electric field distortion, charge accumulation and at last to materials ageing. Many polymers used as electrical insulators are polar materials, and have a non-linear behaviour as regards conduction processes. Hence, the underlying physics is not easily accessible and understandable. A charge transport model coupled with relaxation functions has been developed recently. In this paper, a comparison between the experimental measurements and the simulation results extracted from the coupled models is proposed, for two different materials: a polar material (PEN) and a weakly polar material (LDPE).From these results, we discuss the issues related to the prediction of the thermo-electrical behaviour of solid organic insulating materials, when the difficulty arises not only from the experimental observation (i.e. separating polarisation from transport processes), but also from the mathematical treatment required for modelling.
I. INTRODUCTION
When a solid organic insulator is subjected to thermo-electrical stress, not only space charge generation takes place. Dipoles are also responsible of some characteristic signatures, which can disturb the material homogeneity and hence enhance the electric field at specific places. Modelling relaxation functions is not new, but linking polarization response to charge transport model is a challenging task, as it requires to correctly characterize the permittivity variation over a large range of temperature and frequency, and to insert it in the fluid model, both being solved in the time domain.
In this paper, we propose a way to characterize the dipolar response –called polarization response in the following of the text-, by means of dielectric spectroscopy –DS- measurements and a fit of this response with the help of Cole-Cole functions. An inverse Fourier transform allows then obtaining the polarization characteristics in the time domain and to add it to a charge transport model. Validation of the charge transport/polarization is then performed by applying it to poly(ethylene naphthalate) - PEN, a polar material, with good agreement. The results also show the equivalence for this material between frequency-domain measurements (Dielectric Spectroscopy-DS) and time-domain measurements (Alternate Polarization Current - APC) as regards the polarization response. On the contrary, there is no agreement between these techniques for Low Density polyethylene (LDPE), a non polar material. Because of this non-equivalence, only a partial validation of the model could be performed on LDPE.
II. COUPLING POLARIZATION FUNCTIONS TO CHARGE
TRANSPORT MODEL
A one dimensional, fluid, bipolar charge transport model, largely proposed in the literature [1-3], has been used to simulate charge transport and polarization processes in PEN [4-5]. The fluid model features electronic charges generation (electrons and holes), transport through a hopping mobility for each kind of carrier, trapping and detrapping of charges in a unique level of deep traps and charge recombination. An algorithm of the global model (charge transport + polarization) is given in Fig. 1. To account for polarization processes in the model, it is necessary to implement the variation of the permittivity in the equations governing the model.
Hence, the Poisson equation and the external current equation need to be replaced by the Maxwell-Gauss and the Maxwell-Ampere equation respectively, of the form (in 1D):
(1)
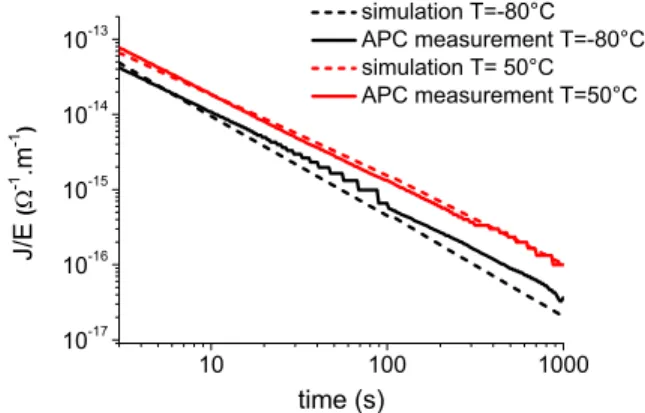
Fig.2: Comparison of the normalized current densities as a function of time for different temperatures, measured experimentally with the APC and simulated using the charge transport model, for a PEN sample of
thickness 25 µm. Situation where only polarization processes are relevant.
where is the net charge density, function of time and space, and is the local conduction current. D(x,t) is the electrical displacement which includes the polarization, and is given in the frequency domain by:
(3) with E the electric field, the vacuum permittivity and the material permittivity. In the present study, this permittivity has been measured using Dielectric Spectroscopy (DS), and is then fitted for each polymer, using Cole-Cole functions of the type: (4)
n is the number of relaxations, and , , and are the Cole-Cole parameters (3 per relaxation function), that need to be fitted for each material and are all temperature dependent. Including equation (4) into equation (3) gives:
(5)
One has to note that the permittivity variation, hence the electrical displacement, is in the frequency domain, whereas the charge transport model only runs in the time domain. An inverse Fourier transform is then necessary to change the polarization response from frequency domain to time domain. Special care should be taken during this data treatment on the sampling representativeness between frequency- and time-domain. At last, applying the Laplace transform, the electric displacement is obtained, and is of the form:
(6)
Simulations using the global model including charge transport and polarization processes can then be performed for any solid insulator, as long as DS measurements have been performed to obtain the permittivity data. It is to note that running such model is time consuming, as the polarization function needs to be calculated at each time step, the permittivity being function of the sample history.
Alternate Polarization Current measurements (APC) [6] have been performed for each polymer under study (i.e. LDPE and PEN) to validate the model at low fields and temperatures, where it is supposed that polarization processes are dominant over conduction processes. For higher applied fields, i.e. when both physical processes (transport and polarization) are observable experimentally, the model validation is performed with the help of conduction current measurements.
III. MODEL VALIDATION FOR PEN, A POLAR MATERIAL
In a first attempt, PEN, a polar material, has been chosen to validate the procedure for inserting polarization in the charge transport model. This PEN, provided by DuPont Teijin Films Co under the commercial name TEONEX® Q51, is semi-crystalline [7]. DS measurements have been performed to characterize the polarization processes in PEN and the related relaxation functions have been defined [4] in the time domain, using the previously proposed procedure. Validation of the charge transport model including polarization processes is done by comparing simulated external currents with experimental APC currents measured at low fields (around 0.053 kV/mm), where the main physical process remains polarization. These results are presented in Fig. 2 for two temperatures, -80°C and 50°C. The model outputs globally show a good agreement with the experiment for the range of temperatures and times under study. This result demonstrates that the polarization response can be measured equally in the time or in the frequency domain, leading to the same signature in the time domain, for PEN. It also allows validating the data processing implemented for conversion from frequency-domain to time frequency-domain.
Current density measurements have then been performed on PEN samples under higher electric fields and temperatures, where both polarization processes and conduction processes are at play. Fig. 3 shows the conduction current measurements and the simulated current arising from the charge transport model, as a function of time for an applied electric field of 30 kV/mm and for different temperatures, ranging from 25°C to 90°C. The simulation results show a relatively good agreement compared to the experimental ones. This is all the more true that temperature is high. At room temperature, the simulation is far from the experiment, for times above 10 s. This has already been attributed to the fact that at this temperature and low frequencies (around 10-3 Hz to match our time domain measurements), two relaxation functions are at play, and it remains difficult to extrapolate two relaxation functions at the same time over a so wide frequency range [4]. For higher
Fig. 4: Comparison of the normalized current densities as a function of time at T=25°C, measured experimentally with the APC and simulated using the charge transport model, for a LDPE sample of thickness 130
µm. Situation where only polarization processes are relevant. Fig. 3: Comparison of the simulated and experimental current densities as
a function of time for an electric field of 30 kV/mm and different temperatures, for a PEN sample of thickness 25 µm.
For parameters of the model see [4].
temperatures, the simulation results are close to the experimental results.
IV.MODEL VALIDATION FOR LDPE, A WEAKLY POLAR
MATERIAL
Low Density Polyethylene (LDPE) has also been chosen to validate the global model as a large number of papers have been published in the literature on modelling charge transport in LDPE, such that the parameters (mobility, barrier injection...) necessary to run the charge transport model are already known [1] and secondly it is a quasi non-polar material.
The same protocol has been used to obtain the permittivity variation for LDPE in the frequency-domain, i.e. DS measurement, fit of the results with the help of Cole-Cole functions, and an inverse Fourier transform. A validation of the model is first performed at T=25°C and low field, a temperature and field range where polarization is expected to be dominant. A comparison of the APC normalized current density and the simulated one is proposed as a function of time in Fig. 4. The difference between the simulated current, arising from DS measurements, and the APC measurements is of the order of two decades. This is unexpected, as the equivalence frequency-domain/time-domain has been previously demonstrated for PEN.
In order to confirm the results, other DS data on LDPE have been taken from the literature [8], and the dipolar response has been fitted and included in the global model. The related normalized current density is also presented in Fig. 4. Comparing the DS results indicate that there is at least one decade difference between our results and those from [8]. Although the material (LDPE) can differ from one batch to another, it is still difficult to understand such difference. The comparison between APC measurements and the two treated DS measurements confirms that in the case of LDPE, no equivalence can be done between the frequency and the time domain. The fact that LDPE is a quasi non-polar material could be one of the causes at the origin of the differences observed between the different experiments. The polar
response is due residual oxidized groups of the main chains, and/or to external molecules like moisture. Differences in experimental conditions on moisture do not appear in an evident way as all measurements were realized under dry atmosphere with identical gold electrodes.
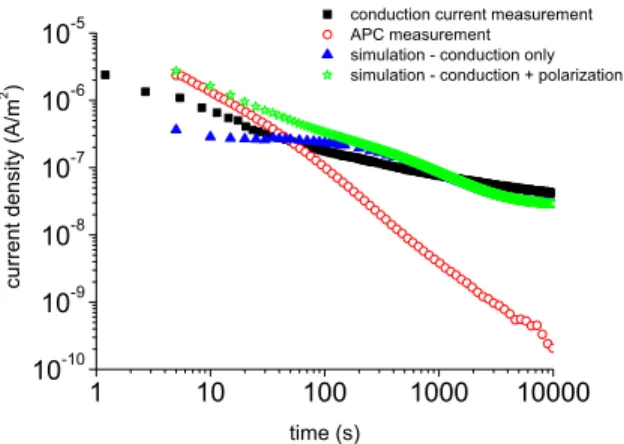
Anyway, the simulation protocol adopted to add the polar response in a charge transport model is not adapted to LDPE. One of the main questions that arise from these measurements is if one of them is really able to measure correctly the polarization response. One can also question the reliability of the APC measurement results, giving a response so high in terms of orientation polarisation compared to the other two methods. Charging current measurements at relatively high field (40 kV/mm) and room temperature have been performed on the same LDPE, and are compared to APC measurements in Fig. 5. Charging current densities and APC current densities are very close at short times (< 100s), i.e. when dipolar response is dominant, and the current differ all the more when time increases, i.e. when conduction becomes dominant for charging current measurements. Although both techniques measure currents in the time domain, the experimental protocol is very different and it was not straightforward to obtain the same kind of results. This tends to show that APC is able to measure the transient DC response of the material. One can however not let aside the possibility that both methods do not measure polarization but another physical process. The frequency to time domain conversion has been achieved through extension of the dielectric response to low frequency. There is possibly a break in the temperature-frequency master curves shift due to activation of processes under DC that are not active at standard AC frequencies.
A simulation has been performed on this material for an electric field of 40 kV/mm and a temperature of 25 °C using the charge transport model with an optimized set of parameters [1]. As it was not possible to further validate our protocol to extract the polarization response from DS measurements for LDPE, polarization has been taken into account in the model only by adding the APC current density to the simulated conduction current in the external current
Fig. 5: Comparison of the simulated and experimental current densities as a function of time for an electric field of 40 kV/mm and a temperature
of 25°C, for a LDPE sample of thickness 150 µm. Parameters of the model see [1].
density (see Fig. 5). Doing so, the simulated current density has the same shape and the same order of magnitude as the experimental data. Again, this 'trick' does not validate our process of characterizing the polarization response in the time domain for LDPE, and the question remains as to know what physical process is at play in this material at short times.
V. CONCLUSION
A protocol of characterization and modelling of the dipolar contribution to the DC transient response of dielectrics has been put forward in this paper. Using DS measurements, a fitting to Cole-Cole relaxation functions, and an inverse Fourier transform, it allows obtaining the permittivity variation in the time domain. This permittivity variation is then inserted in a charge transport model, and the global model has been validated at low field and at high fields for PEN, a polar material with a strong dipolar response. The validation has however not been achieved for LDPE, a weakly
polar material, where DS measurements fails to predict the low field dielectric response in the time domain. More materials (polar and less polar) need to be tested in order to be able to conclude whether this evolution of the model is suitable for most of the materials. Moreover, more work needs to be done on the measurement part, to conclude on the relevance of APC measurements over DS ones.
ACKNOWLEDGMENT
This work was supported by the Agence Nationale de la Recherche (ANR) within the ModElec project ANR-11-JS09- 009-01.
REFERENCES
[1] S. Le Roy, G. Teyssedre, C. Laurent, G.C. Montanari and F. Palmieri, 'Description of charge transport in polyethylene using a fluid model with a constant mobility: fitting model and experiments', J. Phys. D.: Appl. Phys., Vol. 39, pp.1427-1436, 2006.
[2] J. Xia, Y. Zhang, F. Zheng, Z. An and Q. Lei, 'Numerical analysis of packet like charge behavior in low-density polyethylene by a Gunn effect like model', J. Appl. Phys., Vol. 109, p.034101, 2011.
[3] Z. Lv, X. Wang, K. Wu, X. Chen, Y. Cheng and L.A. Dissado, 'Dependence of charge accumulation on sample thickness in nano-SiO2 doped LDPE', IEEE Trans. Dielectr. Electr. Insul., Vol. 20, pp. 337-345, 2013.
[4] M.Q. Hoang, S. Le Roy, L. Boudou and G. Teyssedre, 'Implementation of polarization processes in a charge transport model applied on poly(ethylene naphthalate) films', J. Appl. Phys., Vol. 119, p.224105, 2016.
[5] M.Q. Hoang, L. Boudou, G. Teyssedre and S. Le Roy. 'Modelling polarization and conduction processes in poly(ethylene naphthalate)',
Mater. Res. Express, Vol. 4, p.085304, 2017.
[6] C. Escribe-Filippini, R. Tobazéon and J.C. Filippini, 'Conduction
characterization of polymer films using the alternate square wave method', 7th IEEE International Conference on Solid Dielectrics (ICSD
Eindhoven, the Netherlands), pp. 315-318, 2001. [7] http://www.dupontteijinfilms.com.
[8] E. Logakis, L. Petersson and J. Viertel, 'Dielectric spectroscopy and
thermally stimulated depolarization current investigations in low density polyethylene', Proc. 11th IEEE International Conference on Solid