HAL Id: hal-01704679
https://hal.archives-ouvertes.fr/hal-01704679
Submitted on 8 Feb 2018
HAL is a multi-disciplinary open access
archive for the deposit and dissemination of
sci-entific research documents, whether they are
pub-lished or not. The documents may come from
teaching and research institutions in France or
abroad, or from public or private research centers.
L’archive ouverte pluridisciplinaire HAL, est
destinée au dépôt et à la diffusion de documents
scientifiques de niveau recherche, publiés ou non,
émanant des établissements d’enseignement et de
recherche français ou étrangers, des laboratoires
publics ou privés.
Traumatic Brain Lesion Quantification based on Mean
Diffusivity Changes
Christophe Maggia, Thomas Mistral, Senan Doyle, Florence Forbes,
Alexandre Krainik, Damien Galanaud, Emmanuelle Schmitt, Stéphane
Kremer, Irène Troprès, Emmanuel Barbier, et al.
To cite this version:
Christophe Maggia, Thomas Mistral, Senan Doyle, Florence Forbes, Alexandre Krainik, et al..
Trau-matic Brain Lesion Quantification based on Mean Diffusivity Changes. Brainlesion: Glioma, Multiple
Sclerosis, Stroke and Traumatic Brain Injuries, BrainLes (MICCAI), 10670, Springer, pp.88-99, 2018,
Lecture Notes in Computer Science, �10.1007/978-3-319-75238-9_8�. �hal-01704679�
Traumatic Brain Lesion Quantification based on
Mean Diffusivity Changes
Christophe Maggia1,2,3, Thomas Mistral1,2,3, Senan Doyle4, Florence Forbes2,5,
Alexandre Krainik1,2,3, Damien Galanaud6, Emmanuelle Schmitt7, St´ephane
Kremer8, Ir`ene Tropr`es2,3,9,10, Emmanuel Barbier1,2, Jean-Fran¸cois Payen1,2,3,
Michel Dojat1,2
1 INSERM, U1216, F-38000 Grenoble, France 2
Universit´e Grenoble Alpes, GIN, F-38000 Grenoble, France
3 CHUGA, F-38000 Grenoble, France 4
Pixyl, F-38000 Grenoble, France
5
Inria, MISTIS, F-38330 Montbonnot, France
6
APHP, Hopital Piti´e Salp´etri`ere, F-75000 Paris, France
7
CHU, Hopital Central, F-54000 Nancy, France
8 CHU de Strasbourg, F-67000 Strasbourg, France 9
CNRS, UMR 3552, F-38000 Grenoble, France
10 INSERM, U17, F-38000 Grenoble, France
Abstract. We report the evaluation of an automated method for quan-tification of brain tissue damage, caused by a severe traumatic brain injury, using mean diffusivity computed from MR diffusion images. Our automatic results obtained on realistic phantoms and real patient images 10 days post-event provided by nine different centers were coherent with four expert manually identified lesions. For realistic phantoms automated method scores were equal to 0.77, 0.77 and 0.83 for Dice, Precision and Sensibility respectively compared to 0.78, 0.72 and 0.86 for the experts. The inter correlation class (ICC) was 0.79. For 7/9 real cases 0.57, 0.50 and 0.70 were respectively obtained for automated method compared to 0.60, 0.52 and 0.78 for experts with ICC=0.71. Additionally, we detail the quality control module used to pool data from various image provider centers. This study clearly demonstrates the validity of the proposed au-tomated method to eventually compute in a multi-centre project, the lesional load following brain trauma based on MD changes.
1
Introduction
In Europe, the incidence of hospitalization in intensive care units (ICUs) for fatal traumatic brain injury (TBI) is about 235 per 100,000 inhabitants [14]. Despite substantial efforts made over the past decades, the mortality rate fol-lowing severe TBI, as defined by an initial Glasgow Coma Scale (GCS) score of less than 9, ranges between 30% and 50%, and only 20% of these patients will not have lasting disabilities [15]. Timely evacuation of mass lesions and strict avoidance of conditions known to aggravate primary brain injury, such as arte-rial hypotension, systemic hypoxia, or severe hypocapnia form the mainstays of
current management of severe TBI patients hospitalized in ICUs. OxyTC, a ran-domized controlled multi-centre trial (22 centers, objective of 400 patients), was initiated in 2016 to assess the impact of a new therapeutic strategy for severe TBI patients. The study continuously monitors brain tissue oxygenation using brain tissue O2pressure probes (PbtO2) surgically inserted into the parenchyma
to facilitate the detection of brain ischemic/hypoxic episodes and adapt conse-quently the therapy. Brain lesion volume is considered to be a clinically relevant criterion [1], and its evolution was analyzed to determine the efficacy of the ther-apeutic strategy. MRI is an excellent modality for estimating global and regional alterations in TBI and for following their longitudinal evolution [2]. Mean Dif-fusivity (MD) or Apparent Diffusion Coefficient (ADC) have been widely used to determine the volume of ischemic tissue [12]. A reduction of MD is related to cytotoxic edema while an increase of MD indicates a vasogenic edema [13]. A few papers address the quantification of brain damage following severe TBI [6] especially in acute phase i.e. less than ten days post-injury [13]. No evalua-tion of automatic quantificaevalua-tion methods compared to manual delineaevalua-tion was reported. In this paper, we report the extensive evaluation of an existing au-tomated method for quantification of brain tissue damage based on MD values [9]. We used both ground truth images (realistic phantoms) and real patient images 10 days post-event. Automated and manual delineations from 4 senior neuroradiologists (AK, DG, SK and ES) were then compared. Ultimately, our goal is to use the validated automated method for processing the large set of images provided by the OxyTC multi-centre study. A specific quality control pipeline was then designed to deal with the artefacts that may be present in the MR images coming from various scanners (3 different constructors, 9 different models). The quality pipeline coupled with our automatic segmentation method defines a valid methodology for our on-going multi-centre study.
2
Material and Methods
The study was approved by the Institutional Review Board at the Hospital of Grenoble and informed consents were obtained prior to participation directly from the participants (controls) or next of kin (patients).
2.1 Datasets
Two types of datasets were used for an appropriate evaluation noted hereafter denoted by DS1 and DS2.
DS1: Realistic Phantoms. To overcome the absence of a gold standard, syn-thetic realistic lesions were manually inserted by a neuroradiologist (TM) in five healthy DTI acquired on a Philips Achieva 3.0T TX at the IRMaGe MRI fa-cility (Grenoble, France; sequence parameters are indicated below). The range of multiplying coefficients applied to normal MD values was between 0.45 and 2.2, simulating cytotoxic (low MD) and vasogenic (high MD) edemas. Gaussian
filtering was applied to increase realism. These five cases constituted our gold standard (see Figure 2). Normative values were calculated on seven different control DTIs acquired in the same conditions.
DS2. Patients. Nine patients with a diagnosis of severe trauma were con-sidered (GCS < 9). FLAIR, 3D-T1w, T2* and DTI images were acquired in 9 centers (one per patient) on different scanners (3T and 1.5T) with a standardized acquisition protocol including slight differences depending on the scanner (main 3T parameters FLAIR: TR/TE/TI:5000/390/1800 ms, 27 contiguous slices, 1 mm3; 3D T1-weighted sequence: MPRAGE,TR/TE/TI: 2300/2/900 ms, 1x1x1 mm3; T2*: TR/TE:2200/16 ms, flip angle: 16 deg, 1x1x2 mm3; and axial DTI:
TR/TE: 9800/80, 2 mm3, 32 directions with a value of 1000 mT/m). A series
without the diffusion gradient (the B-zero image) and a series with a phase en-coding direction inversion were acquired for correction of spatial distortion. For each center, normative values were calculated on three control DTIs acquired in the same conditions.
2.2 Image Processing
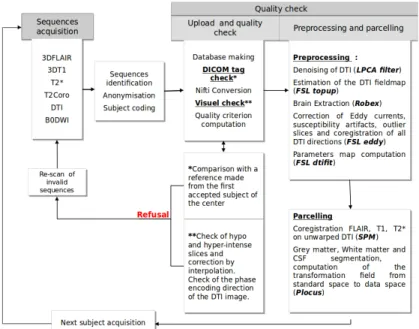
Quality Control. To maximize data quality we adopted the same types of MR images in each center and harmonized MR acquisition protocols across sites. However, several factors were site-dependent such as magnetic field strength (1.5T or 3T), equipment manufacturers and models. Consequently, acquisition protocols had to be adapted depending on the scanner characteristics. All these factors may impact the MD measurement across scanners. Moreover, DTI is very sensitive to a number of imaging artefacts, in particular spatial distorTions that vary depending on the acquisition conditions. A specific pipeline (see Figure 1) was therefore developed to check for the quality of the images coming from different centers. All DICOM tags were compared to a center-specific reference validated by a MR physicist (IT). Any change in a crucial sequence parameter (e.g. Echo Time for DTI) led to exam rejection. DTI were denoised [11] and hypo or hyper-intense slices were automatically detected. A visual check was performed to detect unusual artifacts. When necessary, artifacted slices were corrected by interpolating adjacent slices. If too many artifacted slices were present, the corresponding exam was rejected. DTI were then preprocessed us-ing FSL1 for geometric distortion correction. Two DWI images with opposite
phase encoding directions were acquired to compute a fieldmap and correct the susceptibility artifacts. For the automated method, T1-weighted, FLAIR and T2* images were realigned to the corresponding corrected DTI image. The two former sequences were then processed using P-LOCUS, a Bayesian Markovian approach for tissue and CSF segmentation [3].
Processing. The diffusion tensor was estimated, and the local diffusion pa-rameter MD was calculated for the entire brain for each patient and control
1
Figure 1. Scheme describing all the quality control steps.
using FSL. This parameter was computed from the three estimated eigenvalues that quantify the parameters of water diffusion in three orthogonal directions. Brain extraction was performed by the Robex software1 using T1-weighed im-ages. During segmentation process, P-LOCUS estimated the deformation field to register the atlas in standard space to patient’s brain in individual space. Coupling ROBEX extraction with P-LOCUS deformation estimation allowing the handling of cases exhibiting large skull deformations as observed in severe TBI.
Automatic Approach (AA). The automated lesion segmentation technique (see [9] for details) was based on an outlier detection, inspired from the Pot-hole and Molehills method [17], using a multi-atlas technique to detect outliers as voxels departing from normative values. Given the variability in the spatial extent and the magnitude of the injury in case of severe TBI, the use of values averaged from large regions of White Matter (WM) would not allow the accu-rate detection of ‘abnormal’ values. Indeed, if the lesions are focal, the detection power is hampered by the averaging with healthy tissue values. The standard way is to use an atlas-based approach where MD at each voxel is compared with normative values computed from homogeneous regions of interest (ROIs) of a healthy volunteer’s brain acting as a reference. We assume MD values to be homogenous inside well defined regions of interest (ROIs) that are used to de-fine local normative values. To divide the brain we combined four atlases found
1
in the literature: Neuromorphometrics atlas1, HarvardOxford atlas provided by
FSL and Desikan provided by FreeSurfer2 to identify cortical and sub-cortical
regions (mainly grey matter, GM), and ICBM DTI81 atlas to subdivide WM. In case of multiple labels for one voxel, ICBM labels were always selected. In ICBM, mainly used in tractography studies, only tracks, a tiny part of the WM volume, are labeled. We automatically divided the remaining WM volume into small ROIs. Likewise, for the Neuromorphometrics atlas, large GM parcels were also subdivided. At the end we considered six parcellisations leading to 1402 dif-ferent ROIs (see Figure 2). Given that MD value distribution is not gaussian we used two different thresholds for outliers (lesions) detection: percentile-based and size-based. By fixing percentile thresholds α1 for minimal and α2 for maximal values, we identified clusters of extreme values. The skewness of the distribution is directed toward high values of MD and knowing these values are a marker of cell death and vasogenic edema, which are very frequent in severe TBI, we used a more lenient threshold for α2. We considered lesions as clusters with a size higher than a threshold β1 for low MD and β2 for high MD based on differences we observed between vasogenic and cytotoxic edema. Voxels labeled as CSF, ventricles and hemorrhagic lesion were automatically excluded. Hem-orrhagic lesions were detected using T2* images. Partial volume effect observed in MD may generate an incomplete CSF detection and a large number of false positives. Then, using a distance map, voxels close to CSF (≤4mm) were not considered for segmentation. The parameters were empirically set on control data: α1 was fixed at the 2nd percentile, α2 at the 94.8th percentile, β1 and β2 at 20 and 15 contiguous voxels respectively (i.e. 160 and 120 mm3). Because we introduced six parcellisations, each voxel belonged to six different ROIs, each with a corresponding MD values distribution. A voxel was considered as outlier (with low or high MD) when labelled as abnormal based at least on four atlases.
Manual Approach (MA). To quantify the volume of lesions, four neuroradi-ologists (AK, DG, SK and ES) with extensive experience in lesion assessment, manually segmented the lesion area for DS1 dataset. Three of them (AK, DG and SK) manually segmented DS2 dataset. They followed the same delineation pro-tocol and used the ITK-SNAP software3. Focal lesions included any local regions
of abnormal signal in the MD map. Low and high MD values were separately labeled.
Statistical analysis. Spatial agreement was quantified with the Dice Met-ric (DM), Average SymmetMet-rical Surface Distance (ASSD), the Hausdorff Dis-tance (HD) and precision and recall (sensitivity) (see the corresponding formu-las here4). Note that the standard HD is set by the maximum of the minimum
1 http://www.neuromorphometrics.com/ 2 https://surfer.nmr.mgh.harvard.edu/ 3 http://www.itk.org 4 http://www.isles-challenge.org/ISLES2015/
distance values between two volume’s surface points. A few outliers may greatly perturb the distance measure even though the two volumes may appear very close. A way to limit this effect is to introduce a modified HD based on a ranked distance [4]. We computed such a modified HD distance based on the 95th per-centile. We computed using Staple (ST) [16] an estimation of the manual seg-mentation based on the four rater’s results. We quantified volumetric association between manual and automated lesion delineation by computing the Pearson cor-relation [5]. Intra Class Corcor-relation (ICC) was computed on volumes to assess consistency between raters and, between raters and the automated method.
Figure 2. Six parcellisations based on four atlases. a: HavardOxford + WM parcels size ≤32cm3.185 ROIs. b; Desikan atlas. 181 ROIs. c: Neuromorphometrics atlas + ICBM DTI181 + WM parcels size ≤12cm3. 244 ROIs. d: Neuromorphometrics atlas
+ GM parcels size ≤5cm3. 292 ROIs. e: Neuromorphometrics atlas + WM parcels size ≤124cm3. 248 ROIs. f: Neuromorphometrics atlas + ICBM DTI181 + WM
parcels size ≤32cm3. 248 ROIs.
3
Results
DS1: For the realistic phantoms (five cases), Table 1 indicates the mean scores for the automated method, the four raters and their corresponding Staple values. Additionally we computed the same scores considering Staple as the ground truth for the automated method and for each rater. For the latter, Staple was computed on the 3 others raters. The mean of inter-rater scores is displayed in Table 1. The Inter Correlation Class (ICC) between raters was 0.80 and 0.79 when we
included the automated approach. More coherence was obtained for low MD lesions segmentation with ICC=0.98 for both manual and automated methods compared to ICC=0.73 for manual and ICC=0.71 for automated methods for high MD lesion segmentation.
Table 1. Mean scores and confidence interval (95%) for the five gold standard cases. Auto: automated method. Staple was computed on four raters.
Figure 3 illustrated lesion segmentation for a synthetic case (case 5) including low and high MD.
Figure 3. Results on a synthetic lesion. a: MD image; b: Realistic phantom; c: Staple (4 raters); d: Automated method. Green: Low MD. Red: High MD.
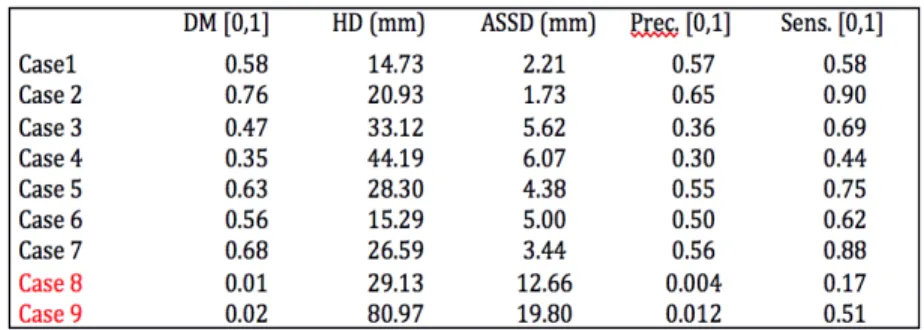
DS2: Table 2 indicates the mean scores for the five real cases. Results for Case 3 and for failed cases (Case 8 and Case 9) are respectively shown in Figures 4, 6 and 7.
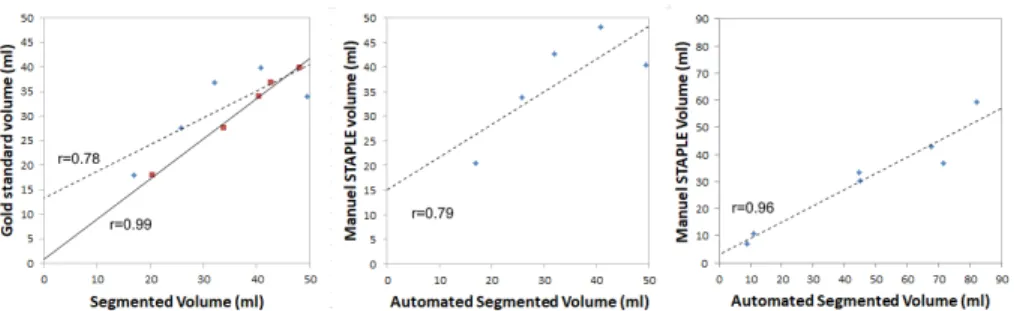
For both DS1 and DS2, volume agreements are shown in Figure 5 with the corresponding Pearson coefficient.
4
Discussion
Very few studies have investigated brain alterations due to severe trauma in acute phase, i.e. less than 10 days post-injury [6],[13]. The methodological difficulties
Table 2. Mean scores for the automated method for the nine real cases using Staple (3 raters) as the reference.
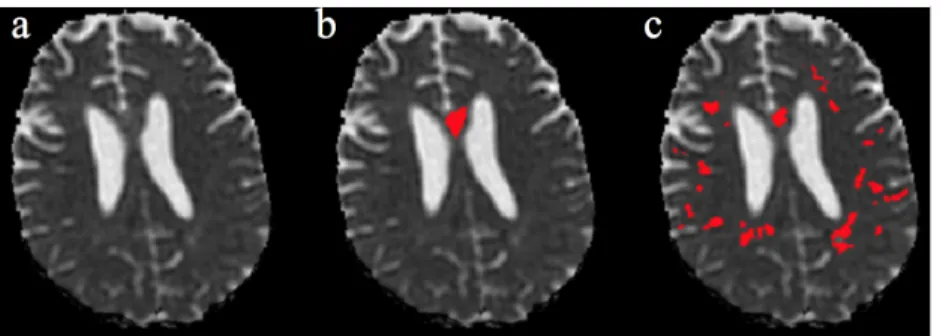
Figure 4. Results on a real lesion (Case 5). a: MD image; b: Staple (3 raters); c: Automated method. Green: Low MD. Red: High MD.
in performing MRI at this stage explain the rarity of studies. Moreover, currently proposed MR segmentation methods lack sufficient robustness to capture TBI-related changes without excessive user input [7], hampering large cohort studies. In this paper, we report our experiments comparing four manual delineations and one automated method on realistic phantoms (RP) and real images for MD lesion segmentation in severe brain trauma. The method focuses on detection of abnormal values in MD. The additional modalities, T1-weighted and FLAIR images, were used for brain extraction, atlas realignment (i.e T1-weighted image) and CSF segmentation (T1+FLAIR images).
For RP, represented by synthetic images with low and high MD inserted by an expert, we found a good coherence between manual and automated results (see in Figure 3 the similarity between manual and automated results for low and high MD). The high value of ICC (0.80) shows a good degree of agreement between the raters. When we considered the automated segmentation in the ICC calculation, the ICC value was very slightly decreased (0.79). This demonstrates that automated and manual segmentation provide very similar results. This was confirmed with the coherence between inter-observer scores, each rater vs RP (mean 0.74, 0.72 and 0.78 for DM, Precision and Sensibility respectively), and scores obtained for the automated method vs RP (0.77, 0.77 and 0.83) (see Table 1). We computed the automated method performances using RP or Staple as a reference (see Table 1, two last rows). This gives an idea of the potential effects
Figure 5. Volume agreement. Left: For DS1, manual (Staple, four raters) and auto-mated segmented volume vs gold standard. Center: For DS1, autoauto-mated segmented volume vs Staple volume (four raters). Right: For DS2, automated segmented volume vs Staple volume (three raters). r: Pearson coefficient. Dash line: automated method. Black line: Staple method (four raters).
on the performances using Staple when ground truth (here RP) is unknown (real case conditions). In these experimental conditions the reference change had a slight impact. The agreement (see Figure 5, left) between the volume measurement was excellent between manual raters (Pearson coefficient=0.99) and good for the automated technique versus RP or the Staple values (Pearson coefficient=0.78 and 0.79 respectively). This again indicates that using Staple instead of RP is valid. There were some limitations to the automated approach on synthetic cases segmentation (see in Figure 3 some differences for low MD between Staple and automated method). Indeed, when MD values were very close to normative values they were undetected by the automated approach, whereas experts used other cues such as texture or structural knowledge in addition to luminance to truly detect abnormalities.
For 7/9 real cases we obtained coherent results (see Table 2 & Figure 4) with mean scores of DM=0.57±0.09, HD=26.16±7.74, ASSD=4.07±1.51, Pre-cision =0.50±0.10 and Sensibility=0.70±0.12 respectively for the automated method vs Staple method compared to DM=0.59±0.06, HD=19.94±6.3, ASSD =2.75±0.9, Precision=0.52±0.12 and Sensibility=0.78±0.08 for inter-raters (each rater versus Staple computed on the two other). ICC was improved when con-sidering the automated method (0.71) in addition to the three raters (0.66). The agreement between volume delineation was good with a Pearson coefficient equal to 0.96 (see Figure 5, right). Altogether, these results clearly demonstrate the nice coherence between the automated method and the manual delineation. However, some discrepancies exist between the manual and automated methods. Clearly, for 2/9 cases the automated method failed (see Cases 8 and 9 in Ta-ble 2 and Figures 6 & 7). For Case 8, our automatic method could not detect small diffuse axonal lesions and for Case 9 images were noisy and not sufficiently corrected by the QC module.
Dice and precision for both methods were quite low (0.57 and 0.59 for au-tomated and manual methods respectively excluding the two failed cases) in-dicating the difficulty of the task even for experts. To our knowledge no fully
automated alternative methods are available for a comparative evaluation with the method we propose and no evaluation results for traumatic brain lesion seg-mentation are reported in the literature. For comparison for ischemic stroke a Dice= 0.73 with Precision =0.84 can be achieved by the best automated tech-niques [10]. Note that the use of a modified HD(95 percentile) may better de-scribe the results (for RP, automated HD=3.65±3.9 and Staple HD=1.66±0.73 and for real cases, automated HD=14.88±6.70 and Staple HD=8.11±2.39). How-ever, we kept standard HD values in Table 1 & Table 2 for comparison with the literature.
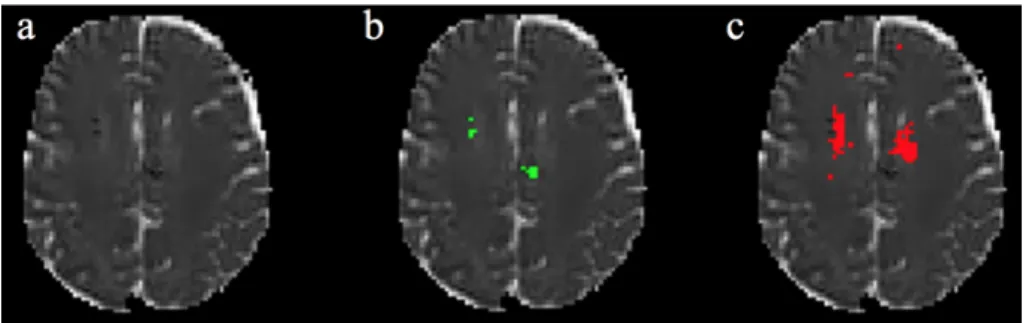
Figure 6. Failed cases. Case 8. a: MD image; b: Staple (3 raters); c: Automated method. Green: Low MD. Red: High MD.
These results were obtained on data coming from nine different scanners (3x3T Siemens, 2x1.5T GE, 2x3T Philips and 2x1.5 Philips with different mod-els). The quality check and preprocessing steps were essential for improving the quality of DTI and removing CSF false positives and ensure the quality of the final results. A poor estimation of the normative mean in each ROI of the con-trol group biases the detection of aberrant values [8]. Currently, for real cases, only three control DTI were available at each center for the normative values computation. In comparison for GT, seven controls were available from a sin-gle provider, the Grenoble center. This could explain the observed differences between synthetic data and real data performances. Then, we may expect sub-stantial improvements in our results with the inclusion of 9 healthy controls in each center as planned. The involvement of more experts would allow the definition using Staple of a more accurate reference for real cases.
Finally, we observed that lesions were particularly difficult to segment man-ually due to low contrast and low spatial resolution in diffusion images. It took approximative 30 min per case for each trained expert vs 10 min for the auto-mated technique. Because we were interested in the detection of low and high MD values compared to normative values our method only relies on voxel intensities in diffusion modality. An extension of this work could consider new descriptors in multimodal images to capture brain modifications induced by trauma.
Figure 7. Failed cases. Case 9. a: MD image; b: Staple (3 raters); c: Automated method.
In conclusion, our results show that the proposed pipeline, including quality control and segmentation modules, allows the identification of severe TBI lesions based on mean diffusivity in coherence with the manual delineation by four experts. Its use on a large data cohort is ongoing. Nevertheless, a visual control by an expert is still required at two levels to control the quality of the images and validate the final automated segmentation produced.
5
Acknowledgments
Grenoble MRI facility IRMaGe was partly funded by the French program vestissement d’avenir run by the Agence Nationale pour la Recherche; grant In-frastructure d’avenir en Biologie Sant´e - ANR-11-INBS-0006. Research funded by French ministry of research and education under the Projet Hospitalier de Recherche Clinique grant OXY-TC to JFP.
References
1. Cunningham, A.S., Salvador, R., Coles, J.P., et al.: Physiological thresholds for irreversible tissue damage in contusional regions following traumatic brain injury. Brain 128(Pt 8), 1931–42 (2005)
2. Davenport, N.D., Lim, K.O., Armstrong, M.T., Sponheim, S.R.: Diffuse and spa-tially variable white matter disruptions are associated with blast-related mild trau-matic brain injury. Neuroimage 59(3), 2017–24 (2012)
3. Doyle, S., Forbes, F., Dojat, M.: P-locus, a complete suite for brain scan segmenta-tion. In: 9h IEEE International Symposium on Biomedical Imaging (ISBI) (2012) 4. Dubuisson, M., Jain, A.: A modified hausdorff distance for object-matching. In: 12h International Conference on Pattern Recognition (IPAR). pp. 566–68 (1994) 5. Fiez, J.A., Damasio, H., Grabowski, T.J.: Lesion segmentation and manual warping
to a reference brain: intra- and interobserver reliability. Hum Brain Mapp 9(4), 192–211 (2000)
6. Galanaud, D., Perlbarg, V., Gupta, R., et al.: Assessment of white matter injury and outcome in severe brain trauma: a prospective multicenter cohort. Anesthesi-ology 117(6), 1300–10 (2012)
7. Irimia, A., Chambers, M.C., Alger, J.R., et al.: Comparison of acute and chronic traumatic brain injury using semi-automatic multimodal segmentation of mr vol-umes. J Neurotrauma 28(11), 2287–306 (2011)
8. Kim, N., Branch, C.A., Kim, M., Lipton, M.L.: Whole brain approaches for iden-tification of microstructural abnormalities in individual patients: comparison of techniques applied to mild traumatic brain injury. PLoS One 8(3), e59382 (2013) 9. Maggia, C., Doyle, S., Forbes, F., Heck, O., Tropr`es, I., Velly, L., Payen, J., Dojat,
M.: Assessment of tissue injury in severe brain trauma. In: Crimi, A. (ed.) BrainLes 2015. pp. 57–68. LNCS 9556, Springer (2015)
10. Maier, O., Schroder, C., Forkert, N.D., Martinetz, T., Handels, H.: Classifiers for ischemic stroke lesion segmentation: A comparison study. PLoS One 10(12), e0145118 (2015)
11. Manjon, J.V., Coupe, P., Concha, L., Buades, A., Collins, D.L., Robles, M.: Dif-fusion weighted image denoising using overcomplete local pca. PLoS One 8(9), e73021 (2013)
12. Narayana, P.A., Yu, X., Hasan, K.M., et al.: Multi-modal mri of mild traumatic brain injury. Neuroimage Clin 7, 87–97 (2015)
13. Pasco, A., Ter Minassian, A., Chapon, C., et al.: Dynamics of cerebral edema and the apparent diffusion coefficient of water changes in patients with severe traumatic brain injury. a prospective mri study. Eur Radiol 16(7), 1501–8 (2006)
14. Tagliaferri, F., Compagnone, C., Korsic, M., et al.: A systematic review of brain injury epidemiology in europe. Acta Neurochir (Wien) 148(3), 255–68; discussion 268 (2006)
15. Thornhill, S., Teasdale, G.M., Murray, G.D., et al.: Disability in young people and adults one year after head injury: prospective cohort study. BMJ 320(7250), 1631–5 (2000)
16. Warfield, S.K., Zou, K.H., Wells, W.M.: Simultaneous truth and performance level estimation (staple): an algorithm for the validation of image segmentation. IEEE Trans Med Imaging 23(7), 903–21. (2004)
17. Watts, R., Thomas, A., Filippi, C.G., Nickerson, J.P., Freeman, K.: Potholes and molehills: bias in the diagnostic performance of diffusion-tensor imaging in concus-sion. Radiology 272(1), 217–23 (2014)