Publisher’s version / Version de l'éditeur:
Vous avez des questions? Nous pouvons vous aider. Pour communiquer directement avec un auteur, consultez la première page de la revue dans laquelle son article a été publié afin de trouver ses coordonnées. Si vous n’arrivez pas à les repérer, communiquez avec nous à [email protected].
Questions? Contact the NRC Publications Archive team at
[email protected]. If you wish to email the authors directly, please see the first page of the publication for their contact information.
https://publications-cnrc.canada.ca/fra/droits
L’accès à ce site Web et l’utilisation de son contenu sont assujettis aux conditions présentées dans le site LISEZ CES CONDITIONS ATTENTIVEMENT AVANT D’UTILISER CE SITE WEB.
Internal Report (National Research Council of Canada. Institute for Research in Construction), 1988-07
READ THESE TERMS AND CONDITIONS CAREFULLY BEFORE USING THIS WEBSITE. https://nrc-publications.canada.ca/eng/copyright
NRC Publications Archive Record / Notice des Archives des publications du CNRC :
https://nrc-publications.canada.ca/eng/view/object/?id=4cb27e58-5b25-4401-ad47-ffe22deb1d77 https://publications-cnrc.canada.ca/fra/voir/objet/?id=4cb27e58-5b25-4401-ad47-ffe22deb1d77
NRC Publications Archive
Archives des publications du CNRC
For the publisher’s version, please access the DOI link below./ Pour consulter la version de l’éditeur, utilisez le lien DOI ci-dessous.
https://doi.org/10.4224/20386656
Access and use of this website and the material on it are subject to the Terms and Conditions set forth at Fire resistance of reinforced concrete columns
Ref
Ser
T H 1
National Research Conseil national R427 Council Canada de recherches Canada
n. 569
Institute for lnstitut de
Research in recherche en
IRC PUB Construction construction
Fire resistance of reinforced
concrete columns:
Test results
T.T. Lie and J.L. Woollerton
Internal Report No. 569
Date of issue: July 1988
1
w - c-
c1sn1
I R C
1
1
L I B R A R Y
i
i
TABLE OF CONTENTS PAGE List of Figures List of Tables 1.1 Background 1.2 Program
2 GENERAL DESCRIPTION OF SPECIMENS AND TESTS 2.1 Test Specimens - Properties
Dimensions Materials Concrete Mix Fabrication
Reinforcing Bars and Steel Plates Welding Forms Thermocouples Concrete Placement Curing 2.2 Test Apparatus 2.2.1 Loading Device 2.2.2 Furnacechamber 2.2.3 Instrumentation
2.3 Test Conditions and Procedures 2.3.1 Loading
2.3.2 Fire Exposure 2.3.3 Recording of results
3 TEST DESCRIPTIONS AND RESULTS
3.1.1 Series I, Column 1 3.1.2 Series I, Column 2 3.1.3 Series I, Column 3 3.1.4 Series I, Column 4 3.1.5 Series I, Column 7 3.1.6 Series I, Column 8 3.1.7 Series I, Column 9
3.2 Effect of Carbonate Aggregate 3.2.1 Series I, Column 10 3.2.2 Series I, Column 11 3.2.3 Series I, Column 12 3.3 Effect of Lightweight Aggregate
3.3.1 Series 11, Column 6 3.3.2 Series 11, Column 7
3.4 Effect of High-Strength Concrete 3.4.1 Series 11, Column 4
3.4.2 Series 11, Column 5 3.5 Effect of End Restraint
3.5.1 Series 11, Column 1 3.5.2 Series 11, Column 2 3.5.3 Series 11, Column 3 3.6 Effect of Heavy Reinforcement
3.6.1 Series 11, Column 8 3.6.2 Series 11, Column 9
3.7 Effect of Size and Heavy Reinforcement 3.7.1 Series I, Column 5 3.7.2 Series 11, Column 10 3.7.3 Series 11, Column 1 1 3.7.4 Series 11, Column 12 3.7.5 Series I, Column 6 3.8 Effect of Shape 3.8.1 Series 111, Column 5 3.8.2 Series 111, Column 6 3.8.3 Series III, Column 1 1 3.8.4 Series III, Column 12 3.9 Effect of End Conditions
3.9.1 Series III, Column 1 3.9.2 Series III, Column 2 3.9.3 T Series, Column 3
3.1 0 Effect of
Other
than Standard Fire 3.10.1 Series 111, Column 4 3.10.2 Series 111, Column 13 3.10.3 T Series, Column 13.1 1 Effect of Eccentric Loading, Regular Sections 3.1 1.1 Series 111, Column 3
3.1 1.2 Series
III,
Column 143.12 Effect of Eccentric Loading, Sections with Brackets 3.12.1 Series III, Column 7
3.12.2 Series 111, Column 8
3.12.3 Series III, Column 9
3.12.4 Series 111, Column 10 REFERENCES
LIST OF FIGURES
PAGE 2 GENERAL DESCRIPTION OF SPECIMENS AND TESTS
2.1 Gradation curves for Siliceous Aggregate 2.2 Gradation curves for Carbonate Aggregate 2.3 Gradation curves for Lightweight Aggregate 2.4 Column Furnace
2.5 TIC Locations for Furnace Temperatures 3 TEST DESCRIPTIONS AND RESULTS
Section 3.1 Standard Tests
Elevation, Cross-Section and Finishing Detail: 12 x 12 Section with 2.19% Steel
Layout of TIC Frames in Concrete: Series I Sections TIC'S in Frames: 12 x 12 Section, Series I
TIC'S on Reinforcing Bars: 12 x 12 Section, Series I Series I Column 1 After Test
Series I Column 2 After Test
Series I Column 3
-
Deformed Reinforcing Bars Series I Column 4 After Test, Concrete RemovedTo Show Reinforcing Bars Series I Column 7 After Test Series I Column 8
-
Top After Test Series I Column 9 After TestSection 3.2 Tests for Effect of Carbonate Aggregate 3.2.1 Series I Column 10 After Test
3.2.2 Series I Column 1 1 After Test 3.2.3 Series I Column 12 After Test
Section 3.3 Tests for Effect of Lightweight Aggregate 3.3.1 Layout of TIC Frames in Concrete:
Series 11 and 111 Square Sections
3.3.2 TIC'S in Frames: Standard 12 x 12 Section, Series 11 and 111 3.3.3 TIC'S on Reinforcing Bars:
Standard 12 x 12 Section, Series I1 and 111
3.3.4 Series 11 Column 6 After Test 3.3.5 Series 11 Column 7 After Test Section 3.4 Effect of High-S trength Concrete
Section 3.5 EffectofEndRestraint
3.5.1 Series 11 Column 1 After Test, Concrete Removed To Show Reinforcing Bars
3.5.2 Series 11 Column 2 After Test 3.5.3 SeriesIIColumn3AfterTest
Section 3.6 Effect of Heavy Reinforcement
3.6.1 Elevation, Cross-Section and Finishing Detail: 12 x 12 Section with 4.38% Steel
3.6.2 TIC'sinFrames: 12x12Sectionwith4.38%Steel
3.6.3 TIC'S on Reinforcing Bars: 12 x 12 Section with 4.38% Steel 3.6.4 Series
II
Column 8 After Test3.6.5 Series 11 Column 9 After Test
Section 3.7 Tests for Effect of Size and Heavy Reinforcement Elevation, Cross-Section and Finishing Detail:
16 x 16 Section with 2.47% Steel
TIC'S in Frames: Series I 16 x 16 Section with 2.47% Steel TIC'S on Reinforcing Bars:
Series I 16 x 16 Section with 2.47% Steel Series I Column 5 After Test
TIC'S in Frames: Series I1 16 x 16 Sections
TIC'S on Reinforcing Bars: Series I1 16 x 16 Sections Series 11 Column 10 After Test
Elevation, Cross-Section and Finishing Detail: 16 x 16 Section with 3.97% Steel
Series 11 Column 1 1 After Test Series
II
Column 12 After TestElevation, Cross-Section and Finishing Detail: 8 x 8 Section TIC'S in Frames: 8 x 8 Section
TIC'S on Reinforcing Bars: 8 x 8 Section Series I Column 6 After Test
Section 3.8 Effect of Shape
Elevation, Cross-Section and Finishing Detail: 12 x 18 Section Layout of TIC Frames in Concrete: 12 x 18 Section
TICS in Frames: 12 x 18 Section
TICS on Reinforcing Bars: 12 x 18 Section Series 111, Column 5 After Test
Elevation, Cross-Section and Finishing Detail: 8 x 36 Section Layout of TIC Frames in Concrete: 8 x 36 Section
TICS in Frames: 8 x 36 Section
TICS on Reinforcing Bars: 8 x 36 Section Series 111 Column 6 After Test
Elevation, Cross-Section and Finishing Detail: 14
0
Section Layout of TIC Frames in Concrete: 140
SectionTICS in Frames: 14
0
SectionTICS on Reinforcing Bars: 14
0
Section Series III Column 1 1 After TestSection 3.9 Effect of End Conditions
3.9.1 Series
ILI
Column 1 After Test3.9.2 Series 111 Column 2 After Test
3.9.3 T Series Column 3 After Test
Section 3.10 Effect of Other than Standard Fire
3.10.1 Series
ILI
Column 4 After Test3.10.2 Series
III
Column 13-
Top After Test3.10.3 T Series Column 1 After Test
3.10.4 T Series Column 2 After Test
Section 3.1 1 Effect of Eccenmc Loading, Regular Sections
3.1 1.1 Series III Column 3 After Test
3.1 1.2 Series
III
Column 14 After TestSection 3.12 Effect of Eccentric Loading, Sections with Brackets
3.12.1 Elevation, Cross-Section and Finishing Detail:
12 x 12 Section with Brackets
3.12.2 Loading Scheme: 12 x 12 Section with Brackets
3.12.3 Series 111 Column 7 After Test
3.12.4 Series XI1 Column 8 After Test
3.12.5 Series
III
Column 9 After Test, Concrete Removed To Show Reinforcing BarsLIST OF TABLES
PAGE Chapter 2 General Description of Specimens and Tests
2. la-d Summaries of Test Parameters and Results 14
2.2 Petrography of Sand and Gravel used as Siliceous Aggregate 16 2.3 Petrography of Sand and Gravel used as Carbonate Aggregate 17
2.4 Physical Properties of Aggregates 18
2.5 Batch Quantities and Properties of Concrete 19
2.6 Tensile Strength of Steel 20
2.7 Reinforcing Bars and S tee1 Plates 20
Chapter 3 Test Descriptions and Results
3.1.1 Steel Temperatures, Series I Column 1 3.1.2a-d Concrete Temperatures, Series I Column 1 3.1.3 S teel Temperatures, Series I Column 2 3.1.4a-d Concrete Temperatures, Series I Column 2 3.1.5 Deflections, Series I Column 2
3.1.6 Steel Temperatures, Series I Column 3 3.1.7a-d Concrete Temperatures, Series I Column 3 3.1.8 Deflections, Series I Column 3
3.1.9 Steel Temperatures, Series I Column 4 3.1.10a-d Concrete Temperatures, Series I Column 4 3.1.1 1 Deflections, Series I Column 4
3.1.12 Steel Temperatures, Series I Column 7 3.1.13a-d Concrete Temperatures, Series I Column 7 3.1.14 Deflections, Series I Column 7
3.1.1 5 S teel Temperatures, Series I Column 8 3.1.16a-d Concrete Temperatures, Series I Column 8 3.1.17 Deflections, Series I Column 8
3.1.18 Steel Temperatures, Series I Column 9 3.1.19a-d Concrete Temperatures, Series I Column 9 3.1.20 Deflections, Series I Column 9
Section 3.2 Effect of Carbonate Aggregate
Steel Temperatures, Series I Column 10 Concrete Temperatures, Series I Column 10 Deflections, Series I Column 10
Steel Temperatures, Series 1 Column 11 Concrete Temperatures, Series I Column 11 Deflections, Series I Column 11
Steel Temperatures, Series I Column 12 Concrete Temperatures, Series I Column 12 Deflections, Series I Column 12
Section 3.3 Effect of Lightweight Aggregate
Section 3.4
Section 3.5
Section 3.6
Section 3.7
Steel Temperatures, Series I1 Column 6
Concrete Temperatures, Series I1 Column 6
Deflections, Series 11 Column 6
Steel Temperatures, Series 11 Column 7
Concrete Temperatures, Series I1 Column 7 Deflections, Series 11 Column 7
Effect of High-Strength Concrete
Steel Temperatures, Series 11 Column 4
Concrete Temperatures, Series I1 Column 4
Deflections, Series 11 Column 4
Steel Temperatures, Series 11 Column 5
Concrete Temperatures, Series I1 Column 5
Deflections, Series I1 Column 5
Effect of End Restraint
Steel Temperatures, Series I1 Column 1 Concrete Temperatures, Series 11 Column 1 Deflections, Series 11 Column 1
Steel Temperatures, Series 11 Column 2 Concrete Temperatures, Series I1 Column 2 Loads and Deflections, Series I1 Column 2 Steel Temperatures, Series 11 Column 3
Concrete Temperatures, Series I1 Column 3
Loads and Deflections, Series 11 Column 3
Effect of Heavy Reinforcement
Steel Temperatures, Series
II
Column 8 Concrete Temperatures, Series I1 Column 8 Deflections, Series I1 Column 8Steel Temperatures, Series I1 Column 9 Concrete Temperatures, Series I1 Column 9 Deflections, Series
II
Column 9Effect of Size and Heavy Reinforcement Steel Temperatures, Series I Column 5
Concrete Temperatures, Series I Column 5
Steel Temperatures, Series I1 Column 10 Concrete Temperatures, Series
II
Column 10 Deflections, SeriesII
Column 10Steel Temperatures, Series I1 Column 11 Concrete Temperatures, Series 11 Column 11 Deflections, Series I1 Column 1 1
Steel Temperatures, Series I1 Column 12 Concrete Temperatures, Series 11 Column 12 Deflections, Series 11 Column 12
3.7.13a-d Concrete Temperatures, Series I Column 6 3.7.14 Deflections, Series I Column 6
Section 3.8
Section 3.9
Section 3.10
Section 3.11
Effect of Shape
Steel Temperatures, Series 111 Column 5 Concrete Temperatures, Series
III
Column 5 Deflections, Series 111 Column 5Steel Temperatures, Series 111 Column 6 Concrete Temperatures, Series
III
Column 6 Deflections, Series 111 Column 6Steel Temperatures, Series
III
Column 1 1 Concrete Temperatures, Series III Column 11 Deflections, Series 111 Column 1 1Steel Temperatures, Series
III
Column 12Concrete Temperatures, Series 111 Column 12 Deflections, Series 111 Column 12
Effect of End Conditions
Steel Temperatures, Series 111 Column 1 Concrete Temperatures, Series III Column 1 Deflections, Series 111 Column 1
Steel Temperatures, Series 111 Column 2 Concrete Temperatures, Series
III
Column 2 Deflections, Series 111 Column 2Steel Temperatures, T Series Column 3 Concrete Temperatures, T Series Column 3 Deflections, T Series Column 3
Effect of Other than Standard Fire Steel Temperatures, Series 111 Column 4 Concrete Temperatures, Series
III
Column 4Deflections, Series 111 Column 4
Loads and Deflections, Series 111 Column 13 Steel Temperatures, T Series Column 1 Concrete Temperatures, T Series Column 1 Loads and Deflections, T Series Column 1 Steel Temperatures, T Series Column 2 Concrete Temperatures, T Series Column 2
Loads and Deflections, T Series Column 2 Effect of Eccentric Loading, Regular Sections Steel Temperatures, Series III Column 3 Concrete Temperatures, Series
III
Column 3 Deflections, Series III Column 3Steel Temperatures, Series
III
Column 14 Concrete Temperatures, Series 111 Column 14 Deflections, Series 111 Column 14Section 3.12 3.12.1 3.12.2 3.12.3 3.12.4 3.12.5 3.12.6 3.12.7 3.12.8 3.12.9 3.12.10 3.12.11 3.12.12
Effect of Eccentric Loading, Sections with Brackets Steel Temperatures, Series
III
Column 7Concrete Temperatures, Series
III
Column 7Deflections, Series III Column 7
Steel Temperatures, Series 111 Column 8
Concrete Temperatures, Series
III
Column 8 Loads and Deflections, SeriesIII
Column 8Steel Temperatures, Series 111 Column 9
Concrete Temperatures, Series
III
Column 9Loads and Deflections, Series 111 Column 9
Steel Temperatures, Series
III
Column 10Concrete Temperatures, Series 111 Column 10
1 INTRODUCTION
1.1 BACKGROUND [I]
Studies on columns were started a few years ago for the purpose of updating the fire resistance ratings for reinforced concrete columns in the National Building Code of Canada [2,3]. These ratings were related to full scale test results obtained in about 1920. Since that time, design procedures have changed and the safety factor has decreased. This indicates a need for revision of these ratings.
Facilities for testing columns have been constructed recently at the National Research Council of Canada. Using these facilities, it is possible to study experimentally the influence of the various factors that determine the fire resistance of columns. It is also possible to validate the mathematical models that have been developed for the prediction of the fire resistance of reinforced concrete columns.
The present study was an extension of the previous studies [2, 31. It was undertaken in cooperation with the Portland Cement Association. Its main objectives were:
a) To generate measured fire resistance data on reinforced concrete columns designed in accordance with current ACI 318-83 or CSA-CAN A23.3-M84 Building Codes. b) To develop general methods for the calculation of the fire resistance of concrete
1.2 PROGRAM
The National Research Council and the Portland Cement Association jointly worked out a three-phase program to study the behaviour of 41 full size reinforced concrete columns exposed to fire. The effect of the following variables on fire resistance was investigated:
a) area of cross-section
b) shape of cross-section (square, rectangular, circular) c) thickness of concrete cover
d) percentage of longitudinal reinforcing steel e) lateral reinforcement: tied or spiral
f') concrete mixture (type of aggregate) g) concrete strength
h) moisture content of concrete (relative humidity) i) end conditions
j) axial or rotational restraint k) load intensity
1) load eccentricity m) fire exposure intensity.
The studied effects included: a) column temperatures
b) column deflections c) time to failure
d) residual strength when exposed to short-duration fires.
Mathematical models, capable of simulating these conditions, were developed and programmed for computer processing by NRC prior to the start of the joint research program. By comparing calculated results with those obtained during testing, the validity of the mathematical models can be verified.
A general description of the specimens and the test conditions follows. The third chapter contains in-depth descriptions of each test: all study parameters, visual test observations, drawings and photographs of the specimens, and numerical results.
2 GENERAL DESCRIPTION OF SPECIMENS AND TESTS
2.1 TEST SPECIMENS
-
PROPERTIESThe basic properties of the 41 column specimens are listed in Tables 2.la to d. Seven nearly identical reference specimens were tested under different loads, and these are indicated with an asterisk in the Tables. They differed only in measured concrete strength and relative humidity.
2.1.1 Dimensions
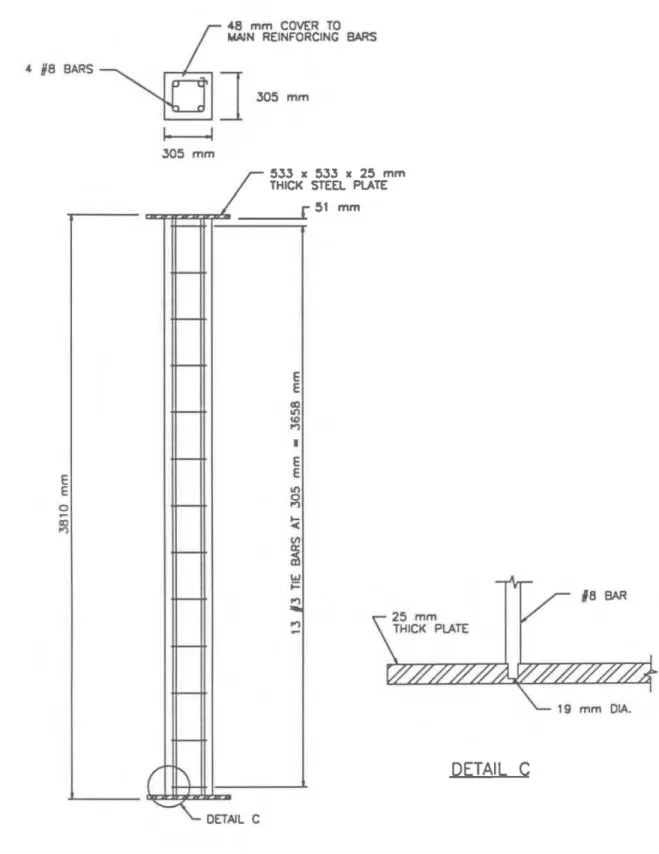
All columns were 3810 mm (12 ft 6 in.) long from endplate to endplate.
The reference cross-section was 305 x 305 m m (12 x 12 in.). Square sections of 203 mm (8 in.) and 406 mm (16 in.), rectangular sections of 305 x 457 mm (12 x 18 in.) and 203 x 915 mm (8 x 36 in.), and circular sections of 355 mm (14 in.) diameter were also used to investigate the effect of size and shape on fire resistance. Several 12 x 12 columns were built with brackets for eccentric loading.
All but one column had 38 mm (1.5 in.) cover to the tie bars, and 48 mm (1.875 in.) cover to the vertical steel. Column 11-12 had 64 mm (2.5 in.) cover to the vextical steel.
2.1.2 Materials a) Cement:
Type I Cement, a general purpose cement for construction of reinforced concrete structures, was used.
b) Aggregate:
3 types were used: siliceous sand and gravel from Eau Claire, Wisconsin; carbonate sand and gravel from Elgin, Illinois; and lightweight expanded shale manufactured by the Solite Corporation. The maximum size of the aggregate was 19 mm (314 in.). The petrographic information, given in Tables 2.2 and 2.3, was obtained following the procedures of ASTM C295-65 [4]. Sieve analyses were conducted, and gradation curves aggregates are shown in Figures 2.1 and 2.2. Other information needed for proportioning the mix, such as specific gravity, moisture content, unit weight, and fineness modulus of the aggregates is listed in Table 2.4.
c) Steel:
Deformed bars meeting requirements of ASTM Designation A615-80 [5] were used for main and tie bars. The longitudinal steel in the columns were symmetrical arrangements of No. 6,7, 8 or 10 bars. All ties were No. 3 bars. A tensile test was performed for each bar size to determine yield and ultimate strength, and the results are listed in Table 2.6.
2.1.3 Concrete Mix
Several trial mixes for determining optimum proportions were made to produce a 34.5 MPa (5000 psi) strength non-air-entrained concrete for most columns. The lightweight columns were air-entrained, and some mixes were designed for higher strength. Batch quantities and measured properties of fresh concrete are given in Table 2.5.
The average 28-day concrete strengths were 39 MPa for siliceous (not including high-strength), 36 MPa for carbonate, and 36 MPa for lightweight aggregate concrete. Cylinders were tested at 28 days and on the test date, and the results are given in Table 2.1.
2.1.4. Fabrication
The columns were cast in specially designed forms. The reinforcement cage was assembled by welding the longitudinal bars to a steel end plate. Chromel-alumel thermocouples were secured to the reinforcing steel at specified locations after the cage was properly positioned in the form. In order to avoid any possible dislocation of the thermocouples during casting, a careful working plan was followed as described below. 2.1.5 Reinforcing Bars and Steel Plates
The standard cross-section (12 x 12 in.) had 2.19% steel reinforcement, with four No. 8 bars. As a variation, one column had double this amount of steel. Drawings of the main reinforcing bars and cross-sections are provided in Chapter 3.
The column length was 3810 mm (12 ft 6 in.) measured from end plate to end plate. The longitudinal reinforcing bars were cut to 3800 mm and machined at both ends to the diameters (measured by micrometer) shown in the figures entitled "Finishing Detail" in Chapter 3.
The dimensions of the end plates are also shown in these figures. Holes with a diameter 1.6 mm (1116 in.) greater than that of the machined ends were drilled through the plates to accommodate the longitudinal bars. This information is summarized in Table 2.7.
The main bars and ties were tied together to complete the steel cage. The cage then was placed vertically on a leveled end plate in such a way that the machined segments of the bars were positioned in the holes.
2.1.6 Welding
The provisions of AWS Designation D12.1-75 [6] were followed when welding plates and bars. To prevent any possible brittle failure during welding, these members were preheated with a propane torch to 288OC (550°F). The side fillet weld was done around bars on the inner face of the bottom plate. McKay E10018-D2 and DYTRON-579 welding rods were used. Both types of welding rods have tensile strength of 835 MPa (120 ksi). Mild-steel welding rods were used to fill up the holes on the outer faces of the
The welding of the top steel plate was performed after the casting of the columns. Before positioning the top plate, a 6 mm (114 in.) layer of mortar was spread over the top of the column to ensure good contact between steel plate and concrete. The mortar was made of 1 part of cement and 3 parts of siliceous sand. Using the same procedure as for the bottom plate, the top plate was welded on the outer side to the bars and smoothed.
2.1.7 Forms
Forms were made of smooth plywood, with the front side left open for depositing fresh concrete. As the casting progressed upwards, window pieces made of plywood were bolted to the form to close the opening.
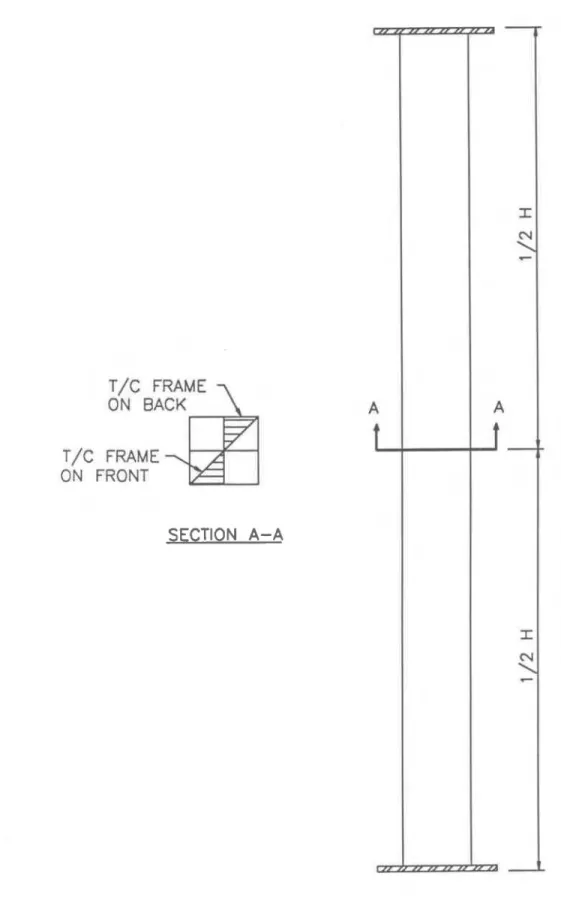
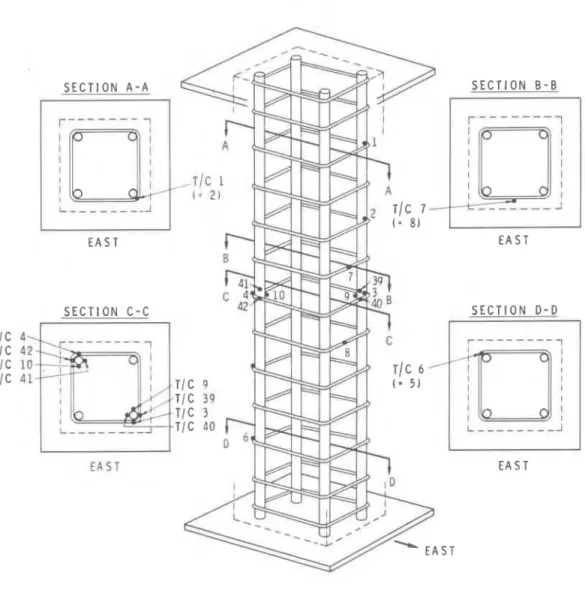
Butt-welded chromel-alumel thermocouples with a thickness of 0.91 mm were used to make thermocouple frames for measuring concrete temperatures at several locations in different cross sections of the columns. Each frame consisted of a number of thermocouples tied to steel rods that were f d y secured to the main reinforcing bars.
For the first series, temperatures were measured at three levels: at one-quarter height, at mid-height and at three-quarter height of the column. At mid-height, the temperatures were measured along the whole length of an axis and a diagonal of the section; at the other two levels, the temperatures were measured only along half of the axis and half of the diagonal of the section.
For all other columns, only the frame at mid-height, or a similar one, was used. In addition, a number of thermocouples were mounted on the reinforcing steel bars and ties of all columns. Exact location and numbering of thermocouples is shown in the third chapter.
2.1.9 Concrete Placement
3
Concrete was mixed in a 0.17 m (6 cu ft ) tilting drum mixer. Shovels and scoops were used to deposit concrete in the form. A small internal vibrator was carefully applied to consolidate the concrete. As the casting progressed upward, the window pieces were successively closed and tightly bolted to the form to avoid possible mortar leaks. The top surface of the column was screeded and finished with a small wood float.
Lifting hooks were embedded on opposite sides of the specimen at 0.8 m (2 ft 7 in.) from the top of the column. A humidity well was positioned at mid-point for measuring relative humidity at mid-depth of the columns [7].
2.1.10
CuringConcrete was cured under damp burlap for
7
days at21
to24OC (70
to7S°F).
Fonns were then stripped, and most columns conditioned in an atmosphere controlled at the same temperature and
30
to 40% relative humidity. In calculations, their moisture content was assumed to be 5% by volume.Four columns, tested at a near-oven-dry condition, were kilndried at about
93OC
(200°F)
and0
to 5% relative humidity. They were removed from the kiln periodically to cool at23OC (73OF)
so that the relative humidity in the concrete could be measured. After the desired moisture condition was reached, the columns were wrapped in plastic to prevent any change. The moisture content of these columns was assumed to be Wo.2.2 TEST APPARATUS
The tests were canied out by exposing the columns to heat in a furnace specially built for testing loaded columns and walls. The test furnace was designed to produce the conditions to which a member might be exposed during a fire, i.e. temperatures, structural loads, and heat transfer. It consists of a steel framework supported by four steel columns, with the furnace chamber inside the framework (Figure 2.3). The characteristics and instrumentation of the furnace are described in detail in reference [8]. Only a brief description of the furnace and the main components is given here.
2.2.1 Loading Device
Three hydraulic jacks produce forces along the three principal axes. The jack acting along the axis of the test column is located at the bottom of the furnace chamber. The plate on top of this jack can be used as a platform to which the column can be attached.
2.2.2 Furnace Chamber
The furnace chamber has a floor area of 2642 x 2642 mm (8 ft 8 in.) and is 3048 mm (10 ft) high. The interior faces of the chamber are lined with insulating materials that efficiently transfer heat to the specimen. There are 32 propane gas burners in the furnace chamber, arranged in eight columns containing four burners each. The total capacity of the burners is 4700
kW
(16 million Btu/h). Each burner can be adjusted individually, which allows for a high degree of temperature uniformity in the furnace chamber. The pressure in the furnace chamber is also adjustable. It was set somewhat lower than atmospheric pressure.2.2.3 Instrumentation
The furnace temperatures are measured with the aid of eight chromel-alumel thermocouples. The junction of each thermocouple was located 305 mm (1 ft) from the test specimen, at various heights. Two thermocouples were placed opposite each other at intervals of 610 mm (2 ft) along the height of the furnace chamber. The location of their junctions and their numbering are shown in Figure 2.4. Thermocouples 4 and 6 were located at a height of 610 mm (2 ft) from the floor, thermocouples 2 and 8 at 1220 mm (4 ft), thermocouples 3 and 5 at 1830 mm (6 ft) and thermocouples 1 and 7 at 2440 mm (8 ft). The temperatures measured by the thermocouples are averaged automatically and the average temperature used as the criterion for controlling the furnace temperature.
The loads are controlled and measured using pressure transducers. The accuracy of controlling and measuring loads is about 20 kN (5 kips) at lower load levels and relatively better at higher loads.
The axial deformation of the test specimen is determined by measuring the displacement of the jack that supports the column. The displacement is measured using transducers with an accuracy of 0.002 mm.
2.3 TEST CONDITIONS AND PROCEDURES
The columns were installed in the furnace by bolting their end plates to a loading head at the top and a hydraulic jack at the bottom. Most end conditions were fixed-fixed, but different effective lengths were achieved in some tests by pinning one or both ends of the column, or allowing horizontal translation at the top. In two tests (m-2 and LII-3), the columns were full restrained against thermal expansion by controlling the load. [9]
Before each test, the moisture condition in the centre of the column was measured with a Monfore humidity gauge [7]. The readings are recorded in Table 2.1.
2.3.1. Loading
All loads were applied at least 40 minutes before the test, in 4 or more stages. They varied from zero to higher than the maximum allowable [lo, 111, which was calculated based on the assumption that only the dead and part of the live load are present during a fire. All other loads, such as wind and earthquake, were neglected. The test loads were then used in the mathematical models for the calculation of theoretical fire resistance.
The fire response of columns to eccentric load was also examined using both the regular cross-section and specially designed columns with brackets. In some tests, the initial rotation (after loading) was held constant during fire exposure; in others, the column was free to rotate.
2.3.2 Fire Ex~osure
Most columns were subjected to the standard ASTM-El19 (ULC-S101) temperature-time curve [12, 131. In testing for residual strength, columns T- 1 and T-2 were exposed to only the first hour and the first two hours, respectively, of the standard fire. They were cooled at a controlled temperature, then loaded to failure after 24 hours. [14]
Another column (11-4) was exposed to a high-intensity fire which simulated a hydrocarbon oil pool fire. To check the accuracy of the calculated initial strength, one column (111- 13) underwent a room- temperature crush.
2.3.3 Recordin y of results
Readings were taken at each thermocouple location at intervals of 5 or 10 minutes. Axial strain was also measured. In addition, for some tests, horizontal displacement or angle of rotation was recorded.
S T A N D A R D S I Z E O F S Q U A R E M E S H S I E V E
S T A N D A R D S I Z E O F S Q U A R E M E S H S I E V E
TOP
VIEW
1,
2
COLUMN
5,
6
FURNACE
3,
4CHAMBER
7,
8
II
I IDOOR
(EAST SIDE)
Tables 2.1a to 2. ld Summaries of Test Parameters and Results Table 2.1 a Series I Standard, dry Load, dry Load Load Size, dry Size, dry Load Load Load Aggregate Aggregate Aggregate Column # Siliceous Siliceous Siliceous Siliceous Siliceous Siliceous Siliceous Siliceous Siliceous Carbonate Carbonate Carbonate None C* C C None B* C C C C C C Group Table 2.1 b Series I1
Test Purpose X-Section Steel Aggregate
R.M.
fc' (MPa) Load Failure Failure (hrs)in. 96 In 28 day test
kN
Mode Theory ActualFixed-hinged, free translation Full axial restraint
Full axial restnint High-strength concrete High-strength concrete Aggegate Aggregate % Steel 5% Steel Load 5% Steel Siliceous Siliceous Siliceous Siliceous Siliceous Lightweight Lightweight Siliceolis Siliceous Siliceous Siliceous
Test Purpose Section Steel Aggregate
R.11.
fc' (MPa) Load(kN)
Failure Failure (hrs)in. % % 28 day test initial maximum Mode Theory Actual
Column
#
Table 2.lc Series I11 Column Group
#
I
Test Purpose X-Section Steel Aggregate R.H. fc' (MPa) Load (kN) Failure Failure (hrs)
in. % % 28 day test concentric eccentric Mode Theory Actual
Fixed-hinged 12 x 12 Fixed-hinged 12 x 12 Eccentric load (0.96") 12 x 12 Fire intensity 12 x 12 Shape - rectangular 12 x 18 Shape
-
mini-wall 8 x 36 Eccentric load 12 x 12b Eccentric load, rotation const. 12 x 12b Eccentric load, rotation const. 12 x 12b Eccentric load, load constant 12 x 12b Shape-
circular 140
Shape - circular 140
Room-ternperahre crush 12 x 12 Eccentric load (0.96") 12 x 12 Siliceous Siliceous Carbonate Carbonate Siliceous Siliceous Siliceous Siliceous Siliceous Siliceous Siliceous Siliceous Siliceous Siliceous Table 2.ld T Series Residual 12 x 12 2.19 Siliceous 57 37.2 41.6 1022 Column # T- 1 T-2 Failure (hrs) C 3:41*
Failure M d e : C-
Compression B-
Buckling Groupj
j
i Test was stopped due to air fan burnout
Test Purpose X-Section Steel Aggregate R.H. fc' (MPa) Load Failure Strength (kN)
in. % % 28 day test
(kN)
Mode Theory ActualResidual strength
-
1-hr fire 12 x 12 2.19 Siliceous 87 32.1 38.9 993 C 2470 2671 Residual strength-
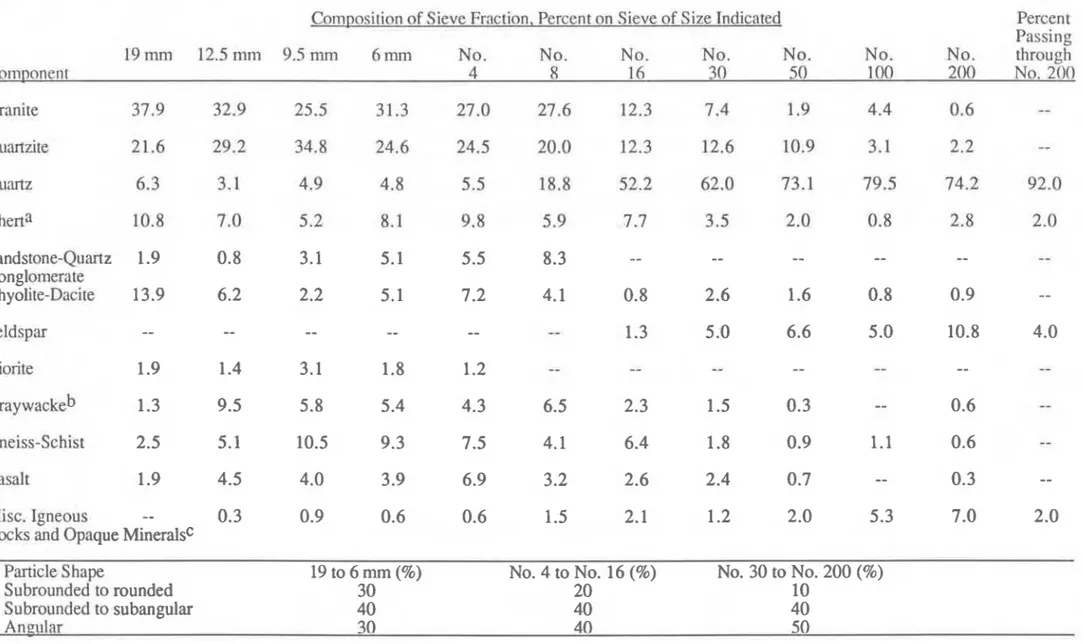
2-hrfm 12 x 12 2.19 Siliceous 82 35.3 41.8 1022 C 1725 1987Table 2.2 Petrography of Sand and Gclvel used as Siliceous Aggregate
Cornpositinn of Sieve Fraction, Percent on Sieve of Size Indicated Percent Passing
19 mm 12.5 mm 9.5 mm 6 mrn No. No. No. No. No. No. No. through
Component 4 8 I I; 30 50 1 00 200 No. 200 Granite 37.9 32,9 25.5 31.3 27.0 27.6 12.3 7 -4 1.9 4.4 0.6
--
Quartz
6.3 3.1 4.9 4.8 5.5 18.8 52.2 62.0 73.1 79.5 74.2 92.0 Sandstone-Quartz 1.9 0.8 3.1 5.1 5.5 8.3 ----
--
--
--
-- Conglomer:~ te Rhyolite-Dscite 13.9 6.2 2.2 5.1 7.2 4.1 0.8 2.6 1.6 0.8 0.9 -- Feldspar ----
--
--
--
-- 1.3 5 .O 6.6 5.0 10.8 4.0 Diorite 1.9 1.4 3.1 1.8 1.2 -- - - ----
--
--
-- Gneiss-Schist 2.5 5.1 10.5 9.3 7.5 4.1 6.4 1.8 0.9 1.1 0.6 -- Basalt 1.9 4.5 4.0 3.9 6.9 3.2 2.6 2.4 0.7--
0.3--
Misc. Igneous--
0.3 0.9 0.6 0.6 1.5 2.1 1.2 2.0 5.3 7.0 2.0Rocks and Opaque Mineralsc
Particle Shape 19 to 6 mm (%) No. 4 to No. 16 (%) No. 30 to No. 200 (%)
Subrounded to rounded 30 20 10
Subrouncfed to subangular 40 40 40
Angular 30 40 50
a "Ironstone," made up of jasper and hematite, is included in the chert classification.
? V ! " I " .
Table 2.4 Physical Properties of Aggregates
Siliceous Cxbonate
Specific gravity of sand Specific gravity of gravel
Moisture content of sand, % 4.0 3.0
Moisture content of gravel, % 1 .O 1 .O
Saturated surface dry density of gravel, kgm3 (lblft3)
Table 2.5 Approximate Batch Quantities
Siliceous Carbonate Lightweight Aggregate Aggregate Aggregate
Item Concrete Concrete Concrete
Cement, kg/m3 307 346 418
Coarse Aggregate, kg/m3 1054 1065 534
Sand, kg/m3 87 1 816 747
Water, kg/m3 154 193 114
Air Entraining Agent oarex), ml/L3 0.194
Superplasticizer (Pozzolith 84), ml/L3 6.86 1.45
Average Air Content, 9% 1.7 1.9 7.0
Average Unit Weight, kg,,m3 2400 2400 1840
Average Compressive Strength at 28 days, MPa
Table 2.6 Tensile Strength of Steel
Yield Stress Ultimate Strength
Bar # MPa fksi 1 MPa (nsi 1
3 427 (61.8) 671 (97.3)
6 442 (64.1) 721 005)
7 414 (60) minimum not tested
8 444 (64.3) 730 (106)
10 414 (60) minimum not tested
Table 2.7 Reinforcing Bars and Steel Plates
Column Machining Plates
Size Diameter De~th Dimensions
[in.) mm (in.) mm (in.) mm (in.)
12 x 12 19 (314) 19 (314) 533 x 533 x 25 21 x21 x 1 8 x 8 13 (112) 19 (314) 5 3 3 x 5 3 3 ~ 2 5 2 1 x 2 1 ~ 1 16 x 16 19 (314) 32 (1 114) 864 x 864 x 38 34 x 34 xl 112 12 x 18 16 (518) 32 (1 114) 533 x 864 x 38 21 x 34 x 1 112 8 x 3 6 13 (112) 19 (314) 1 0 1 6 x 5 3 3 ~ 2 5 4 0 x 2 1 ~ 1 14 diameter 16 (518) 19 (314) 5 3 3 x 5 3 3 ~ 2 5 2 1 x 2 1 ~ 1
3 TEST DESCRIPTIONS AND RESULTS
This chapter contains results and observations from each of the 41 tests. They are presented according to test purpose and major characteristics, as follows:
a) standards b) carbonate aggregate c) lightweight aggregate d) high-strength concrete e) restraint f) doubled reinforcement g) size and extra steel
h) shape
i) end conditions
j) other than standard fire k) eccentric load
1) eccentric load with constraints
The basic characteristics of the specimens have been given in Table 2.1; these will be reiterated for each test, with explanations where necessary. Also, diagrams of the specimens and thermocouple locations are presented here.
3.1 STANDARD TESTS
Cross-Section: 305 x 305 mm (12 x 12 in.) Length: 3810 rnrn (12 ft 6 in.)
Aggregate: Siliceous
Reinforcement: 2.19% as four No. 8 bars.
Elevation, Cross-Section and Finishing Detail: Figure 3.1.1 Layout of Thermocouple Frames in Concrete: Figure 3.1.2 Locations of Thermocouples in Frames: Figure 3.1.3 Locations of Thermocouples on Reinforcing Bars: Figure 3.1.4 3.1.1 Series I. Column I
Test purpose: Reference Column, Unloaded, Dry Condition. Date tested: September 19, 1979.
Loading: none.
Measured Pro~erties:
Cylinder strength: 34.2 MPa at 28 days. Relative humidity: 5%.
Results:
Test duration: 4 hours.
Temperatures: Tables 3.1.1 and 3.1.2a to d.
Note: temperatures measured in the column after about 3 hours are not reliable due to large axial expansion of the column and consequent strain on the thermocouple wires. Some thermocouples were damaged in transit and did not function from the beginning of the test.
Observations
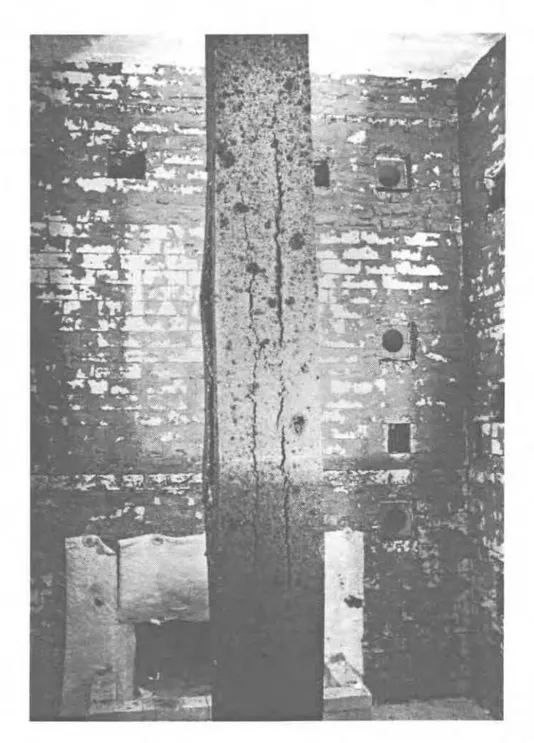
0:00 Horizontal hairline cracks were observed on the surface of the specimen before the test.
1:30 Narrow longitudinal cracks 10 to 15 cm long were observed on two sides of the column.
Figure 3.1.5 shows the column in the furnace chamber after the test. The cracks in the column were too narrow to be seen in this picture.
3.1.2 Series I. Column 2
Test purpose: Reference Column, Dry Condition. Date tested: June 19, 1981.
Loading: 1333 kN, Concenmc.
Measured P r o ~ e m e ~ :
Cylinder strengths: 31.0 MPa at 28 days. 36.9 MPa on test date. Relative humidity: 15%.
Results:
Test duration: 2 hours 50 minutes.
Temperatures: Tables 3.1.3 and 3.1.4a to d. Axial deformations: Table 3.1.5
Observations
050 Hairline cracks were observed on all faces.
2:10 Wider cracks could be seen on all faces, from 15 to 30 cm in length , and from 1.5 to 5 mrn in width.
2:30 The rate of contraction of the column increased rapidly.
3.1.3 Series I. Column 3
Test purpose: Reference Column, Load Effect. Date tested: April 25,1980.
Loading: 800 kN, Concentric.
Measured Pro~erties:
Cylinder strengths:Compressive strength: 34.8 MPa at 28 days. 34.2 MPa on test date.
Relative humidity: 70%. Results:
Test duration: 3 hours 38 minutes.
Temperatures: Tables 3.1.6 and 3.1.7a to d. Axial deformations: Table 3.1.8
0:18 Water oozed out on the cast column surface, 45 cm from the furnace bottom, and dried in 5 min.
0:28 On the E surface, crack A extended 10 to 13 cm. New crack B developed about 5 cm from crack A towards the centerline of the columns.
0:45 About 10 cm from the top end of crack A, a new crack C formed. At this time, cracks became visible on the N and S faces of the column.
1:00 Many fine cracks were seen on the N face. More were seen on the W face. 2:26 Cracks A, B, and C formed a continuous crack about 6 to 10 mm wide. 3:16 Crack ABC increased in width to about 25 mm.
3:38 Column failed as a result of crushing of the concrete with local buckling of the reinforcing bars. Figure 3.1.7 is a sketch of the deformed bars.
3.1.4 Series I. Column 4
Test purpose: Reference Column, Load Effect. Date tested: March 19,1980.
Loading: 7 1 1 kN, Concentric. Measured Pro~ertie~:
Cylinder strengths: 31.7 MPa at 28 days. 35.1 MPa on test date. Relative humidity: 63%.
Results.
-.
Test duration: 3 hours 40 minutes.
Temperatures: Tables 3.1.9 and 3.1.10a to d. Axial deformations: Table 3.1.1 1
0:45 A vertical crack, 10 to 12.5 cm long, appeared on the E face at 45 cm from the bottom.
1:00 Long hairline vertical cracks that followed the main reinforcing steel located in the SE comer were seen on both S and E surfaces.
3:00 The cracks on the E face were 30 m long and 3 to 6 rnrn wide.
3:40 Failure by crushing of the concrete and buckling of the main reinforcing bars. Figure 3.1.8 shows part of the column in the furnace after concrete has been removed to expose the reinforcing bars.
3.1.5 Series I. Column 7
Test purpose: Reference Column, Load Effect. Date tested: July 11, 1980.
Loading: 1067 kN, Concentric.
Measured Pro~ertie~:
Cylinder strengths: 35.3 MPa at 28 days. 36.1 MPa on test date. Relative humidity: 74%.
Results:
Test duration: 3 hours 28 minutes.
Temperatures: Tables 3.1.12 and 3.1.13a to d. Axial deformations: Table 3.1.14
Observations
Four vertical cracks 10 to 15 cm long appeared on the E face of the column.
Another crack formed 10 cm below one of the cracks on the same face. A long vertical crack was seen on the N face, and a long hairline crack appeared on the W face.
Two cracks on the E face (056) extended and joined together. The crack on the N face widened.
The long crack on the E face widened to about 1.5 mm. The concrete temperature was about 760°C near the exposed surface and 1 150°C at the center. The steel temperature was near 427OC.
Some hairline cracks were seen on the S face. The long E face crack was 3 mm wide.
Column expansion due to heating reached its maximum and stabilized. The long E face crack was 6 mm wide.
Zero column expansion was recorded.
Electrical power was lost ; gas to the burners was automatically shut off. Power came back on and the fire resumed. Cracks on the S face appeared to be about 10 mm wide, and the long E face crack about 13 mm wide. Hydraulic pressure suddenly dropped and column failed due to crushing of
3.1.6 Series I. Column 8
Test purpose: Reference Column, Load Effect. Date tested: September 12, 1980.
Loading: 1778 kN, Concentric.
Measured Prouertie~:
Cylinder strengths: 33.5 MPa at 28 days. 34.8 MPa on test date. Relative humidity: 74%.
Results:
Test duration: 2 hours 26 minutes.
Temperatures: Tables 3.1.15 and 3.1.16a to d. Axial deformations: Table 3.1.17
Observations
Two short vertical cracks appeared on the lower part of the E face.
A hairline crack was seen on the upper S face, two cracks A and B became visible on the upper E face, and a hairline crack appeared on the N surface. Cracks A and B extended to join and form AB, 35 cm long.
Three more cracks were detected on the S face.
Column expansion reached its maximum value and stabilized
Crack
AB lengthened to 45 cm. A new crack appeared on the E face. Crack AB widened to 20 rnm and extended to 60 cm.Crack C, about 90 cm long, was observed on the W face. Crack AB was now about 10 m m wide.
Explosive failure occurred due to crushing of the concrete. Pieces of concrete 60 to 120 cm long and 10 to 20 cm wide fell from cracks AB and C. Figure 3.1.10 is a photo of the top of the column after the test.
3.1.7 Series I. Column 9
Test purpose: Reference Column, Load Effect. Date tested: February 5, 1981.
Loading: 1333 kN, Concentric.
Measured Prouertie~:
Cylinder strengths: 36.8 MPa at 28 days. 38.3 MPa on test date. Relative humidity: 75%.
Results:
Test duration: 3 hours 7 minutes.
Temperatures: Tables 3.1.18 and 3.1.19a to d. Axial deformations: Table 3.1.20
Observations
0:30 A crack developed on the N side, about 60 cm from the ceiling.
2:00 Cracks developed on all sides of the column, the largest being more than 90 cm long and nearly 6 mrn wide.
u
305 mm
533 x 533 x 25 m m
THICK STEEL PLATE
DETAIL
C
Figure 3.1.1 Elevation, Cross-Section and Finishing Detail: 12 x 12 Section with 2.19% Steel
T/C FRAME A
7
SFCTlON A-A T/C FRAME B ON BACK FRAME C FRONT SECTION0-8
T/C FRAME 14 13 1 2 1 1 A 28 27 26 25 B 42 41 40 39 C 56 55 54 53 D
TIC
4,Table 3.1.1 Steel Temperatures, Series I Column 1
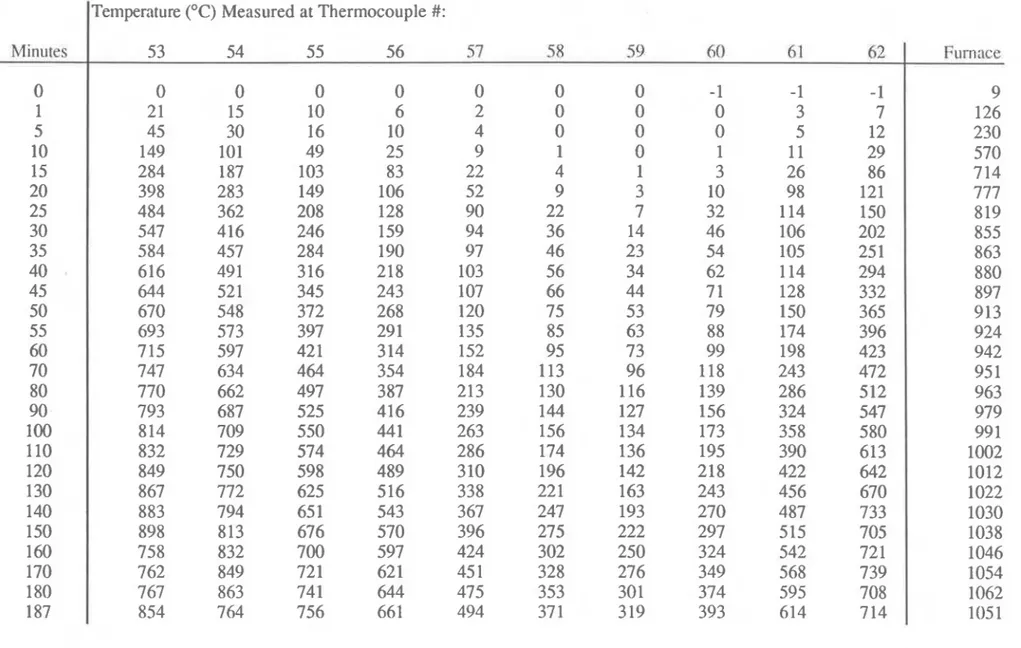
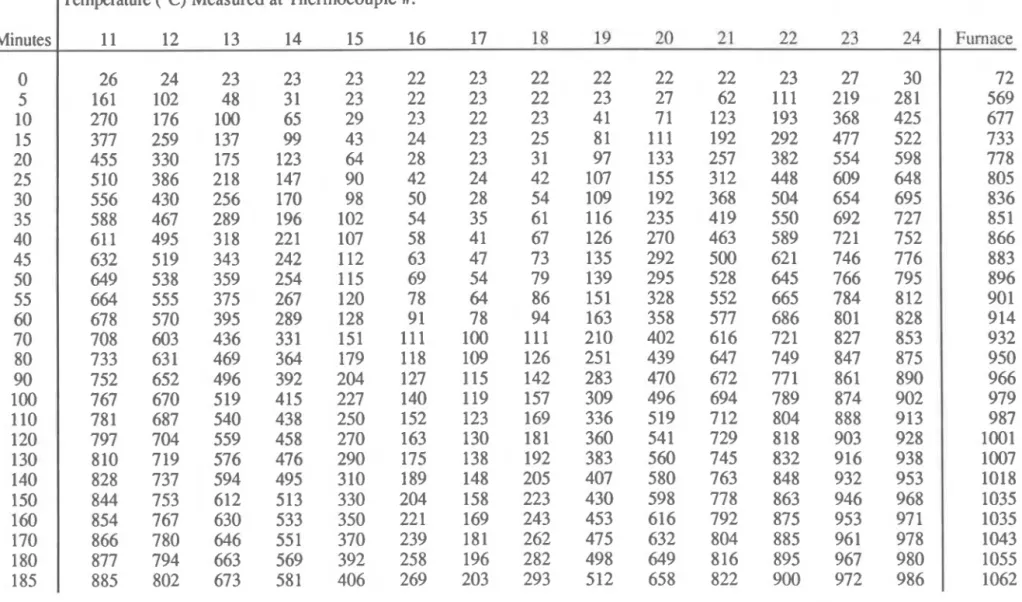
Table 3.1.2a Concrete Temperatures in Frame A, Series I Column 1
I
Temperature ("C) Measured at Thermocouple #:Table 3.1.2b Concrete Temperatures in Frame B, Series I Column 1
Table 3 . 1 . 2 ~ Concrete Temperatures in Frame C, Series I Column 1
Minutes
Temperature ('C) Measured at Themocouple #:
Table 3.1.2d Concrete Temperatures in Frame D, Series I Column 1
Table 3.1.3 Steel Temperatures, Series I Column 2
Minutes
Temperature (OC) Measured at Thermocouple #:
Table 3.1.4a Concrete Temperatures in Frame A, Series I Column 2
1
~emperature (OC) Measured at Thermocouple #:Minutes
I
11 12 13 14 15 16 17 18 19 20 2 1 22 2 3 241
FurnaceTable 3.1.4b Concrete Temperatures in Frame B, Series I Column 2
Minutes
I
Temperature (OC) Measured at Thermocouple #:
Table 3.1.4~ Concrete Temperatures in Frame C, Series I Column 2
Minutes
I
Tempemure (OC) Measured at Thermocouple #:
Table 3.1.4d Concrete Temperatures in Frame D, Series I Column 2
Minutes
Tempemure (OC) Measured at Thermocouple #:
Table 3.1.5 Deflections, Series I Column 2 Minutes 0
5
10 20 30 40 50 60 70 80 90 100 110 120 130 140 150 160 EX ansion, m mL
Table 3.1.6
Minutes
Steel Temperatures, Series I Column 3
remperature ('C) Measured at Thermocouple #:
Table 3.1.7a Concrete Temperatures in Frame A, Series I Column 3
Table 3.1.7b Concrete Temperatures in Frame B, Series I Column 1
Minutes
1
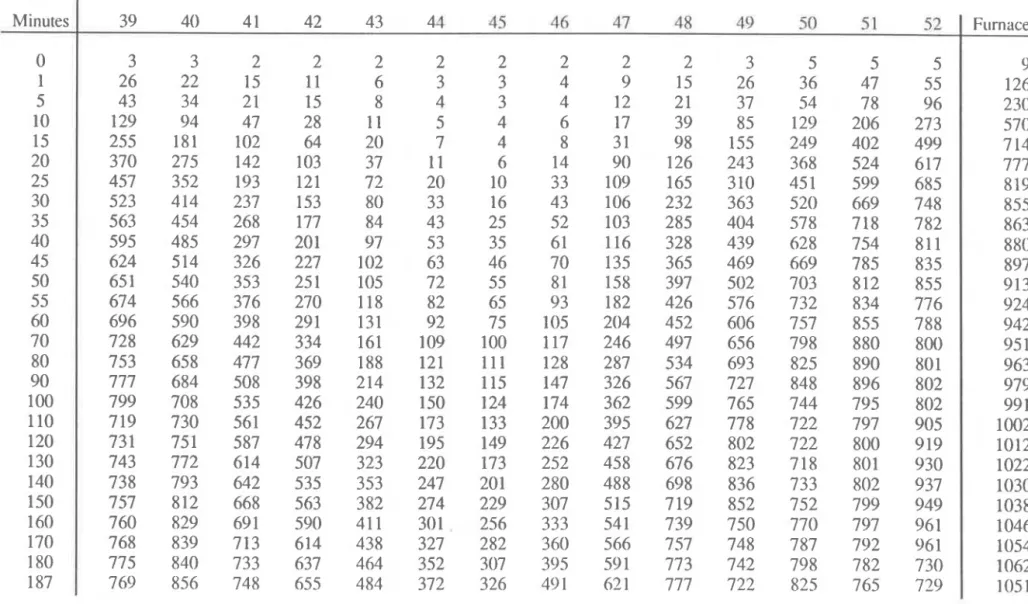
~emperature CC) Measured at Thermocouple #:Table 3.1.7~ Concrete Temperatures in Frame C, Series I Column 3
I
Temperature ('C) Measured at Thermocouple #:Furnace 20 446 687 812 845 875 92 1 932 946 960 988 974 1010 1027 1039 1050 1061 Minutes 39 40 41 42 43 44 45 46 47 48 49
Table 3.1.7d Concrete Temperatures in Frame D, Series I Column 3
Minutes
Temperature ('C) Measured at Thermocouple #:
Table 3.1.8 Deflections, Series I Column 3 Expansion, m m 0.0 0.3 1.5 2.4 2.8 3.3 3.8 3.9 5.3 6.0 6.4 6.6 6.0 4.9 4.0 2.9 1.3 -0.9 -3.8
Table 3.1.9 Minutes 0 5 10 20 30 40 50 60 70 80 90 100 120 140 160 180 200 220
Steel Temperatures, Series I Column 4
remperature ('C) Measured at Thermocouple #:
1 2 3 4 5 6 7 8 Furnace 21 496 69 1 779 838 877 952 927 94 1 952 963 982 1010 1016 1038 1052 1066 1077
Table 3.1.10a Concrete Temperatures in Frame A, Series I Column 4
I
Temperature ('C) Measured at Thermocouple #:Table 3.1. lob Concrete Temperatures in Frame B, Series I Column 4 Minutes 0 5 10 20 30 40 50 60 70 80
90
100 120 140 160 180 200 220remperature ('C) Measured at Thermocouple #:
Table 3.1.10~ Concrete Temperatures in Frame C, Series I Column 4
Table 3.1.10d
Minutes
Concrete Temperatures in Frame D, Series I Column 4
:emperature ('C) Measured at Thermocouple #:
Furnace 2 1 496 69 1 779 838 877 952 927 94 1 952 963 982 1010 1016 1038 1052 1066 1077
Table 3.1.11 Deflections, Series I Column 4 Minutes 0 5 10 20 30 40 50 60 75 90 105 120 135 150 165 180 195 210 Expansion, mrn
Table 3.1.12 Steel Temperatures, Series I Column 7
Minutes
I
Temperature (OC) Measured at Thermocouple #:
Table 3.1.13a Concrete Temperatures Measured in Frame A, Series I Column 7
I
~emperature ( O C ) Measured at Thermocouple #:Table 3.1.13~ Concrete Temperatures Measured in Frame C, Series I Column 7
l ~ e m p m r u r e (OC) Measured at Thermocouple #:
Table 3.1.1 3d Concrete Temperatures Measured in Frame D, Series I Column 7
Minutes
Tempe~ature (OC) Measured at Thermocouple #:
Table 3.1.14 Deflections, Series I Column 7 Minutes 0 5 10 20 30 40 50
60
75 90 105 120 130 1 40 150 160 170 180 190 200 Expansion, mrn 0.0 0.3 0.7 2.3 2.7 3.0 3.7 4.1 5.0 5.7 6.0 6.0 5.9 5.5 5.0 4.2 2.8 1.4 -0.4 -4.0Table 3.1.15 Steel Temperatures, Series I Column 8
I
Temperature (OC) Measured at Thermocouple #:Furnace
Table 3.1.16a Concrete Temperatures Measured in Frame A, Series I Column 8
Minutes
I
Temperature (OC) Measured at Thermocouple #:
Table 3.1.16b Concrete Temperatures Measured in Frame B, Series I Column 8
Minutes
I
Temperature (OC) Measured at Thermocouple #:
Table 3.1.16~ Concrete Temperatures Measured in Frame C, Series I Column 8 Minutes 0 5 10 15 20 25 30 35 40 45 50 55 60 70 80 90 100 110 120 130 140
I
Temperature (OC) Measured at Thermocouple #:Table 3.1.16d Concrete Temperatures Measured in Frrime D, Series I Column 8
Minutes
Temperature (OC) Measured at Thermocouple #:
Table 3.1.17 Deflections, Series I Column 8
Titble 3.1.18 Steel Teniperat~~res, Series I Column 9
Minutes
Temperature ("C) Measured at Thermocouple #:
T~ble 3.1.19a Coricrete Temper;lti~res i n Frame A, Series I Column 9
Minutes
Temperature ( O C ) Measured at Thermocouple #:
Table 3.1.19b Concrete Temperatures in Fri~nie B, Series I Colun~n 9 Minutes 0 1 5 10 15 20 25 30 35 40 45 50 55 60 70 80 90 100 110 120 130 140 150 160 170 180 187
Tenyxrature (OC) Measured at Thermocouple #:
Table 3.1.19~ Concrete Temperatures i n Frame C, Series I Column 9 Minutes 0 1 5 10 15 20 25 30 3 5 40 45 50 55 60 70 80 90 100 110 120 130 140 150 160 170 180
Temperature ("C) Measured at Thermocouple #:
Table 3.1.19d Concrete Temperatures in Frame D, Series I Column 9
Table 3.1.20 Deflections, Series I Column 9 Minutes Expansion, m m 0.0 0.1 0.5 1.7 2.5 2.7 3.3 3.7 4.1 4.2 3.9 3.8 3.8 3.8 4.0 4.0 3.1 2.0 0.4 -1.9
3.2 EFFECT OF CARBONATE AGGREGATE
Cross-Section: 305 x 305 mm (12 x 12 in.) Length: 3810 mm (12 ft 6 in.)
Aggregate: Carbonate
Reinforcement: 2.19% as four No. 8 bars. Elevation, Cross-Section and Finishing Detail: Layout of Thermocouple Frames in Concrete: Locations of Thermocouples in Frames:
Locations of Thermocouples on Reinforcing Bars:
Figure 3.1.1 Figure 3.1.2 Figure 3.1.3 Figure 3.1.4 3.2.1 Series I. Column 10
Test purpose: Effect of Carbonate Aggregate. Date tested: December 14, 1981.
Loading: 800 kN, Concentric.
Measured Pro~erties:
Cylinder strengths: 33.6 MPa at 28 days. 40.9 MPa on test date. Relative humidity: 75%.
Results.
-.
Test duration: 8 hours 30 minutes.
Temperatures: Tables 3.2.1 and 3.2.2a to d. Axial deformations: Table 3.2.3
Observations
Small hairline cracks 50 to 75 mm long were observed on the E face of the column. Small cracks then appeared on other faces.
The maximum expansion of 14 mm was reached.
All major cracks had developed, and progressively worsened.
Cracks on the E face were about 30 cm long and 6 mm wide. Cracks on other faces had also worsened.
Column started to contract (from initial zero). S teel temperature exceeded 760°C ( 1 400°F). S teel temperature reached 8 16OC (1 500°F). The contraction was 20 mm and accelerated.
Contraction was 24 mm as the column failed in compression with a mild crushing sound (Figure 3.2.1).
3.2.2 Series I. Column 1 1
Test purpose: Effect of Carbonate Aggregate. Date tested: October 13, 1981.
Loading: 1067 kN, Concentric.
Measured Pro~emes:
Cylinder strengths: 33.5 MPa at 28 days. 36.9 MPa on test date. Relative humidity: 75%.
Test duration: 6 hours 6 minutes.
Temperatures: Tables 3.2.4 and 3.2.5a to d. Axial deformations: Table 3.2.6
Observations
2:11 Small hairline cracks 30 rnm long were observed on the S face. 4:00 Pronounced cracks developed.
6:00 Steel temperature exceeded 760°C (140O0F), and the column contracted about 20 mm from its initial loaded stage.
6:06 The column failed in compression with a strong crushing sound. A piece of concrete 60 cm long and 15 cm wide fell from the S face near the upper quarter point (Figure 3.2.2).
3.2.3 Series I. Column 12
Test purpose: Effect of Carbonate Aggregate. Date tested: January 22, 1982.
Loading: 1778 kN, Concentric.
Cylinder strengths: 34.2 MPa at 28 days. 39.9 MPa on test date. Relative humidity: 76%.
Results:
Test duration: 3 hours 36 minutes.
Temperatures: Tables 3.2.7 and 3.2.8a to d. Axial deformations: Table 3.2.9
Observations
l:00 A hairline crack was observed on the E face, 120 cm above the floor. 1 : 15 One or two short hairline cracks appeared at mid-height on all faces. 1 :50 Column started to contract.
3:08 Cracks on N face were 60 cm long and 3 mm wide. 3:25 Cracks on E face widened to 6.5 mm.
3:28 Cracks on N face were 6 to 10 mm wide. 3:32 Cracks on N and S faces widened to 13 mm.
3:35 Cracks on E face reached 90 cm long and 13 mm wide. The column failed in compression. Concrete cover ruptured on all sides near the upper quarter point. A diagonal crack developed through the core of the column at the centre of the failed portion, and all main bars buckled (Figure 3.2.3).
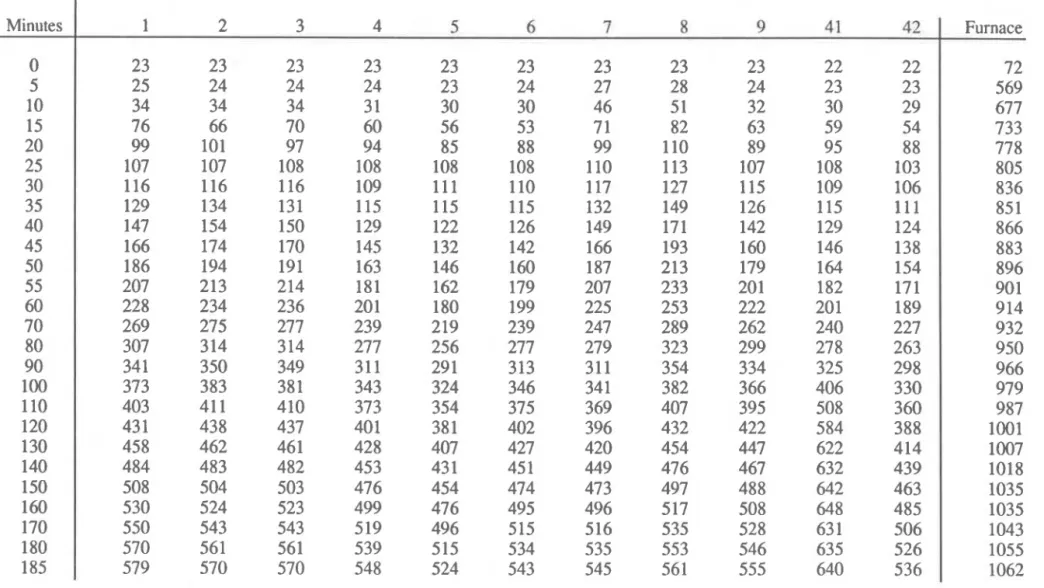
Table 3.2.1 Steel Temperatures, Series I Column 10
I
Temperati~re(OC)
Measured at Thermocouple #:Table 3.2.2a Concrete Tempenttures in Frame A, Series I Column 10
Minutes
Teniperiture (OC) Measured at Thermocouple #:
Table 3.2.2b Concrete Temperatures in Frame B, Series I Column 10
Minutes
I
Table 3 . 2 . 2 ~ Concrete Temperatures in Frame C, Series I Column 10
I
Temper~ture ("C) Measured at Thermocouple #:Table 3.2.2d Concrete Temperatures in Frame D, Series I Column 10
Minutes
I
Tempemture ( O C ) Measured at Thermocouple #:
Table 3.2.3 Deflections, Series I Column 10 Minutes 0 5 10 20 30 40 50 60 70 80 90 100 120 140 160 180 200 220 240 260 280 300 330 360 390 420 450 480 Expansion, rnm 0.0 0.4 1.2 3.6 4.5 5.1 5.8 6.9 7.8 8.6 9.3 10.0 10.8 11.1 11.1 10.9 10.3 9.4 8.2 6.5 4.4 2.2
-
1.2 -4.3 -7.2-
10.0 -13.2 -18.2Table 3.2.5b Concrete Temperatures in Frame B, Series I Column 1 1
Minutes
I
Temperature (OC) Measured at Thermocouple #:
Table 3 . 2 . 5 ~ Concrete Temperiitures in Frame C, Series I Column 1 1
Minutes
I
Temperature (OC) Measured at Thermocouple #:
Table 3.2.5d Concrete Temperatures in Frame D, Series I Column 11
Minutes
I
Temperature (OC) Measured at Thermocouple #:
Table 3.2.6 Deflections, Series I Column 1 1 Minutes Expansion, m m 0.0 0.5 1
.o
2.9 3.7 4.2 4.8 5.5 6.1 6.6 7.2 7.5 7.8 7.9 7.9 7.1 5.8 4.0 1.6 -1.5 -5.0 -8.8 -12.6 -16.1 -19.6Table 3.2.7 S tee1 Temperatures, Series I Column 12
I
Temperature (OC) Measured at Thermocouple #:Furnace
Table 3.2.8a Concrete Temperatures in Frdme A, Series I Column 12
Minutes
l~ern~erature
(OC)
Measured at Thermocouple #:Table 3.2.8b Concrete Temperatures in Frame B, Series I Column 12
Minutes
I
Temperature
(OC)
Measured at Thermocouple #:Table 3 . 2 . 8 ~ Concrete Temperatures in Frame C, Series I Column 12