Publisher’s version / Version de l'éditeur: Building Acoustics, 6, September, pp. 269-288, 1999
READ THESE TERMS AND CONDITIONS CAREFULLY BEFORE USING THIS WEBSITE.
https://nrc-publications.canada.ca/eng/copyright
Vous avez des questions? Nous pouvons vous aider. Pour communiquer directement avec un auteur, consultez la première page de la revue dans laquelle son article a été publié afin de trouver ses coordonnées. Si vous n’arrivez pas à les repérer, communiquez avec nous à [email protected].
Questions? Contact the NRC Publications Archive team at
[email protected]. If you wish to email the authors directly, please see the first page of the publication for their contact information.
This publication could be one of several versions: author’s original, accepted manuscript or the publisher’s version. / La version de cette publication peut être l’une des suivantes : la version prépublication de l’auteur, la version acceptée du manuscrit ou la version de l’éditeur.
For the publisher’s version, please access the DOI link below./ Pour consulter la version de l’éditeur, utilisez le lien DOI ci-dessous.
https://doi.org/10.1260/1351010991501455
Access and use of this website and the material on it are subject to the Terms and Conditions set forth at
Vibration response of lightweight wood frame building elements
Nightingale, T. R. T.; Bosmans, I.
https://publications-cnrc.canada.ca/fra/droits
L’accès à ce site Web et l’utilisation de son contenu sont assujettis aux conditions présentées dans le site LISEZ CES CONDITIONS ATTENTIVEMENT AVANT D’UTILISER CE SITE WEB.
NRC Publications Record / Notice d'Archives des publications de CNRC: https://nrc-publications.canada.ca/eng/view/object/?id=c7840646-9704-4db3-aac2-414a11fddc71 https://publications-cnrc.canada.ca/fra/voir/objet/?id=c7840646-9704-4db3-aac2-414a11fddc71
Nightingale, T. R. T.; Bosmans, I.
A version of this paper is published in / Une version de ce document se trouve dans : Building Acoustics, v. 6, no. 3/4, 1999, p. 269-288
www.nrc.ca/irc/ircpubs
Vibration response of lightweight wood frame building
elements
T.R.T. Nightingale and Ivan Bosmans
National Research Council Canada, Institute for Research in Construction, Acoustics, Montreal Road, Ottawa, Ontario, K1A 0R6, Canada.
Summary: Direct and indirect measurements of the vibration response of several wood-framed walls and floors were made. The data indicate that these building elements do not behave like a homogeneous and isotropic system but rather exhibit a response typical of a periodic plate/beam structure. There is localization of energy near the excitation point and very strong attenuation with distance in the direction normal to the framing members. This region of high attenuation is followed by one of considerably reduced attenuation. A systematic study of a floor/ceiling assembly indicated that the onset of this second attenuation region was caused by the presence of a butt joint in the plate. It is speculated that the weak bending-to-bending coupling caused by the butt joint reduced the bending energy enough so that wave conversion from in-plane to bending at each plate/beam joint accounted for the presence (and in some cases near-constant level) of bending energy after the butt joint.
1. INTRODUCTION
In order to predict the apparent sound insulation in a building the sound energy transmitted by all significant flanking paths must be considered. The effect of structure-borne flanking paths can only be predicted when the vibration response of the flanking surfaces are well characterized. The simplest prediction model is perhaps a statistical energy analysis (SEA) model in which it is assumed that each wall or floor surface can be treated as a single subsystem (i.e., a group of modes having similar properties and modal energies). A structure-borne flanking path will exist when there is a joint connecting a source and receive room surface. This simplified description has proven adequate for heavy, reasonably homogeneous and isotropic constructions with moderate damping (e.g., cast-in-place concrete buildings). These characteristics ensure that on average (a.) surfaces will have uniform vibration response (and hence acoustic radiation) when excited along the edge by the joint, (b.) the resulting
structural power incident on the joint from impact excitation will be independent of the position of the source, and (c.) for airborne excitation the amount of structural power incident at the joint is linearly proportional to the surface area exposed to the sound field. It can be shown that if the radiation efficiency of the surface is uniform then by reciprocity conditions (a.) and (b.) are the same.
In this paper measured vibration response data are presented to show that lightweight wood frame constructions do not have these characteristics and should not be considered as homogeneous and isotropic, which is a necessary condition for treating flanking surfaces as a single subsystem and the application of simplified prediction models1,2. Rather, these surfaces exhibit a vibration response that is typical of a periodic plate/beam structure.
2. VIBRATION GRADIENTS IN A WOOD FRAMED FLOOR
Wood framed floors typically consist of a series of structural panels fastened to a set of wood joists (typically 38 x 235 mm) spaced at nominally regular intervals (typically 400 mm on center). The structural panels (2.42 x 1.21 m) that form the subfloor are either plywood or a board made from oriented wood strands (OSB). The long edges of these panels have an interlocking profile to provide increased mechanical connection to the next board, with a tongue and groove joint. The short edges do not have a profile and the resulting butt joint between panels must be supported by a joist as shown in Figure 1. The panels are also fabricated to be orthotropic with the stiffness parallel to the long axis several times stiffer than in the short direction3. The OSB sheets are fastened to the joists with screws at a nominally regular interval: 300 mm on center, except at a butt joint where the spacing is reduced to 150 mm. Depending on the span of the floor, additional stiffeners may be required in the form of wood strapping (typically 19 x 64 mm placed 600 mm on center on the bottom of the joists) and/or wood bridging placed diagonally between the joists (typically 19 x 64 mm and 1800 mm on center).
To obtain a preliminary look at the vibration response of this complex system an ISO tapping machine was placed near one of the corners of the room and the resulting normal surface velocity was measured every 200 mm along two lines, one perpendicular to the orientation of the joists and the other parallel to, and midway between, the joists as shown in Figure 1. The floor studied had both bridging and strapping.
2.1 Vibration Response Parallel to the Framing Members
From Figure 2, which shows the measured velocity normal to the surface for several one-third-octave bands, it can be seen that there is a general trend of reduced vibration level with increased distance from the source in a direction parallel to the joists. The vibration gradient is similar in the one-third-octave bands from 63 to 1000 Hz. In this range, there are no significant changes in velocity across the tongue and groove joints. However, for the 2 and 4 kHz one-third-octave bands the first tongue and groove joint marks the point at which there is a significant decrease in the surface vibration. This is indicative of the frequency at which the tongue and groove joint might be considered explicitly by dividing the floor into multiple subsystems.
Velocity level measurements were made on either side of several tongue and groove joints to investigate if the presence of these joints is likely to significantly effect the propagation of energy from one OSB sheet to the next and whether they should be included in a model of the floor. Figure 3 shows the measured change in the normal component of the surface velocity across several tongue and groove joints when the measurement points were located at a joist and approximately 25 mm on either side of the joint. If the joint did not alter the transmission of forces and moments then there would be no difference in the measured velocity between the two points, suggesting that the joint would not have to be included in a model of the floor. However, a change in the velocity might indicate that they should be considered. It should be noted that a measured level difference can not be extended to describe the propagating waves since it is likely that the measurement points are in the near field of the joint. Figure 3 shows that below about 1000 Hz there was, on average, no appreciable reduction in the vibration at a tongue and groove joint located at a joist. However, above this frequency there may be a level difference across the joint. The magnitude of the difference was quite variable.
Figure 4 shows the measured velocity reduction when the measurement points are on either side of a tongue and groove joint and midway between the joists. The data of Figures 3 and 4 indicate that not all tongue and groove joints behave similarly and that the joint may change characteristics along its length.
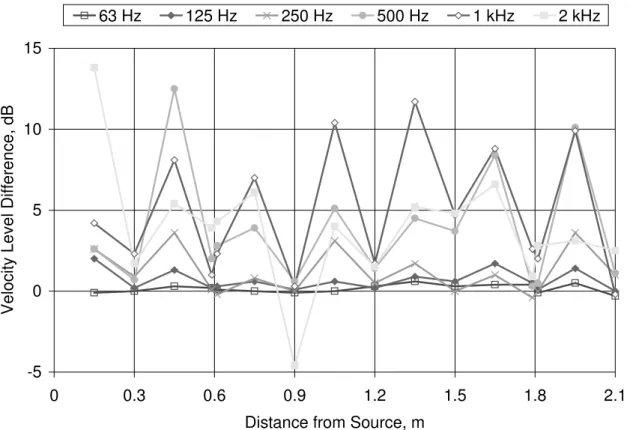
The OSB sheets are fastened to the joists at regular intervals so there will be a high frequency region where the fasteners act like independent point connections between the OSB and the joist. In the low frequencies, however, the spacing between the fasteners will be such that they do not act independently and the joint between the OSB and the beam acts like a line connection. It has been suggested that the transition between the two regimes occurs at the frequency at which the spacing between the fasteners is equal to a half wavelength4. This approach suggests that the transition between line- and point- connected regimes will occur between 200-250 Hz for the 16 mm thick OSB that has a Young’s Modulus of 1.53x10⁹ Pa in the direction parallel to the joist. In reality, the transition frequency occurs at higher frequencies because the fastening is not an ideal point connection and there is a finite contact area5. This makes the fasteners appear closer and tends to shift the transition to higher frequencies. An estimate of the frequency at which the transition occurs can be made by examining the difference between the measured normal velocity on the OSB subfloor immediately above a joist, and the normal velocity at the bottom of the joist. The line-connected regime is characterized by the same level on the OSB surface as at the bottom of the joist (i.e., a zero or near-zero velocity level difference). The point-connected regime will be characterized by a different velocity level on the OSB than on the bottom of the joist, especially for locations midway between fasteners. From Figure 5, which shows the measured level difference between the OSB and the bottom of a joist of the assembly of Figure 1, it is evident that the onset of a significant level difference occurs between 250 and 500 Hz suggesting that the transition from line- to point- connections occurs in this frequency range.
2.2 Propagation Perpendicular to the Framing Members
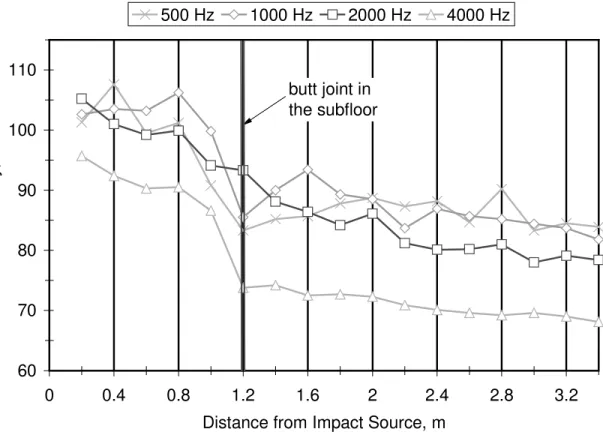
The vibration response was also measured in the direction perpendicular to the joists. (See Figure 1 for the measurement positions). The response is shown in Figures 6 and 7 for several one-third-octave bands. The data exhibit a rather steep gradient close to the source and then a second region where there is very little change in the vibration level with increasing distance. The transition between the two regions appears to coincide with the butt joint in the OSB subfloor.
To verify that the transition occurs at a butt joint and not at a specific distance from the source measurements were made on a small floor section in the laboratory. As shown in Figure 8, the
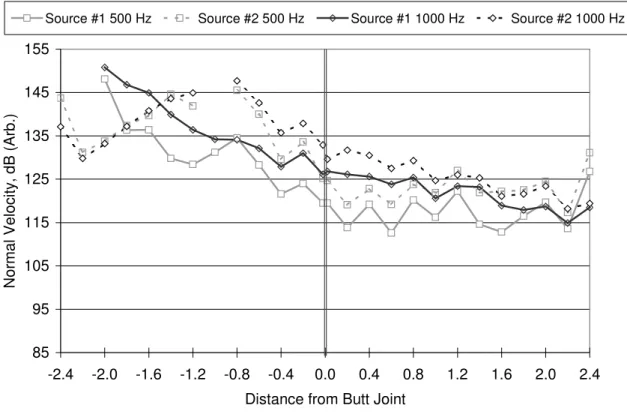
small floor consisted of two 1.2 x 2.4 m OSB sheets attached by a butt joint to form a 1.2 x 4.8 m specimen. Joists (38 x 235 mm) were placed every 400 mm on center down the length of the specimen and installed using the normal screw spacing (300 mm on center except at a butt joint where the spacing is 150 mm). Closed cell foam was placed between each joist end and the supporting structure to avoid possible structure-borne flanking paths. The vibration response of the specimen was measured every 200 mm along a line perpendicular to the joists and midway between the screws into the joists. Two source positions were used. The first was near the edge of the source surface, approximately 2.2 m from the butt joint and the second was approximately 1.0 m from the butt joint. Figures 9, 10 and 11 show the measured normal surface velocity for the two source positions. It is clear from the figures that the butt joint marks the point of transition between rapid attenuation with distance away from the source to one where there is less attenuation with distance. The 125, 250 and 500 Hz third-octave-band data of Figures 8 and 9 show this particularly well as there is relatively little attenuation with distance after the butt joint. It is interesting to note that although the vibration response of the source plate is very different for the two source positions for frequencies above 500 Hz, the response of the receive plate does not display the same degree of variation. Figure 11, which shows the response for 4000 Hz, indicates that the butt joint can introduce a rather significant vibration discontinuity.
Both the data for the complete floor assembly (Figures 6 and 7) and the data from the small floor section (Figures 9-11), suggest that the butt joint has a significant role in how structure-borne sound propagates across a wood framed floor. Steel et al.6, when measuring coupling loss factors involving a floor formed by pre-cast concrete units covered by a concrete screed, found that that there could be significant attenuation with distance in a direction perpendicular to the butt joints in the pre-cast units. The number of data points were not sufficient to determine if there was a discontinuity in the vibration response at the butt joints, although they did report the presence of cracks in the screed. It is possible that in both cases the butt joints may not allow efficient coupling of bending moments, causing a build-up of bending energy on the source plate and the apparent vibration reduction at the butt joint.
2.3 Discussion of vibration response of the floor/ceiling assembly
The rapid attenuation away from the source evident in the source plate of the wood frame assembly is characteristic of the vibration response of a periodic plate/beam structure7,8,9. In such a structure there exist frequency ranges for which the vibration energy is attenuated exponentially with distance from the source; these are referred to ‘stop bands’. Alternately, the frequency ranges where there is no excess attenuation due to the plate/beam interaction are referred to a ‘pass bands’. Early work studying simple one-dimensional infinite systems suggested that the attenuation with distance would be monotonic10, but later work on finite systems revealed that symmetry may create a situation where the levels in a bay away from the source were higher than those in the bays on either side7. This suggested the existence of a ‘tunneling’ that would preclude the use of traditional SEA in which it is assumed that there is a linear response to an input from the adjacent subsystems. The early work also identified the conditions necessary for attenuation and localization: structures must have coupled similar but slightly disordered subsystems, or have irregularly spaced constraints. A framed floor/ceiling assembly fits both of these requirements. If one views the joists and the OSB sheets between the joists as subsystems then they are coupled disordered systems. The disorder arises from the fact that the wood building materials, (especially OSB), are inhomogeneous, which means that the distance between beams expressed in terms of the wave number will be slightly different for each bay. Similarly, joists are not the same by virtue of the joists being inhomogeneous11 and fastener locations will not be identical either. The alternate condition of irregular constraints is satisfied by the joists which, as described above, appear to be located (and hence constrain the OSB) at irregular intervals.
In addition to revealing that periodic structures were sensitive to the degree of irregularity, with more irregular systems exhibiting higher attenuation, work on one-dimensional plate/beam systems also showed that the degree of attenuation will be strongly dependent on the damping of the plate. The width of the stop band (i.e., the frequency range) increased with increasing damping12, as did the rate of attenuation with distance. Studies of one-dimensional systems showed that the degree of localization of the energy near the source was a function of the coupling between adjacent oscillators (or subsystems). The degree of localization increased as the coupling between the adjacent subsystems decreased7. Unfortunately, the damping in a lightweight floor/ceiling assembly is quite high and the coupling between adjacent bays can be
quite low. These conditions are ideal for a high degree of energy localization near the source, and significant attenuation away from the source. This can obviously have a dramatic effect on the flow of energy in the system, and basic assumptions regarding the energy distribution implicit to SEA may have to be revised to reflect the presence of the pass and stop bands13. The study of a two-dimensional plate/beam structure14 showed that the presence or absence of a stop band was determined not only by the frequency but also by the angle of incidence of the bending wave. The predictions suggested that for certain angles of incidence it is possible for all frequencies to be in a stop band. For small plates that typically have a low modal density, the waves can be incident on the joint in a narrow angular range which may result in all the waves being in a stop band. In such a situation, the random incidence assumption would grossly overestimate the transmission.
The nature of the beams can play a significant role in the response of the system. Mead and Markus15 have shown that coupling between the wave types (bending, and in-plane waves) in a periodic structure having eccentric beams can cause two attenuation regions. Close to the source there is very high attenuation of bending waves, but this will change to one of greatly reduced attenuation, or even one where the vibration level is constant with distance. This would happen when the bending waves are highly damped (i.e., they are in a stop band), and the longitudinal waves are lightly damped. This creates a situation where the bending motion induced directly by the source will decay rapidly and will be located near the source due to the discontinuity introduced by the beams. Longitudinal waves will couple effectively across the beams and may travel significant distances with little attenuation. Energy conversion from longitudinal to bending at each plate/beam joint accounts for presence (and near uniform amplitude) of bending motion far from the source.
Ideally this would be verified by measuring both the flexural and in-plane components of the plate motion. However, estimation of the in-plane wave response cannot be obtained directly by placing accelerometers on the OSB sheathing with the pick-up axis parallel to the plane of the OSB, as the measured response will include the in-plane component corresponding to the bending motion of the plate. This effect will be particularly important near joints with eccentric beams.
In previous studies of periodic structures, the plates were typically isotropic and semi-infinite without any discontinuities. The butt joint in the systems investigated here may serve to further reduce the transmission of bending energy across the joint thereby making the effect of longitudinal waves and wave conversion more important than it would be for a continuous plate. This could cause the transition between the attenuation regions to occur at the butt joint.
To investigate the effect that a butt joint has on the bending-to-bending coupling at a plate/beam joint, two sets of coupling loss factor measurements were made. The first was on a 1.2 x 2.4 x 0.018 m OSB plate divided in two by adding a single 38 x 235 mm beam running across the 1.2 m width. The beam was fastened using 52 mm #10 straight shank wood screws spaced 300 mm on center which is representative of the joints in Figure 1. The other specimen was similar except that there were two 1.2 x 2.4 m plates fastened to the beam creating a butt joint and a resulting 1.2 x 4.8 m plate with a single beam at the butt joint. Again, 52 mm #10 straight shank wood screws were spaced 150 mm on center on each side of the butt joint to secure the OSB to the beam (joist) which is normal building practice and is representative of the butt joints in Figure 1. Figure 12, which shows the measured coupling loss factors for the plate/beam joints, indicates that the presence of the butt joint in the OSB considerably reduces the coupling between bending waves across the joint. The presence of this weaker coupling may partially explain the difference in the trends of the vibration response of the OSB sheathing on either side of a butt joint. Further work needs to be conducted to more completely characterize this type of joint.
The data in Figures 6 and 7 suggest that the vibration response might be grouped into three frequency regions. The first is a low frequency region (below 100 Hz) where the stiffness and dimensions of the complete assembly determine the response. This is illustrated by the 63 Hz data in Figure 6, where the vibration response of the floor does not have minima located at the joists although the joint between the joist and the OSB subfloor is likely in the form of a line (like the case shown in Figure 5). The second is a mid-frequency range (125 up to about 500 Hz) where the velocity level of the subfloor is lower near a joist than in the middle of a joist bay. The reduced level near the joist is caused by the line-connection between the OSB and the joist. The third region is a high frequency region (above 500 Hz) where the subfloor and joist are
point-connected. This is characterized by similar subfloor velocities at the middle of a joist bay and midway between screws over a joist, (especially after transmission across the butt joint).
3. INDIRECT MEASUREMENT OF VIBRATION GRADIENTS
If it is assumed that the radiation efficiency is constant over the surface of interest then an indirect measure of a gradient in the surface vibration can be obtained by measuring the radiated acoustic intensity when the surface is excited along an edge. Figure 13 shows that the measurement surface was continuous across the end of the partition between the source and receive rooms and that the surface was excited by airborne sound.
A convenient way of normalizing and comparing the measured data is to plot the percent of the total radiated sound power as a function of the percent of the floor exposed from the excitation edge. Ideally, the data from a uniformly radiating (and vibrating) surface will follow a straight line with unity slope (Figure 14). When more sound power is radiated near the excitation edge (due to a gradient in the surface velocity) the data will deviate from the linear response.
Figure 14 shows that in the 500 Hz one-third-octave band all the constructions exhibit a strong gradient in the radiated sound power, and hence by inference, in the surface velocity. Comparing the data for the joist cases it would appear that in general there is a stronger gradient when the vibration energy propagates perpendicular to the framing members. The data also indicate that there will be significant attenuation as the vibration energy propagates in a gypsum board surface perpendicular to the framing members. Comparing the results for propagation parallel to the joists with one and two layers of 16 mm OSB it would appear that the additional layer may increase the uniformity of the surface vibration. The additional layer will tend to increase the coupling across the plate/beam joint which should reduce the effect of the framing members and any attenuation that they might introduce.
Figure 15 shows the response of the surfaces in the 2000 Hz one-third-octave band. At this frequency, all the surfaces exhibit similar gradients and there does not appear to be a significant difference in attenuation for propagation parallel or perpendicular to the framing members. Comparing the attenuation with distance parallel to the framing member (Figure 2) with those for the perpendicular direction (Figures 7 and 11), the data also suggest that for this frequency the
rate of attenuation is similar in both directions. This suggests that attenuation with distance in the 2000 Hz one-third-octave band can not be fully explained by the periodicity of the structure and suggests the presence of another attenuation mechanism that is the same for propagation parallel and perpendicular to the framing member. Further work is needed to investigate this mechanism.
4. GENERAL DISCUSSION
In general, a lightweight framed structure is periodic only in one direction (perpendicular to the framing members) and in this direction there can be considerable attenuation with distance in certain frequency ranges as opposed to the non-periodic direction (parallel to the framing members). A complete prediction model should be able to correctly describe the propagation of structure-borne energy in both directions.
4.1 Implications for modeling of flanking transmission
In this section issues that might be considered when formulating models and measuring coupling loss factors are briefly discussed.
The following issues might be considered when modelling flanking paths that involve a lightweight framed building element:
• The surfaces of walls and floors are composed of several sheets which are connected to each other and to the framing members in different ways. Among the joints between the OSB subfloor and the joists, distinction can be made between joints where the plate is effectively continuous, or where two sheets are joined together in a butt joint (see Figure 12). In a direction normal to the framing members, tongue and groove joints are commonly used to connect the subfloor sheets (Figure 1). Each of these joints corresponds to a different degree of structure-borne sound attenuation, and should therefore be represented by a proper model.
• The series of fasteners used to connect the plate elements to the framing member causes a frequency dependent behavior of the joints. At low frequencies, where the distance between the fasteners is small compared to the wavelength in the plate, the joint behaves as a line connection. With increasing frequency, the joint gradually changes into a local connection,
where the actual connection is restricted to an area close to the fasteners. This transition from line to local connection should be included in the analysis.
• The eccentric plate/beam joints are characterized by a substantial conversion between bending and in-plane waves. Consequently, modelling flanking transmission in lightweight structures should include all wave types.
• One of the major problems when using SEA is the identification of the various subsystems. At this moment, it remains uncertain whether a framed floor or wall should be modeled as one subsystem or as multiple subsystems. When using the approach of Tso and Hansen14, a periodic structure should be treated as a single subsystem. This method does not seem entirely justified because it does not allow for the non-uniform distribution of vibration energy that was observed in this paper. This observation may be partly caused by the fact that walls and floors are not perfectly periodic systems. The alternative is to employ a model using multiple plate and beam subsystems. This model would allow a non-uniform distribution of vibration energy but it would not include the influence of possible pass and stop bands in the (nearly) periodic system. Additional research is required to determine a proper frequency range for each method and to explore the possibilities of combining both approaches.
• It is not clear if the junction vibration reduction index, Kij, of the standardized prediction model EN-12354 can be applied to lightweight constructions that have significant attenuation and wave conversion in the flanking surfaces. In-situ measurement of the velocity level difference between flanking surfaces in such constructions will be due to attenuation in both the source and receive surfaces as well as the joint connecting them. Attributing all forms of attenuation to the joint is obviously not correct. Thus, it is necessary to show that incorporating the attenuation in the flanking surfaces into the description of the joint attenuation is consistent with the underlying assumptions in the model. This is suggested as future work.
4.2 Implications for measuring flanking transmission
The attenuation with distance in framed surfaces has some important implications when measuring structure-borne sound transmission at joints between coupled walls and floors in wood frame buildings. In an ideal situation, the measurements would lead to an estimate of the coupling loss factor characterizing the joint. A practical method for estimating the coupling loss factor involves measuring the difference between the time and space averaged velocity levels of
the subsystems that are connected at the joint. In this approach, the source system is excited by hammer blows which are uniformly distributed over the source surface16. Based on the knowledge of the surface density of both subsystems and the total loss factor of the receiving subsystem, it is possible to obtain an estimate of the coupling loss factor from the measured mean velocity level difference. Since only the transverse velocity is measured, this approach leads to an estimate of the coupling loss factor corresponding to the energy flow between the two bending wave subsystems associated with both plate elements. It should be noted that the in-situ application of this technique is only justified as long as the contribution from other flanking paths, through which both subsystems are indirectly coupled, is insignificant. However, Craik17 showed that the contribution of the additional flanking paths may not be ignored and generally leads to an overestimation of the coupling loss factor for in-situ measurements. Also implicit in this method is the assumption that the surfaces over which the velocity is being measured may be considered as single subsystems. The latter condition implies that the vibration energy should be uniform over the surface of each subsystem.
The measured data presented in this paper indicate that the energy density is not uniformly distributed over the framed surface, suggesting that the surface should not be treated as a single subsystem. In this case, measurements of a coupling loss factor may be of limited use as the attenuation can not be attributed solely to the joint because there is also attenuation due to wave conversion in the source and receiving surfaces as well as the potential for stop band attenuation. These additional forms of attenuation may lead to erroneous estimates of the joint coupling loss factor. For surfaces exhibiting significant attenuation with distance, the experimental analysis of flanking transmission should therefore be restricted to measuring the difference between mean velocity levels on the two surfaces. This measure would adequately quantify the entire flanking path, including the wood frame surfaces as well as the joint. In addition, it would still be possible to rank different flanking paths according to their importance.
Finally, it should be noted that measuring the time and space averaged velocity over a surface exhibiting a non-uniform distribution of vibration energy may require a much larger number of measurement and excitation positions than for a homogeneous structure, as the actual distance between the excitation positions, the joint and the measurement positions becomes rather critical.
5. CONCLUSIONS
Direct and indirect measures of surface velocity indicate that wood frame building elements may not be considered as homogeneous and isotropic and hence do not meet the basic requirements for simplified prediction models (such as CEN and very basic SEA models) where it is assumed that all flanking elements can be considered to be a single subsystem. Propagation of structure-borne sound may be highly attenuated and will be a complicated function of the direction of propagation with respect to the framing members, the fastener spacing, the type of joints in the surface (tongue and groove or butt), the type and thickness of the surface, and the dimensions and spacing of the framing members. As with any built system, workmanship and variations in the materials will affect the response of the system. The number and type of joints considered in this paper is very limited and should not be taken as being typical of all joints that can be found in wood frame constructions. Further work is required to investigate the effect of construction variations such as thickness and type of subfloor, joist depth and width, workmanship, etc.
Data obtained for propagation perpendicular to the framing members exhibit the characteristics of a periodic plate/beam structure having eccentric beams – there is strong attenuation with distance near the source and a significantly reduced rate of attenuation at increased distances. A series of measurements showed that butt joints in the subfloor marked the transition between the two attenuation regions. It was also shown that the bending-to-bending coupling at a plate/beam joint having a butt joint is considerably weaker than if the plate were continuous. It is speculated that longitudinal waves will still couple effectively across the plate/beam joints and will travel significant distances with little attenuation. The eccentric beams cause wave conversion from longitudinal to bending which accounts for the presence (and near uniform amplitude) of bending motion far from the source. Further work is suggested to validate this.
source
joists
butt joint
tongue & groove joints
measurement points perpendicular to the joists
screws measurementpoints parallel to the joists
FIGURE 1: Sketch showing the location of the impact source, measurement points and the joints of the floor assembly used to examine the attenuation of bending waves. Fastener locations are only shown for those near the measurement points for clarity. Shown below are sections through the tongue and groove joint (left) and a section through a butt joint (right).
65 75 85 95 105 115 0 0.4 0.8 1.2 1.6 2 2.4 2.8 3.2
Distance from Impact Source, m
Surface Vel o ci ty, dB Arb. 63 Hz 125 Hz 250 Hz 500 Hz 1000 Hz 2000 Hz 4000 Hz tongue and groove
FIGURE 2: Measured surface velocity of the floor along the line parallel to the joists shown in Figure 1. The vertical lines indicate the location of tongue and groove joints in the OSB sheet subfloor.
-8 -6 -4 -2 0 2 4 6 8 10 63 125 250 500 1000 2000 4000 Frequency, Hz Vel o ci ty Reduct ion, dB
FIGURE 3: Normal surface velocity reduction measured at two points spaced 25 mm on either side of a tongue and groove joint. The measurement points are located above a joist. Data for five nominally identical joints are shown to indicate that there may be significant variation in the response of each joint in the high frequencies.
-8 -6 -4 -2 0 2 4 6 63 125 250 500 1000 2000 4000 Frequency, Hz Velocit y Reduct ion, dB
FIGURE 4: Measured normal surface velocity reduction measured at two points spaced 25 mm on either side of a tongue and groove joint. The measurement points are located midway between joists. Data for three nominally identical joints are shown to indicate that there may be significant variation in the response of each joint, especially in the high frequencies.
-5 0 5 10 15 0 0.3 0.6 0.9 1.2 1.5 1.8 2.1
Distance from Source, m
Vel oci ty Level Di ff er ence, dB 63 Hz 125 Hz 250 Hz 500 Hz 1 kHz 2 kHz
FIGURE 5: Difference in measured normal velocity between the OSB subfloor immediately above a joist and the bottom of the joist. The screw spacing is 300 mm on center and the vertical gridlines mark the locations of the screws from the OSB into the joist below. A very low velocity difference between the OSB and the joist at points in between the screws suggests that the spacing of screws is such that the OSB appears to be line-connected to the joists. Conversely, a peak in the velocity level difference at locations between the screws indicates a region where the OSB appears to be point-connected to the joist. At the tongue and groove joints, which are located at 0.6 and 1.8 m from the source, two measurement positions were used: one on either side of the joint. These positions indicate, just as those in Figure 3 did, that there can be a vibration discontinuity associated with this type of joint.
60 70 80 90 100 110 0 0.4 0.8 1.2 1.6 2 2.4 2.8 3.2
Distance from Impact Source, m
S u rf ace V e locit y , dB A rb. 63 Hz 125 Hz 250 Hz 500 Hz butt joint in the subfloor
FIGURE 6: Measured surface velocity along a line perpendicular to the orientation of the joists in the one-third-octave bands centered at 63, 125, 250 and 500 Hz. The grid lines indicate the location of the joists.
60 70 80 90 100 110 0 0.4 0.8 1.2 1.6 2 2.4 2.8 3.2
Distance from Impact Source, m
S u rf ace V e locit y , dB A rb. 500 Hz 1000 Hz 2000 Hz 4000 Hz butt joint in the subfloor
FIGURE 7: Measured surface velocity along a line perpendicular to the orientation of the joists in the one-third-octave bands centered at 500, 1000, 2000 and 4000 Hz
joists
butt joint
screws
source
position #1
source
position #2
FIGURE 8: Measured locations on the small measurement specimen, 1.2 x 4.8 m, used to assess the effect of source location on the vibration response of floor with a single butt joint. The two source positions are shown in the figure. Position #1 is approximately 2.2 m from the butt joint, while Position #2 is approximately 1.0 m from the butt joint. The joist dimensions, spacing, and vibration measurement locations were the same as those used in the full size floor assembly of Figure 1. The major difference is that this small specimen does not have a ceiling below or the strapping and bridging that were present in the full size assembly.
85 95 105 115 125 135 145 155 -2.4 -2.0 -1.6 -1.2 -0.8 -0.4 0.0 0.4 0.8 1.2 1.6 2.0 2.4 Distance from Butt Joint (m)
Normal Velocity, dB (Arb.)
Source #1 125 Hz Source #2 125 Hz Source #1 250 Hz Source #2 250 Hz
FIGURE 9: Measured surface velocity along a line perpendicular to the orientation of the joists in the one-third-octave bands centered at 125 and 250 Hz for two source positions shown in Figure 8. Source position #1 is located 2.2 m from the butt joint, while position #2 is located 1.0 m from the butt joint.
85 95 105 115 125 135 145 155 -2.4 -2.0 -1.6 -1.2 -0.8 -0.4 0.0 0.4 0.8 1.2 1.6 2.0 2.4 Distance from Butt Joint
N o rma l Ve lo ci ty, d B (Arb .)
Source #1 500 Hz Source #2 500 Hz Source #1 1000 Hz Source #2 1000 Hz
FIGURE 10: Measured surface velocity along a line perpendicular to the orientation of the joists in the one-third-octave bands centered at 500 and 1000 Hz for two source positions shown in Figure 8. Source position #1 is located 2.2 m from the butt joint, while position #2 is located 1.0 m from the butt joint.
85 95 105 115 125 135 145 155 -2.4 -2.0 -1.6 -1.2 -0.8 -0.4 0.0 0.4 0.8 1.2 1.6 2.0 2.4 Distance from Butt Joint
No rm a l Ve lo c ity , d B ( A rb .)
Source #1 2000 Hz Source #2 2000 Hz Source #1 4000 Hz Source #2 4000 Hz
FIGURE 11. Measured surface velocity along a line perpendicular to the orientation of the joists in the one-third-octave bands centered at 2000 and 4000 Hz for two source positions shown in Figure 8. Source position #1 is located 2.2 m from the butt joint, while position #2 is located 1.0 m from the butt joint.
80 85 90 95 100 105 110 100 200 400 800 1600 3150 Frequency, Hz Coupl
ing Loss Fact
or , dB r e 10 -1 2 Continuous OSB Plate OSB Plate with Butt Joint
Continuous OSB sheet OSB sheet with Butt Joint
FIGURE 12: Measured coupling loss factors for a plate/beam joint. In each case the OSB sheathing was 16 mm thick and the beam (joist) was 38 x 235 mm. In the case of the continuous OSB sheet the screws were spaced 300 mm on center into the beam and for the case with the butt joint the screws were spaced 150 mm on center. This reflects normal building practice. Despite the increased number of screws per unit length, the coupling between bays on either side of the joint is weaker when the there is a butt joint in the plate.
measurement surface
continuous surface
across the end of the
partition
high sound
insulation partition
source room
receive room
FIGURE 13: Sketch showing the method of providing edge excitation of the measurement surface. The partition between the rooms was a double wall with two separate rows of studs offering a high sound insulation. The wall on the receive room side was not connected to the measurement surface. This ensured that intensity measurements of the continuous surface were not contaminated by the partition.
0 10 20 30 40 50 60 70 80 90 100 0 20 40 60 80 100
Percent of Surface Exposed From Excitation Edge
P e rc ent of Tot a l R adiat ed P o w e r 16mm Plywood, Perpendicular to Joists 16mm OSB, Perpendicular to Joists 2x13mm Gypsum Board, Perpendicular to Studs
16mm OSB, Parallel to Joists
2x16mm OSB, Parallel to Joists
Ideal
FIGURE 14: Percent of the total radiated sound power at 500 Hz as a function of the percent of the total surface areas exposed from the excitation edge. At this frequency, the plate and the framing member appear to be “line-connected.”
0 10 20 30 40 50 60 70 80 90 100 0 20 40 60 80 100
Percent of Surface Exposed From Excitation Edge
Percent of Total R adiated Pow e r 16mm OSB, Perpendicular to Joists 16mm Plywood, Perpendicular to Joists 2x13mm Gypsum Board, Perpendicular to Studs 2x16mm OSB, Parallel to Joists
16mm OSB, Parallel to Joists Ideal
FIGURE 15. Percent of the total radiated sound power at 2000 Hz as a function of the percent of the total surface areas exposed from the excitation edge. At this frequency, the plate and the framing member appear to be a series of discrete points.
REFERENCES
1 “Building Acoustics--Estimation of acoustic performance of buildings from the performance of products-Part I: Airborne sound insulation between rooms,” European Standard EN 12354-1, (1996).
2 “Building Acoustics--Estimation of acoustic performance of buildings from the performance of products-Part II: Impact sound insulation between rooms,” European Standard EN 12354-2, (1996).
3 Larsson, D., “Using modal analysis for estimation of anisotropic material constants,” Journal of Engineering Mechanics, Vol. 123, pp. 222-229, (1997).
4 Craik, R.J.M., Smith., R.S., “Sound transmission through lightweight parallel plates. Part II: Structure-borne sound,” Submitted to Applied Acoustics, (1999).
5 Bosmans, Ivan, Nightingale, T.R.T., “Structure-Borne Sound Transmission in Rib Stiffened Plate Structures Typical Of Wood Frame Buildings,” submitted to Journal of Building Acoustics, Special Issue ASA-EAA-DEGA Berlin 99.
6 Steel, J.A., Craik, R.J.M., Wilson, R., “A study of vibration transmission in a framed building,” Building Acoustics, Vol. 1, pp. 49-64, (1994).
7 Langley, R.S., “An elastic wave technique for the free vibration analysis of plate assemblies,” Journal of Sound and Vibration, Vol. 145, pp. 261-277, (1991).
8 Langley, R.S., “On the forced response of structures,” Journal of Sound and Vibration, Vol. 178, pp. 411-428, (1994).
9 Langley, R.S., “On the modal density and energy flow characteristics of periodic structures,” Journal of Sound and Vibration, Vol. 172, pp. 491-511, (1994).
10 Pierre, C., Dowel, E.H., “Localization of vibrations by structural irregularity,” Journal of Sound and Vibration, Vol. 114, pp. 549-564, (1987).
11 Chui, Y.H., “Simultaneous evaluation of bending and shear moduli of wood and the influence of knots on these parameters,” Wood Science and Technology, Vol. 25, pp. 125-134, (1991). 12 Mead, D.J., S. Markus, “Coupled flexural-longitudinal wave motion in a periodic beam,” Journal of Sound and Vibration, Vol. 90, pp. 1-24, (1983).
13 Keane, A.J., Price, W.G., “Statistical Analysis of Periodic Structures,” Proceedings of the Royal Society of London, A423, pp. 331-360, (1989).
14 TSO, Y.K., Hansen, C.H., “The transmission of vibration through a coupled periodic structure,” Journal of Sound and Vibration, Vol. 215, pp. 63-79, (1998).
15 Mead, D.J., S. Markus,”Coupled flexural-longitudinal wave motion in a periodic beam,” Journal of Sound and Vibration, Vol. 90, pp. 1-24, (1983).
16 Craik, R.J.M. , “The measurement of structure-borne sound transmission using impulsive sources,” Applied Acoustics, Vol. 15, pp. 355-361, 1982.
17 Craik, R.J.M., “Sound Transmission through Buildings using Statistical Energy Analysis,” Gower, Aldershot, Hampshire, UK,1996.