Publisher’s version / Version de l'éditeur:
Vous avez des questions? Nous pouvons vous aider. Pour communiquer directement avec un auteur, consultez la
première page de la revue dans laquelle son article a été publié afin de trouver ses coordonnées. Si vous n’arrivez pas à les repérer, communiquez avec nous à [email protected].
Questions? Contact the NRC Publications Archive team at
[email protected]. If you wish to email the authors directly, please see the first page of the publication for their contact information.
https://publications-cnrc.canada.ca/fra/droits
L’accès à ce site Web et l’utilisation de son contenu sont assujettis aux conditions présentées dans le site LISEZ CES CONDITIONS ATTENTIVEMENT AVANT D’UTILISER CE SITE WEB.
Knowledge Based Information Retrieval and Filtering from Internet, pp. 251-268,
2003-01-01
READ THESE TERMS AND CONDITIONS CAREFULLY BEFORE USING THIS WEBSITE.
https://nrc-publications.canada.ca/eng/copyright
NRC Publications Archive Record / Notice des Archives des publications du CNRC :
https://nrc-publications.canada.ca/eng/view/object/?id=0afc1f9f-ae7e-40e5-abb7-41c7e9b66993 https://publications-cnrc.canada.ca/fra/voir/objet/?id=0afc1f9f-ae7e-40e5-abb7-41c7e9b66993
Archives des publications du CNRC
Access and use of this website and the material on it are subject to the Terms and Conditions set forth at
The Virtual Boutique: multimedia retrieval and data mining for
e-commerce and e-business in the framework of a virtual environment
COMMERCE AND E-BUSINESS IN THE
FRAMEWORK OF A VIRTUAL ENVIRONMENT
Eric Paquet and Herna Viktor
NRC and University of Ottawa
Abstract: This chapter presents an approach for multimedia information retrieval employing an image-based algorithm. The Virtual Boutique is a novel, content-based system for multimedia information retrieval, based on virtual reality and visual information management. It supports realistic and fast rendering, extensive manipulation, reconfiguration and multimedia searching capabilities. The Virtual Boutique includes algorithms for searching through the inventory of an e-business, utilizing both images and three-dimensional objects. The chapter shows the application of The Virtual Boutique to an online boutique. In addition, it is illustrated how data mining can be used to determine patterns in consumer-interaction
Key words: content-based, data mining, e-business, e-commerce, e-store, multimedia, retrieval, three-dimensional, virtual environments, 3D
1.
INTRODUCTION
New applications in e-business now require the development of systems combining the strengths of advanced information retrieval technique with multimedia. Such systems offer integrated tools for modelling, visualizing, accessing and retrieving the objects contained in large, online multimedia data repositories.
The use of multimedia information retrieval and its related technologies are relatively new in e-business. Currently, most e-commerce sites rely primarily on text and images, which are sometimes augmented with the use of broadcast video [1]. A number of research groups are current investigating the use of bi-dimensional and three-dimensional objects and visualization for e-commerce sites. However, these have not been successful from a commercial point of view. This is mainly due to the close relationship that exists between e-business and the advertising industry, which historically mainly relies on text and images. Here, images and videos can be created and manipulated very efficiently since the corresponding sensors and software both are mature technologies. By comparison, the use of three-dimensional modelling and visualisation are mainly perceived as a stronghold of specialists. That is, up to recently, these technologies were mainly used in scientific visualization, medical visualization and in computer-aided design (CAD) [2].
However, there are a number of factors, which increased the widespread utilization of this technology. Firstly, the use of special effects in the movie industry led to the creation of powerful systems capable of modelling, designing, implementing and virtualisation in three dimensions. Secondly, the use of three-dimensions in the games industry led to the creation of a group of personal computer users which find three-dimensional intuitive and natural. It is these users who prefer to shop on-line in a three-dimensional, intuitive boutique.
This chapter is organized as follows. In Section 2, we discuss appropriate standards for Web-based three-dimensional technology and shows how three-dimensional objects can be acquired through scanning. In Section 3, we discuss a morphological approach to describing bidimensional images. Section 4 portrays a system to automatically describe the shape of three-dimensional objects. This is followed, Section 5, by a description of the current implementation of the retrieval system. Section 6 describes The Virtual Boutique and shows how it is applied to an online boutique. In Section 7, we investigate the use of data mining to complement the current implementation of The Virtual Boutique. Section 8 concludes the chapter.
2.
MOVING TO THE WEB: DEFINING STANDARDS
AND OBTAINING THREE-DIMENSIONAL
OBJECTS
The creation of a multimedia standard that aims to provide a framework to ensure realistic rendering of three-dimensional objects is of critical importance in e-business. Users, especially those who are familiar with games and special effects in movies, expect high quality rendering. This section discusses the evolution of standards for three-dimensional information exchange over the Web and presents techniques to capture high quality three-dimensional objects.
When exchanging three-dimensional data via the Web, a common file format has to be defined. To this end, the VRML Consortium created the virtual reality modelling language (or VRML) together with the concept of a freely available VRML browser. In essence, VRML is a file format describing three-dimensional environment. In many aspects, VRML was ahead of its time and has been successfully used in numerous research prototypes [3]. However, this standard did and still suffers from a major drawback, namely the file size and inefficient ASCII format. That is, the lengthy download time remains unacceptable for most users and applications. The Consortium addressed this problem by subsequently developing a binary format, which was, due to numerous practical problems, never adopted. Recently, however, the Consortium, after being re-named as the Web3D Consortium, released a new format called X3D [3].
X3D is very similar to XML and contains the following functionality. Firstly, it defines the well-known, basic geometrical elements. Secondly, it supports the definition of new elements. Lastly, it allows the definition of a grammar that governs their mutual relationships. Consequently, X3D can be utilised for defining new three-dimensional formats.
Another attempt that has been made involves the creation of an international multimedia standard MPEG-4 [4]. This standard would be able to handle all kinds of media including three-dimensional objects. MPEG-4 provides a binary format called BIFF that integrates sound, image, video and three-dimensional objects. In this way, it is possible to synchronise objects and to make them interact with one another. From the three-dimensional point of view, the structure of MPEG-4 is very similar to the one of VRML. MPEG-4 can also support face and body animation, a characteristic very useful for avatars and virtual mannequins. This standard is now being using in industry. An interesting application is HotMedia™ from IBM™. It
remains to be seen whether MPEG-4 will become the standard for Web- based three-dimensional objects.
The following observation is noteworthy. Care must be taken to ensure that, when providing the customer with a virtualised object, it appears to be realistic. Customer will not be tempted to buy an object if it appears “toy-like” or “plastic”. This is mainly due to the fact that most three-dimensional objects are created using a model created by a computer. These models are usually quite limited in terms of the colour and texture of the objects, which are rendered. This problem can be easily overcome by scanning the real object in three-dimensions, as discussed next.
Different techniques are available for scanning, including the following three methods. When using a laser scanner [5], the object is scanned (with a laser) and the third dimension is obtained from the position of the reflected beam on a sensor by triangulation. When using a stereo vision system, a second sensor replaces the laser. The third dimension is obtained from the positions of corresponding points on the two sensors. Thirdly, the time of flight system measures the time taken by a laser pulse to make a round trip between the sensor and the object. Because of the high speed of light, modulation techniques are used to measure indirectly the duration of the motion.
Alternatively, the virtual objects are created by simply mapping real pictures or textures on the three-dimensional geometry. Photogrammetry [6] reconstructs three-dimensional objects and scenes from a set of pictures. The user specifies common points between two pictures and the system calculates the three-dimensional co-ordinates by using bundle adjustment. It is very convenient because the only hardware needed is a standard digital camera. Some systems are more adapted for large objects and scenes while some offer more precision: the right choice depends on the application. This section discussed standard for using multimedia over the Web. This was followed by an overview of approaches to create realistic virtual representations. The next section overview an approach for describing bidimensional images using a morphological approach.
3.
DESCRIBING BIDIMENSIONAL IMAGES
The widespread use of images on the Internet, and in particular in e-business, comes as no surprise. A picture is easy to obtain and to transfer over the Web, especially since the use of digital cameras has become commonplace. Also, a picture conveys its message across language boundaries; making it very attractive in the global e-business marketplace.
Figure 13-1. The hue-saturation-value or HSV colour representation.
This section portrays an algorithm used to describe or index bidimensional images for use in our multimedia retrieval system.
The algorithm presented here is inspired by [7-9] and is based on a morphological approach, thus considering the form and structure of images. In this approach, the chromatic distribution of each image is described with the hue-saturation-value representation (HSV). The HSV scheme, which refers to a cylindrical transformation of the red-green-blue (RGB) representation, is similar to the one adopted by painters for their palette. It thus reproduces many characteristics of the human visual system. The hue represents the tint e.g. red, green or blue. The saturation represents its intensity e.g. light red or deep red. The value is related to the amount of light in the scene. The HSV representation is shown in Figure 13-1.
Figure 13-2. The morphological approach: the hue and the saturation of the image are scanned randomly with a structuring element.
The bidimensional image descriptor is computed as follows. Firstly, points are randomly sampled on the image. For this purpose, a quasi-random sequence is used. For each sampled point, a structuring element is applied on the image. The shape of the structuring element depends on the particular application, but a rectangular element is perfectly adapted to most situations. Such a structuring element is shown in Figure 13-2.
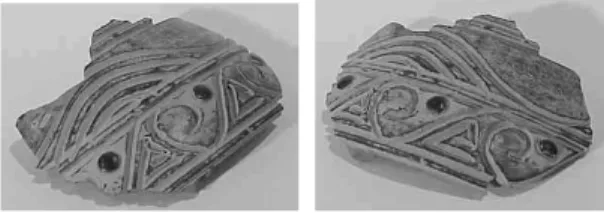
Figure 13-3. Query for similar pieces in a broken vase database. All pictures were taken under the same background and lighting conditions. Only two results are illustrated here. The structuring element is used to compute the local colour distribution. The distribution within the structuring element is represented by a bidimensional histogram. The first dimension represents the hue or the saturation quantified on a limited number of bins. Because of its variability, the value is not used in the image description. The second dimension represents the proportion of the colours relative to the others within the structuring element. For each position of the structuring element, the bidimensional histogram is computed and summing up the values obtained at the preceding iteration accumulates the quantities. From this process, a compact representation of the colour distribution is obtained.
Experience has shown this technique to be very efficient [10-11]. For example, Figure 13-3 shows the retrieval of vase pieces from a broken vase database containing about 400 pieces. All pictures were taken with a uniform contrasting background. Under that condition, our picture retrieval system can be applied to bidimensional shape retrieval if the objects under consideration can be characterized by their contour. In Figure 13-3, both contour and colour information are used in order to describe the object. This section introduced a morphological approach to describe bidimensional images. Experience shows that this approach is successful to provide an information rich description of the images. The next section discusses a technique to describe the shape of a three-dimensional object.
4.
SHAPE DESCRIPTION FOR
THREE-DIMENSIONAL OBJECTS
The National Research Council (NRC) of Canada has developed a system that automatically describes the shape of a large set of three-dimensional objects [10-11]. In this approach, the information about each object is written in a descriptor, which thus presents an abstract representation of the shape of the object. We include a brief description of the general idea [10-11].
The descriptor is computed as follow. Firstly, a scale, translation, rotation and reflection invariant reference frame is calculated from the principal axis of the tensor of inertia. The principal axes correspond to the Eigen vectors of the tensor of inertia. Assuming a triangular mesh representation for the object, the later is defined as
[ ]
=[
(
−) (
−)
]
=∑
= n i CM i CM i qr S q q r r n I I i 1 1 (1) Where Si is the surface of a triangular face, CM is the centre of mass of theobject and q and r are the co-ordinates x, y and z. The principal axes correspond to the Eigen vectors of the tensor of inertia and are obtained from the Eigen equation:
[
Iai =λiai]
i=1,2,3 (2) It can be shown that the normalised principal axes are translation, scale and rotation invariant. By applying a suitable transformation to them, the reflection invariance can be obtained. More details about this transformation can be found in [10]. The axes of the reference frame are identified by their corresponding Eigen values.The three-dimensional shape descriptor is based on the concept of a cord. A cord is defined as a vector that goes from the centre of mass of the model to the centre of mass of a given triangle. It is thus assumed that a triangular mesh represents the surface of the object. Note that the cord is not a unit vector since it has a length. As opposed to a normal, a cord can be considered as a regional characteristic. If the pyramid and the step pyramid are taken as an example, it can be seen that the cord orientation changes
slowly on a given region, while the normal orientation can have important variations.
The distribution of the cords is represented by three histograms. The first histogram represents the angular distribution between the cords and the first Eigen vector. The second histogram represents the angular distribution between the cords and the second Eigen vector. The distribution of the radii is represented by a third histogram. This histogram is scale-dependent, but it can be made scale-independent by normalising the scale. The normalization operation can be performed based either on the maximum radius or on the average radius. Note that all descriptors must have an identical normalization in order to be comparable.
Each histogram is quantified over a certain number of bins. The histograms are normalised by the highest amplitude and each channel is quantified on one byte. A weight is associated to each cord. This weight corresponds to the area of the surface of the triangle to which the cord is attached. The weighting operation insures that the descriptors are, up to a certain point, tessellation invariant by taking into account the relative geometrical importance of each triangle. That means that the descriptors do not depend on a particular representation or tessellation of the object.
A descriptor based on the DAU4 wavelet transform is also proposed. The NxN matrix corresponding to that transform is:
− − − − − − − − = 2 3 0 1 1 0 3 2 0 1 2 3 3 2 1 0 0 1 2 3 3 2 1 0 0 1 2 3 3 2 1 0 c c c c c c c c c c c c c c c c c c c c c c c c c c c c c c c c W O (3) The wavelet coefficients are obtained by applying the matrix W on the reference frame defined by the tensor of inertia. This choice is dictated by the fact that the wavelet transform is not translation and rotation invariant. In order to apply the transform to an object, the latter has to be binarized. The wavelet coefficients represent a tremendous amount of information. In order to reduce it, for each level of resolution of the transform a set of statistical moments is computed. For each moment, a histogram of the distribution of the moment is built. The channels correspond to the level of
detail and the amplitude to the normalized moments. This histogram is the descriptor of the object.
The above-mentioned descriptor is very compact with a size of 120 bytes. Note that the size of the descriptor is totally independent on the size of the original three-dimensional file. That is, a file can represent an object, a part, a person or a scene.
Many other descriptors and indexation techniques have been proposed for three-dimensional models. These include silhouettes, Bayesian indexing, point signature and modal analysis. A discussion of these techniques falls beyond the scope of this chapter. Interested readers are referred to [12-17]. The following observation is noteworthy. Three-dimensional retrieval is mainly shape-based while bidimensional retrieval is context-based. In other words, the first one is metric-based while the later is appearance-based. However, both paradigms are powerful retrieval tools in an e-commerce environment. The next section discusses the implementation of the retrieval system for both images and three-dimensional objects.
5.
IMPLEMENTATION OF INFORMATION
RETRIEVAL SYSTEM
This section describes the implementation of the retrieval system, utilizing the image and shape descriptions as defined in Sections 3 and 4. The system is composed of three parts, namely the crawler, the analyser and the search engine.
The task of the crawler, which is also called spider or Web robot, is to periodically collect all the relevant bidimensional or three-dimensional files from a specified location. These files can be located on a disc, on a local network, an Intranet or over the Internet. The files located on the Internet are accessed through user specification of the domains and the URLs. While crawling over the Internet, the crawler uses the hyperlinks to gradually cover the portion of the Web that has been devoted to it and identifies the files of interest by their file extensions e.g. *.wrl for VRML files. That is, the crawler “spins a web” over the subset of the Internet it covers.
The second part of the system is the analyser, which uses as input the results as obtained from the crawler. The analyser examines the objects, as contained in the input files, and converts it to the description as discussed in Section 3.
The analyser proceeds as follows. First, it reads each file, as obtained by the crawler, and parses the dimensional information. All this information is subsequently mapped to an internal representation, i.e. the analyser acts as a translator.
- For three-dimensional objects, this information includes the vertices and colour, and other shape descriptions. If the object is not modelled as a triangular mesh, the surface is tessellated with a callback function. The tessellation is performed automatically for elementary surfaces, non-uniform rational beta splines – NURBS and polygonal meshes. Once the geometrical information is extracted, the descriptors are calculated and saved in a compressed representation. In addition, a thumbnail is also generated. This thumbnail is used as an abstract or compact representation for the three-dimensional object. It can be easily manipulated and carried over the network.
- For images, the dimensional information is used to create a descriptor in the form of a bidimensional histogram, as discussed in Section 3.
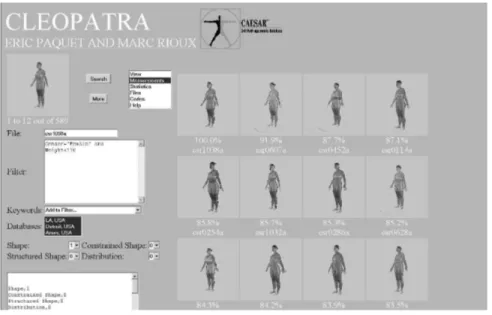
When all the descriptors have been computed, a specially designed and optimised object oriented database is created. For example, consider the CAESAR™ anthropometric database, as depicted in Figure 13-4. This database contains the descriptors of thousands of individuals scanned in three-dimensions, together with statistical and anthropometric data [18-19].
Figure 13-4. Query for a body in the CAESAR™ anthropometric database base on three-dimensional shape and weight.
The last part of the system is the search engine. The search engine provides the graphical interface to the user. It also implements the business logic between the interface and the OO database. Currently, the search engine is designed as a three tiers system. It consists of the client, the search engine logic and the database. In the research presented in here, the client is The Virtual Boutique as described in Section 6. The second tier is a Java Servlet or an Enterprise Java Beans or EJB. This models the business logic and the interface between the business logic and the data. The third tier is the three-dimensional database.
Figure 13-4 shows the interface for a query to find similar bodies in the CAESAR™ anthropometric database with NRC’s Cleopatra Search Engine. Here, the input to the query is a three-dimensional representation of an individual, referred to as an archetype, which appears on the left of the screen. That is, a query uses the query by example paradigm. The query returns images of individuals with similar shape, appearing on the right hand side of the screen. The outcome is subsequently filtered with statistical and anthropometric filters. For example, a filter may include a person’s gender, income and/or age. The interface provides the filters and provides the user with options to select sub-databases. This interface provides us with an intuitive, natural tool for three-dimensional querying.
The strength of this approach is its extensibility and simplicity. Experience shows that the number of objects can easily reach more than 100.000 without compromising the system performances [11]. Also, the system can collect three-dimensional objects from a file system or from the Internet. It can be deployed on our dedicated object oriented database or on a commercial object-relational database such as Oracle8i™. The search engine is able to run as a stand-alone application or on an application server. In the later case, the search engine can be accessed from anywhere over the Internet.
This section described the three-part system used for acquiring and retrieving three-dimensional images. The next section introduces The Virtual Boutique, which incorporates both three-dimensional objects and images.
6.
THE VIRTUAL BOUTIQUE: VIRTUAL REALITY
FOR E-BUSINESS
Recall that The Virtual Boutique implements the client of the search engine and is used by the online users to query the underlying database of an e-business site.
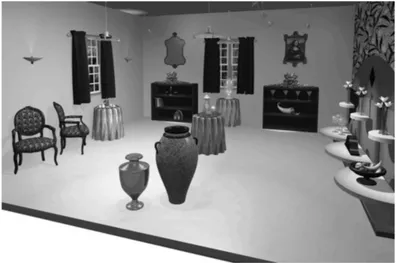
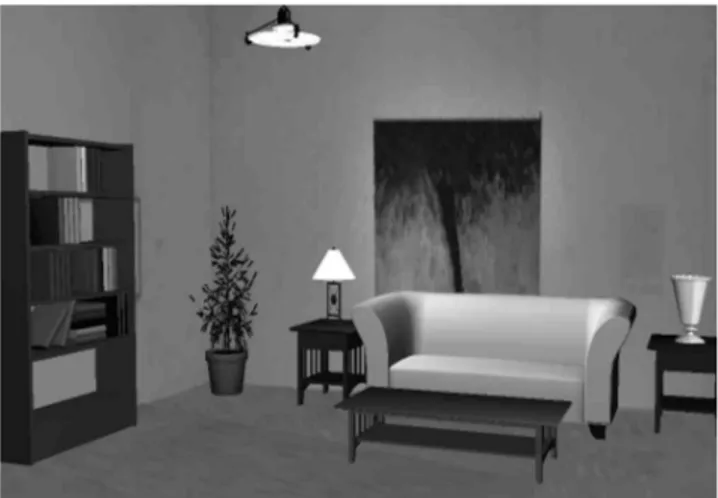
What is The Virtual Boutique? The Virtual Boutique is an online e-commerce store, which contains both images and three-dimensional objects, scanned into an environment consisting of a number of virtual rooms. This discussion will focus on the furniture department of the e-store, as depicted in Figure 13-5. The figure shows a global view of the furniture department, which includes a number of vases, tables, chairs and wall fixtures, amongst others. Here, we use images and three-dimensional objects to provide the consumer with a virtualised representation of the object.
The scenes, which are included in The Virtual Boutique, were created as follows. Initially, digital pictures of the scene (or boutique) were acquired. These pictures were taken using the same lighting conditions and the camera was using an object of known dimensions for calibration. Next, a three-dimensional representation of the scene was constructed using photogrammetry, as introduced in Section 2. A number of rules apply while taking the pictures, including the following. Firstly, there must be an overlapping between the pictures and each picture must be taken from a distinct viewpoint. It follows that, the further the distance between the viewpoints, the better the quality of the reconstruction. The density of the sampling depends on the complexity of the scene. While a few pictures are enough for a simple scene, many pictures may be required for a complicated scene. Figure 13-6 shows a room created using the above-mentioned process. This scene depicts a scene from the furniture store of an e-store. The room has been virtualised with photogrammetric techniques using only two digital pictures.
Figure 13-5. Global view of the furniture department of The Virtual Boutique
The design of The Virtual Boutique is based on the observation that, in essence, shopping is an unstructured, unorganised process. In a real store, the
consumers move, discuss, touch and compare before purchasing. Many times, the consumer brings along a picture of an item he wishes to find, either physical or mentally. For example, a consumer shopping for a vase may bring along a clipping of a vase, which he previously saw in an interior design magazine. That is, he brings along an example and asks the vendor for a similar item. If the choice becomes too difficult, the consumer may put the various similar items next to one another to ease his choice. For example, the consumer shopping for a vase may place five different vases next to one another on the counter. This situation reflects that, for many people, choosing an item relative to others is easier than on an absolute basis. The first paradigm involves interclass comparison, while the second paradigm enables intraclass comparison through relative visualisation. This is the most common paradigm in real shopping environment.
In The Virtual Boutique, the two above-mentioned paradigms of “comparison-based shopping” and “query by archetype” are implemented as follows. That is, a search within the Virtual Boutique is performed in two different ways. In the first approach, the descriptors for images or three-dimensional objects, as described earlier, are used to obtain similar items. In the second approach, the search is performed by using a lookup table of predefined classifications. Here, the outcome of the search is displayed by either replacing the reference object with the closest match or through a global reconfiguration of the boutique. Note that every object in the boutique can be manipulated, aiding the consumer to co-ordinate different objects, both from the appearance and spatial point of view.
Figure 13-6. The Virtual Boutique. The room has been virtualised with photogrammetric techniques. The objects have been generated with computer graphic techniques.
In the first case, a sequential shopping paradigm is used. The results are displayed in a sequential manner. The consumer selects an object and asks for similar or related objects. The boutique determines the closest match, using the method as described in Section 5. The system displays the result by replacing the original object in the scene. All subsequent results are displayed in the same manner. At the end of the process, the initial object is put back in place. This paradigm is very useful if the consumer tries to co-ordinates many objects together. For example, assume that a consumer wishes to buy a table and two chairs for his living room. Here, the main problem is to co-ordinate the three pieces of furniture in a meaningful way. By applying this paradigm to many objects, the consumer can evaluate different combinations and determine which one is the most appropriated for him.
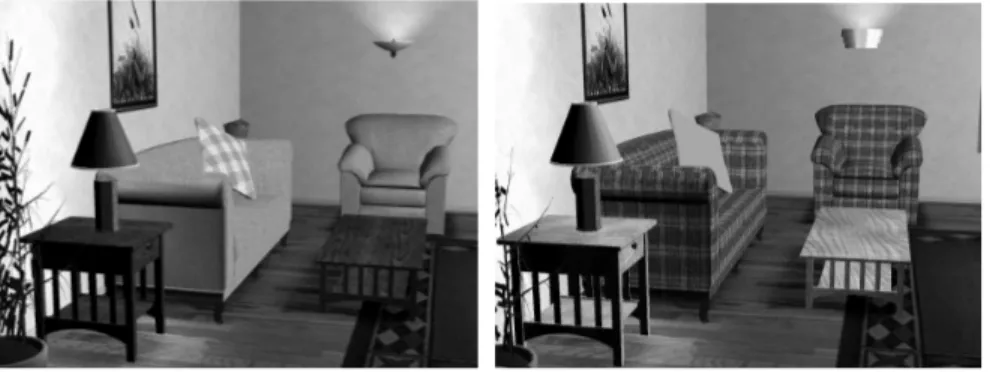
In the second case, the consumer is allowed to reconfigure the whole scene using the outcome of a search, as depicted in Figure 13-7. Here, the consumer selects all the items of interest. It is subsequently displayed in the boutique. In this way, the consumer is creating a new composition of items, which may lead to him purchasing additional items (or even alternative) that originally planned. For example, consider the above-mentioned consumer who intended purchasing two chairs and a table. Through the reconfiguration of the scene, the consumer might decide to purchase a sofa, one chair, a table as well as a vase. Also, through virtualisation, this may lead to the consumer deciding to repaint his living room, leading to a purchase in the hardware department of our store. This scenario is also useful in environments where the shopper is a returning customer, who has previously purchased a combination of some items.
Figure 13-7. Reconfiguration of the Virtual Boutique. The left view shows the original boutique and the right view shows the same boutique where the sofas and the tables have been substituted by making a query to the three-dimensional shape search engine.
Note that the consumer can seamlessly switch between the two paradigms. Furthermore the boutique is divided in departments and the consumer can
select a department according to his interests, i.e. furniture, hardware, electronic, etc. The user can select any item and cycle through them. Navigation within The Virtual Boutique is controlled through using the mouse and the keyboard [20]. The direction of the navigation and the inclination of the head are controlled by the mouse while the keyboard controls the displacements. The displacements include acceleration when the customer starts to move and deceleration when he becomes immobile. The collisions with the wall are elastic and reproduce the effect of a normal collision between a rigid wall and a human body. The lighting is designed in order to favour the visualisation and to create the required atmosphere. A detailed discussion of the implementation issues of The Virtual Boutique falls beyond the scope of this chapter. Interested readers are referred to [21] for a discussion of the issues regarding compression, portability and performance related issues.
This section introduced The Virtual Boutique and showed its applicability for virtualising the rooms of the furniture department of an e-store. The next section discusses the use of the Virtual Boutique for data mining.
7.
VIRTUAL-REALITY AND DATA MINING:
FUTURE RESEARCH DIRECTIONS
Data mining [22-26] is defined as the process of extracting non-trivial, previously unknown and potentially useful patterns from large data repositories. Data mining techniques includes classification and prediction, association rule mining and cluster analysis. In particular, the analysis of clickstreams, as contained in so-called e-webhouses, to determine consumer behaviour is currently an important topic in data mining [27].
This section presents our current ideas regarding the use of data mining to better understand the behaviour of consumers in The Virtual Boutique. The results of such an analysis can be used to target potential consumers, order the objects in the rooms, streamline the order of the rooms in The Virtual Boutique, determine trends in purchase behaviour, to create profiles of our consumers, amongst others [28-30].
The data obtained through the Virtual Boutique can be used to extract general business rules and information regarding consumer behaviour from the interaction of consumers with the boutique, as illustrated in the following examples. Clickstream analysis can be used to distinguish between customers who purchase items, versus those who do not. Data mining may determine that a typical consumer will return to the same object (e.g. a vase)
six to eight times before purchasing it. On the other hand, a consumer who returns to a particular object more than ten times will typically abort the transaction. This type of consumer behaviour indicates that the second type of consumer does find the object attractive, but that one of the characteristics (e.g. the colour) is not ideal. Through pro-active marketing, a message should be displayed which for example suggest another similar item in a different colour.
Data mining can also be used to determine the walk-though behaviour of customers. If trends show that a particular room is unpopular, it should either be removed from the walk through or re-decorated. Similarly, the stock items in the boutique, which are only briefly visited and rarely purchased, should be removed from the inventory. Data mining can thus also be used to determine seasonal trends and shifts in fashion, for example in colour schemes and shapes.
In addition, from the navigation and the interaction of the consumer with the boutique it is possible to deduce if the disposition of the object is adequate and if the objects can be easily manipulated. It is also possible to determine the amount of time the consumer spends on each item and the combination and disposition of items favoured by the consumer. If a transaction does not lead to a sale, it is possible to analyse the whole process instant by instant in order to determine what went wrong.
CONCLUSIONS
Current advances in the games and movie industries have led to a new breed of consumers with a preference for e-business sites which includes images and three-dimensional objects, virtualisation and innovative information retrieval methods. The combination of intuitive information retrieval, realistic rendering of images and three-dimensional objects into a virtual environment is therefore a sine qua non condition for the further development of e-commerce and e-business. This chapter discussed The Virtual Boutique, which combines realistic rendering, multimedia integration, efficient and intuitive navigation and content-based searching capability into a single virtual environment.
The introductions of virtual reality-based environments for e-commerce enable the collection of a huge amount of data concerning consumers’ habits. It is the opinion of the authors that the analysis, through data mining, of such so-called e- webhouses should lead to a better understanding of the behaviour patterns of e-business consumers.
ACKNOWLEDGEMENT
This chapter is based on prior work as reported in [20-21].
REFERENCES
1. V. C. Storey et al., “A Conceptual Investigation of the E-commerce Industry”, Communications of the ACM 43, pp. 117-123 (2000).
2. E. Paquet and M. Rioux, "A Content-based Search Engine for CAD and VRML Databases", Dedicated Conference on Robotics, Motion and Machine Vision in the Automotive Industries, Proc. ISATA 31, 427-434, Dusseldorf, Germany (1998).
3. Web3D Consortium: http://www.web3d.com 4. MPEG-4: http://mpeg.telecomitalialab.com
5. J.-A. Beraldin et al, “3D Digital Imaging and Modeling”, Proceedings Second International Conference on 3D Digital Imaging and Modeling, pp. 34-43, Ottawa, Canada (1999).
6. S .F. El-Hakim, “A Practical Approach to Creating Precise and Detailed 3D Models from Single and Multiple Views.” International Archives of Photogrammetry and Remote Sensing, Volume 33, Part B5A, Commission V, pp. 122-129, Amsterdam, July 16-23 (2000).
7. P. van Beek et al., “Scalable Blob Histogram Descriptor”, ISO/IEC JTC1/SC29/WG11 – MPEG-7 Proposal ID 430, Lancaster, England (1999).
8. T. Gevers and A. W. M. Smeulders, “Image Indexing using Composite Colour and Shape Invariant Features”, ICCV, pp.576-581 (1998).
9. M. Flickner et al., “Query by Image and Video Content,” IEEE Computer, pp.23-32 (1995).
10. E. Paquet and M. Rioux, "The MPEG-7 Standard and the Content-based Management of Three-dimensional Data: A Case Study", IEEE International Conference on Multimedia Computing and Systems, June 7-11, Florence, Italy, pp. 375-380 (1999).
11. E. Paquet et al., “Description of Shape Information for 2-D and 3-D Objects”, Signal Processing Image Communication 16, pp. 103-122 (2000).
12. Y. Liu and F. Dellaert, “A Classification Based Similarity Metric for 3D Image Retrieval”, CVPR, pp. 800-805 (1998).
13. Y. Gdalyahu and D. Weinshall, “Automatic Hierarchical Classification of Silhouettes 3D Objects”, CVPR, pp. 787-793 (1998).
14. J. H. Yi and D. M. Chelberg, “Model-Based 3D Object Recognition Using Bayesian Indexing”, Computer Vision and Image Understanding 69, pp. 87-105 (1998).
15. C. S. Chua and R Jarvis, “Point Signature: A New Representation for 3D Object Recognition”, International Journal of Computer Vision 25, pp. 63-85 (1997).
16. F. Dell’Acqua and P. Gamba, “Simplified Modal Analysis and Search for Reliable Shape Retrieval,” IEEE Trans. CSVT 8(5), pp. 656-666 (1998).
17. C. Dorai and A. K. Jain, “Shape Spectrum based View Grouping and Matching of 3-D Free-Form Objects,” IEEE Trans. PAMI 19(10), pp. 1139-1146 (1997).
19.E. Paquet, K. M. Robinette and M. Rioux, “Management of Three-dimensional and Anthropometric Databases: Alexandria and Cleopatra”, Journal of Electronic Imaging, 9, pp. 421-431 (2000).
20. E. Paquet, H. Viktor and S. Peters, “The Virtual Boutique: Virtual Reality and Information Management for E-business”, Invited Speaker, International Conference on Advances in Infrastructure for Electronic Business, Science, and Education on the Internet - SSGRR, Telecom Italia, August 6-12, L'Aquila, Italy, CD (2001).
21. E. Paquet, H. Viktor and S. Peters, “The Virtual Boutique: a Synergic Approach to Virtualization, Content-based Management of 3D Information, 3D Data Mining and Virtual Reality for E-commerce”, 3D Data Processing Visualization and Transmission - 3DPVT02, IEEE Proceedings, June 19-21, Padova, Italy, pp. 268-276 (2002).
22. J. Ham and M. Kamber, “Data mining concepts and techniques”, Morgam Kaufmann, San Francisco, USA (2001).
23. G. G. Grinstein and M. O. Ward (2002). Introduction to data visualization. Information Visualization in Data Mining and Knowledge Discovery, U. Fayyad, G. G. Grinstein and A. Wiese (editors), Academic Press, London: UK, pp.21-26.
24. K. Thearling et al. (2002). Visualizing Data Mining Models, Information Visualization in Data Mining and Knowledge Discovery, U. Fayyad, G. G. Grinstein and A. Wiese (editors), Academic Press, London: UK, pp.205-222.
25. P. E. Hoffman and G. G. Grinstein (2002). A Survey of Visualization for High-Dimensional Data Mining, Information Visualization in Data Mining and Knowledge Discovery, U. Fayyad, G. G. Grinstein and A. Wiese (editors), Academic Press, London: UK, pp.47-82.
26. M. Foster and A. G. Gee, “The Data Visualization Environment, Information Visualization in Data Mining and Knowledge Discovery”, U. Fayyad, G. G. Grinstein and A. Wiese (editors), Academic Press, London: UK, pp.83-94 (2002).
27. A. Biancardi and V. Moccia, “Integrating Applications into Interactive Virtual Environments”, VISUAL’99, pp. 703-710 (1999).
28. E. F. Churchill et al., “Collaborative Virtual Environments”, Berlin: Springer Verlag (2001).
29. Multiple authors, “Special Issue on Large Wall Displays”, IEEE Computer Graphics and Applications, 20 (4), (2000).