Publisher’s version / Version de l'éditeur:
Vous avez des questions? Nous pouvons vous aider. Pour communiquer directement avec un auteur, consultez la première page de la revue dans laquelle son article a été publié afin de trouver ses coordonnées. Si vous n’arrivez pas à les repérer, communiquez avec nous à [email protected]. Questions? Contact the NRC Publications Archive team at
[email protected]. If you wish to email the authors directly, please see the first page of the publication for their contact information.
https://publications-cnrc.canada.ca/fra/droits
L’accès à ce site Web et l’utilisation de son contenu sont assujettis aux conditions présentées dans le site LISEZ CES CONDITIONS ATTENTIVEMENT AVANT D’UTILISER CE SITE WEB.
7th Canadian Marine Hydromechanics and Structures Conference
[Proceedings], 2005
READ THESE TERMS AND CONDITIONS CAREFULLY BEFORE USING THIS WEBSITE. https://nrc-publications.canada.ca/eng/copyright
NRC Publications Archive Record / Notice des Archives des publications du CNRC :
https://nrc-publications.canada.ca/eng/view/object/?id=eaec598c-f0a8-40c8-8cb4-0f4720aa70b0 https://publications-cnrc.canada.ca/fra/voir/objet/?id=eaec598c-f0a8-40c8-8cb4-0f4720aa70b0
NRC Publications Archive
Archives des publications du CNRC
This publication could be one of several versions: author’s original, accepted manuscript or the publisher’s version. / La version de cette publication peut être l’une des suivantes : la version prépublication de l’auteur, la version acceptée du manuscrit ou la version de l’éditeur.
Access and use of this website and the material on it are subject to the Terms and Conditions set forth at
Model podded propeller-ice interaction in extreme conditions using a
probabilistic model
Model Podded Propeller-Ice Interaction in Extreme
Conditions using a Probabilistic Model
Jungyong Wang
1, Ayhan Akinturk
2, Stephen J. Jones
2, and Neil Bose
11Faculty of Engineering and Applied Science, Memorial University of Newfoundland
St. John’s, NL, A1B 3X5, Canada
2Institute for Ocean Technology, National Research Council Canada
St. John’s, NL, A1B 3T5, Canada
Email: [email protected]
A
BSTRACTExtreme ice loads acting on a model propeller blade during propeller-ice interactions are studied for input to the design and maintenance of ice class propellers. The main focus of this paper is to develop a framework for analyzing ice loads on a propeller blade using probabilistic methods based on experimental results. The Poisson distribution is used for the events of the propeller-ice interactions and the cumulative density function for extreme ice loads is modeled by a double exponential form (Gumbel Type).
Propeller-ice interaction experiments were conducted in the ice tank at the National Research Council of Canada Institute for Ocean Technology (NRC/IOT). A model podded propeller was used for the experiments and ice loads were measured with a six-component dynamometer attached to the root of the propeller blade inside the hub.
Based on the experimental results, extreme values are plotted with an exceedance probability. Some results for the maximum blade thrust, the maximum shaft thrust and the maximum out of plane bending moment are presented in this paper. The modeling of the extreme probability is also described briefly. NOMENCLATURE
D Propeller diameter (m)
DOC Depth of cut (mm)
FX Force in the direction of x-axis F(x) Cumulative density function
FY Force in the direction of y-axis
FZ Force in the direction of z-axis
KT Thrust coefficient ( 2 4 /( ) T ρn D ) Pr Probability T Thrust (N)
n Propeller rotating speed, rps (Revolution Per Second)
VS Carriage velocity (m/s)
αm Milling angle (degree)
γ Total expected number of events
µ Expected number of interactions (hits) ρ Density of water
r Proportion coefficient of hits
1. I
NTRODUCTIONMost of the decisions regarding scantlings for an ice class propeller are made by various classification society rules, the Arctic Shipping Pollution Prevention Regulations (ASPPR) and the Finnish-Swedish Ice Class Rules (Bose et al., 1998). The ice class rules, however, were formulated on the basis of a prescribed ice torque. As the number of vessels capable of navigating in ice-covered seas is increasing, the need for the proper estimation of ice loads is becoming more important. Deterministic extreme ice loads on a propeller play an important role in the choice of the strength of the propeller at the initial design stage and the understanding of the interactions between the propeller and ice during navigation stage.
Generally, full-scale measurements are used for the evaluation of the maximum ice loads. The ice loads from full-scale measurements, however, have a high-level of uncertainties because of the non-uniform ice properties, the randomness of the interactions, uncertainties in the data acquisition systems, and discrepancies among the data analysis methods used. Also sampling rates are usually not high enough to capture the “real” peaks in the data. The cost of
carrying out full-scale measurements for propeller-ice interactions is often prohibitive.
In order to overcome these difficulties, model tests with artificial/refrigerated ice were conducted (Jones et al., 1997; Searle, 1999; Moores et al., 2001; Akinturk et al., 2004; Wang et al., 2004; Wang et al., 2005). Model tests give more precise information in terms of the ice properties, the interaction conditions, and the data collected compared with full-scale measurements.
The objective of this work is to determine the maximum ice loads acting on the propeller blade using the extreme probability method. Model test data were used for the analyses.
The probabilistic analyses for propeller-ice interaction have been studied (Andruishin, 1993; Bose et al., 1998; Browne et al., 1998). Bose et al. (1998) introduced the probability method for determination of the full-scale ice loads during the propeller-ice interactions with two, and three parameter Weibull distributions and Gumbel distribution. The Gumbel distribution was used for structure-ice interactions (Jordaan and Maes, 1991; Maes and Hermans, 1991; Jordaan et al., 1993; Jordaan, 2001). In this paper, the probability method will focus on the Gumbel distribution because it can be applied to more general cases (Jordaan, 2004). The events of propeller-ice interactions assume a Poisson distribution and the extreme loads were simulated using an exceedance probability.
2. M
ODELT
ESTModel tests were conducted at the Institute for Ocean Technology ice tank with a model podded propeller. Wang et al. (2005) shows the test procedure and some of the results in detail.
2.1 Model Propeller
The propeller was designed to be similar to a general icebreaker propeller. It had a diameter of 0.3 m and four blades. Mean-pitch/diameter ratio (P/D) was 0.76 and expanded blade area ratio (EAR) was 0.669. The diameter of the hub at the propeller was 0.11 m.
2.2 Dynamometers
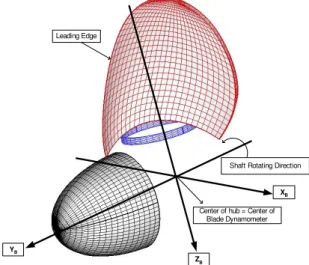
Ice loads acting on the propeller blade were measured by a blade dynamometer that was manufactured by Advanced Mechanical Technology Inc. (AMTI) and capable of measuring forces/moments in six degrees of freedom. It was mounted inside the hub and attached to one of the blades. The sampling rate was 5000 Hz. The transducer can measure forces up to 2224 N in x- and y- directions, up to 4448 N in the z- direction, and moments up to 56.5 Nm about all three
axes. The local coordinate frame for the blade dynamometer is shown in Figure 1.
Two dynamometers of the same type as the blade dynamometer were attached to the shaft bearings. The global dynamometer was on the top of the pod system, and measured the six degrees of freedom forces/moments in three orthogonal directions. Shaft torque was measured by a strain gauge system mounted on the shaft close to the propeller hub. Other measurements, such as carriage velocity, propeller rotating speed, azimuthing angle, and blade angular position were also taken.
Leading Edge
ZB YB
XB
Shaft Rotating Direction
Center of hub = Center of Blade Dynamometer
Figure 1: Axes for the blade dynamometer
2.3 Ice Tank
The tests were conducted in the ice tank at NRC/IOT (Jones, 1987). The useable area of the tank for ice testing is 76 m long, 12 m wide and 3 m deep. In addition, a 15 m long setup area is separated from the ice sheet by a thermal door to allow equipment preparation while the test sheet is prepared (Figure. 2). The range of the carriage velocity is from 0.0002 to 4.0 m/s. The carriage is designed with a central testing area where a test frame, mounted to the carriage frame, allows the experimental setup to move transversely across the entire width of the tank.
2.4 Model Ice
EG/AD/S refrigerated model ice was used in these experiments (Timco, 1986, Spencer and Timco, 1990). The target flexural strength and thickness were 80 kPa and 60 mm, respectively.
2.5 Test Matrix
The tests were carried out at different depths of cut, propeller rotating speeds (RPS), ice conditions, and carriage velocity (Vs) (Table 1). The tractor (also
called puller) mode was used in the present work. In this paper, “Case 1” shows the results when the azimuthing angle is between 180 and 150 degrees. “Case 2” shows the results when the azimuthing angle is less than 150 degrees.
Azimuthing Angle (°) Carriage Velocity RPS Ice Conditions Case1 180, 150 0.2, 0.5, 0.8 5, 7, 10 Pre-sawn, Pack ice Case2 120, 90, 60 0.2, 0.5, 0.8 5, 7, 10 Pre-sawn, Pack ice Table 1: Test matrix for two different depths of cuts
(15 mm and 35 mm DOC)
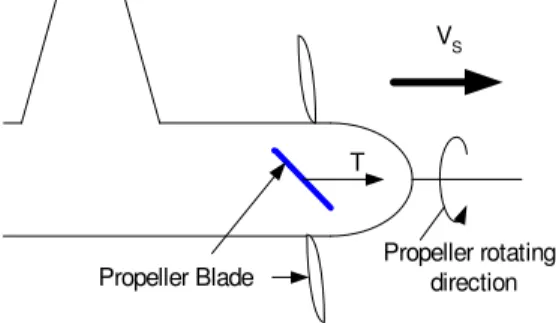
Figure 3 shows the tractor mode with 180 degrees azimuthing angle.
VS
T
Propeller Blade Propeller rotating direction
Figure 3: Tractor mode with 180 degrees azimuthing angle
2.6 Data Analysis
Hydrodynamic loads were subtracted from total loads in the ice condition and only “ice-related” loads were used for the present work (Wang et al., 2005).
Total loads in ice = ice milling loads + “separable” hydrodynamic loads + “inseparable” hydrodynamic loads
“Ice-related” loads = ice milling loads + “inseparable” hydrodynamic loads
Total loads in ice can be obtained from ice tank tests, and “separable” hydrodynamic loads are the results of the open water tests. “Inseparable” hydrodynamic loads include the blockage/ proximity effects or cavitation due to the presence of the ice (Walker, 1994; Bose, 1996).
In the analysis, the depth of cut (DOC) is defined as the maximum depth that was penetrated by the propeller blade into the ice block (Figure 4). αm is
defined as the angle in which ice milling is thought to be occurring.
ICE
Path of Blade Tip Depth of Cut
αm
Figure 4: Depth of cut (DOC)
3. P
ROBABILITY METHODFor extreme probability, there are three classical asymptotic models depending on the parent distribution. These are expressed as follows:
Type 1: F(x)=exp[−exp(−x)]
for −∞<x<∞ , [1] Type 2: F(x)=exp(−x−α) with α>0,
for −∞ < x<∞, [2] Type 3: F(x)=exp[−(−y)α] with α>0,
for− ∞ < x< ∞ . [3] Type 1, 2 and 3 are normally named as Gumbel, Frechet and Weibull distributions, respectively. For the maxima, the Type 1 distribution is the most useful because it is the natural extreme for most parent distributions (Jordaan, 2004).
3.1 Basic Concept
At first, all events are assumed to have independent and identically distributed random quantities. The set of random quantities is, for example,
} ,..., ,... , , {X1 X2 X3 Xi Xn . [4]
The extreme value Z can be defined as
Z = max(X1,X2,X3,...Xi,...,Xn). [5] The cumulative density function, FZ(z) , can be written as ) ( ) Pr( ) (z allX z F z FZ = i≤ = Xn . [6]
3.2 Application to propeller-ice
interaction
Propeller-ice interactions can be explained by the Poisson process because, in an actual scenario, the interactions will not occur continuously. Also, propellers will more often experience ice pieces (pack ice) than level ice. For the extreme probability method, the only interesting region is the tail of the probability distribution and it may follow an exponential or double exponential form (Type 1, Gumbel distribution). In order to use the extreme statistics, the data set was ranked in descending order from order statistics (Castillo, 1988). The Weibull plotting position [i/(n+1)] was used for the exceedance probability and double exponential form was used for the tail distribution. Therefore, the exceedance probability was defined as a double logarithm. In the Weibull plotting, n is the total number of interactions and i is the sequence number. The one percent exceedance probability (for example “100 year” load case if the distribution is based on one year), can be written as
)) ' ln( ln(− Pe − = 4.6. [7] where Pe'=1−Pe, and Pe=0.01.
When a propeller blade contacted ice, the “ice-related” loads were calculated, i.e. the total number of events was the same as the number of the ice contacts. The decision of a contact period was made by using blade angular position (Wang et al., 2005). Although blade angular position is within the target range of αm, a non-contact may occur because of the
shadowing of the blades or the irregularity of the ice feeding. Therefore, the number of interactions (hits) is counted only when the “ice-related” loads are larger than the maximum loads measured in open water tests (no ice case).
The Poisson distribution can be written as
! ) ( ) : ( n e n P n µ µ µ − = , n = 0, 1, 2… [8]
where µ is the expected number of interactions (hits) per unit time for future estimation (µ=rγ , where r is the proportion of hits and γ is the total expected number of events).
For most practical cases, the distribution of the tail can be represented by an exponential or double exponential form (Jordaan et al., 1993), which is
]) [ exp( ) ( 1−FX z = −az+b [9] A new Poisson process of tail for random quantities is: )) ( 1 ( '=µ −FX z µ [10] ! ' ) ' ( ) ' : ' ( ' ' n e n P n µ µ µ − = n’ = 0, 1, 2… [11] If n’ is assumed to be equal to zero for the extreme case, then FZ(z)=exp(−µ')=exp{−µ[1−FX(z)]} =exp{−µ(exp[−(az+b)])} )} ln ] [ exp( exp{− − + + µ = az b . [12]
Jordaan (2004, p. 501) shows the full derivation of equations with detailed explanation.
4. D
ATA RESULTSIn the calculations, the following assumptions are used:
1. All events are independent and identically distributed (iid).
2. Same contacting area: for a given test run, i.e. constant propeller rotational and advance velocities, the area of the blade contacting the ice during milling is assumed to be the same for each rotation of the propeller. Though, this area might vary during a test run.
3. Same pack ice condition: for all the tests in pack ice, the density of the ice distribution on the water surface is assumed to be the same, i.e. 9/10.
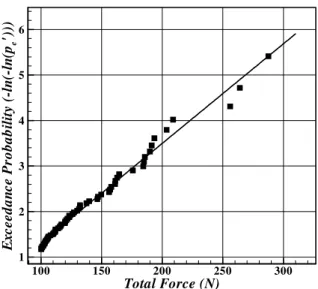
Figure 5 shows the total force distribution in time series; i.e. FX2+FY2 +FZ2 , acting on the propeller blade in pack ice condition.
In order to use the extreme probability method, an appropriate return period must be defined. For simplicity, it will be assumed that the return period is the time it took for the test run under consideration. This will be called a unit time for the sake of argument. For the purpose of illustrating the concept, number of hits will then be projected to a time scale equal to the 100 times of this unit time. This return period, however, can be controlled using a proper interaction scenario.
Figure 6 shows the total force on the blade, presented in Figure 5, against exceedance probability. If the “100 unit times” loads of the total force were considered, the exceedance probability value would be 4.6 from Equation 7. If the exceedance probability is determined, the design loads can be chosen.
Peak Number T o ta l F o rc e (N ) 0 100 200 300 400 500 600 50 100 150 200 250 300
Figure 5: Measured maximum total force values for the assumed ice interaction segments in the time
series for the selected test run
In Figure 7, shaft thrust coefficients are plotted for azimuthing angles of 150 and 180 . If we consider the “100 unit time” loads, the maximum shaft thrusts for 35 mm DOC and 15 mm DOC are 2.7 and 1.57, respectively. When the DOC is increased from 10 percent to the 23 percent of the propeller blade radius, the shaft thrust increased about 58 percent. The thrust coefficient (KT) is defined as
KT =
2 4
/( )
T ρn D ,
where, ρ is the density of water, n is the propeller rotating speed and D is the diameter of the propeller.
Total Force (N) E x c e e d a n c e P ro b a b il it y (-ln (-ln (p e ') )) 100 150 200 250 300 1 2 3 4 5 6
Figure 6: Data in Figure 5 ranked and plotted with exceedance probability (Gumbel plot)
Shaft Thrust Coefficient (KT)
E x c e e d a n c e P ro b a b il it y 1 2 3 0 1 2 3 4 5 6 7 Case 1 (35 mm DOC) Case 1 (15 mm DOC)
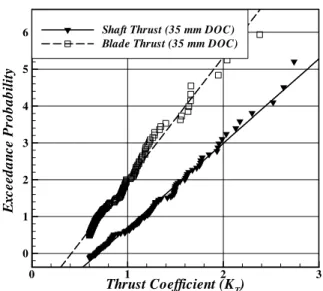
Figure 7: Shaft thrust coefficients with two different depths of cut against exceedance probability Figure 8 shows the relationship between the shaft thrust and four times the blade thrust. Because the number of blades was four, four times blade thrust is assumed to be a good parameter to indicate the total thrust generated by the propeller. It is then compared to shaft thrust. In the case of 15 mm DOC, the four times the blade thrust compared well with the shaft thrust at the same probability (not shown in this paper). For 35 mm DOC, however, the shaft thrust, was much higher than four times the blade thrust values. It might mean that when the propeller blade penetrates deeper into the ice block, the rest of the blades might encounter accelerated broken ice pieces or dynamic ice loads.
Thrust Coefficient (KT) E x c e e d a n c e P ro b a b il it y 0 1 2 3 0 1 2 3 4 5
6 Shaft Thrust (35 mm DOC)
Blade Thrust (35 mm DOC)
Figure 8: Comparison between shaft thrust and four times blade thrust
Out of plane bending moments of the propeller blade are plotted against the exceedance probability for 35 mm DOC in Figure 9. The largest out of plane bending moments can be expected when the azimuthing angle is less than 150° in pre-sawn ice conditions. From the “100 unit time” loads point of view, the maximum out of plane bending moment values for “Case 2” was 2.6 times higher than those of “Case 1”.
Out of plane Bending Moment (Nm)
E x c e e d a n c e P ro b a b il it y 10 20 30 40 50 60 70 1 2 3 4 5 6 7
Case 2 (Presawn Ice) Case 2 (Pack Ice) Case 1 (Presawn Ice) Case 1 (Pack Ice)
Figure 9: Out of plane bending moments with various operating conditions in 35 mm DOC
5. C
ONCLUSION AND REMARKS The experimental test results were analyzed with extreme probability method. The extreme probability method is useful when deciding the ice loads in ice-class propeller design.The thrust coefficient was selected as a case study to illustrate the concept. Of course, the same method can be applied to any other parameter, such as shaft torque, etc.
All the data used in this paper were the maximum ice induced loads that did not include separable hydrodynamic loads. The extreme values for the ice related shaft thrust, blade thrust, and out of plane bending moments were 9, 5.9, and 7.7 times higher than the maximum separable hydrodynamic loads as far as the estimated “100 unit time” loads are concerned. The corresponding maximum separable hydrodynamic loads were measured in clear water (no ice) at the same test conditions, i.e. advance coefficients, azimuthing angle, etc., as the ice tests.
A
CKNOWLEDGEMENTSThis study on podded propellers is a joint project between Transport Canada and the National Research Council of Canada. We would like to thank Dr. Jordaan in Memorial University of Newfoundland for the very stimulating discussions on the probabilistic model. Special thanks are extended to the members of the National Research Council of Canada’s Institute for Ocean Technology for their assistance in various stages of this project.
R
EFERENCES[1]. Akinturk, A., Jones, S., Duffy, D., and Rowell, B., 2004, “Ice Loads on azimuthing podded propulsors”, Proc. 23rd OMAE, ASME, New York (CD-ROM, no page numbers).
[2]. Andruishin, A.V., 1993, “A probabilistic/Statistic Method for predicting Maximum Possible Ice Load Levels in the Propeller-Shafting System of Ice-Breaking Ships”, 12th International Conference on Port and Ocean Engineering under Arctic Conditions, Hamburg, Vol. 2, pp. 763-773.
[3]. Bose, N., 1996, “Ice Blocked Propeller Perfor-mance Prediction Using a Panel Method”, Transactions of the Royal Institution of Naval Architects, Vol. 138.
[4]. Bose, N., Veitch, B., and Doucet, J., 1998, “A Design Approach for Ice Class Propellers”, Transactions of the Society of Naval Architects and Marine Engineers, Vol. 106, pp.185-211. [5]. Browne, R.P., Revill, C.R., Ritch, A.R., and
Keinonen, A.J., 1998, “Propeller Design Load Model”, Institute for Ocean Technology, National Research Council of Canada, Report No. TP 13243E.
[6]. Castillo, E., 1988, Extreme Value Theory in Eng-ineering, Academic Press Inc., Harcourt Brace Jovanovich Publishers, Boston, 389 pages. [7]. Jones, S.J., 1987, “Ice Tank Test Procedure at the
Institute for Marine Dynamics”, Institute for Ocean Technology, National Research Council of Canada, Report No. LM-AVR-20.
[8]. Jones, S.J., Soininen, H., Jussila, M., Koskinen, P., Newbury, S. and Browne, R., 1997, “Propeller-Ice Interaction”, Transactions of the Society of Naval Architects and Marine Engineers, Vol. 105, p. 399-425.
[9]. Jordaan, I.J. and Maes, M.A., 1991, “Rationale for load specifications and load factors in the new CSA code for fixed offshore structures", Canadian Journal of Civil Engineering, Vol. 18, No. 3, pp. 454-464.
[10]. Jordaan, I.J., Maes, M.A., Brown, P.W., and Hermans, I.P., 1993, “Probabilistic analysis of local ice pressures”, Journal of Offshore Mechanics and Arctic Engineering, 1993, Vol. 115, No. 1, pp. 83-89.
[11]. Jordaan, I.J., 2001, “Mechanics of ice-structure interaction”, Engineering Fracture Mechanics, 68, pp. 1923-1960.
[12]. Jordaan, I.J., 2004, Decisions under Uncertainty –Probabilistic Analysis for Engineering Decisions, Cambridge University Press, 672 pages.
[13]. Maes, M. A and Hermans, I. P., 1991, “Review of Methods of Analysis of Data and Extreme Value Techniques for Ice Loads”, Queen’s University, Kingston, Ontario, Canada.
[14]. Moores, C., Veitch, B., Bose, N., Jones, S. J., Carlton, J., 2001, “Multi-component blade load measurements on a propeller in ice” Transactions Society of Naval Architects and Marine Engineers Vol. 110, p.169-188.
[15]. Searle, S., 1999, “Ice Tank Test of a High Ske-wed Propeller and a Conventional Ice- Class Propeller in Four Quadrants”, Master of Engineering Thesis, Memorial University of Newfoundland, St. John's, Newfoundland. [16]. Spencer, D.S., and Timco, G.W., 1990. CD
model ice: a process to produce correct density (CD) model ice. Proc. 10th IAHR Symposium on Ice, Espoo, Finland, Vol. 2, p. 745-755. [17]. Timco, G., 1986, “EG/AD/S: A new type of
model ice for refrigerated towing tanks”, Cold Science and Technology, Vol. 12, p. 175-195. [18]. Walker, D., Bose, N., and Yamaguchi, H., 1994,
”Hydrodynamic Performance and Cavitation of an Open Propeller in a Simulated Ice Blocked Flow”, Journal of OMAE, Vol. 116.
[19]. Wang, J., Akinturk, A., Foster, W., Jones, S.J., and Bose, N., 2004, “An experimental model for
ice performance of podded propellers”, Proc. of the 27th American Towing Tank Conference, NRC/IOT, (CD-ROM, no page numbers). [20]. Wang, J., Akinturk, A., Jones, S., Bose, N.,
2005, “Ice loads on a model podded propeller blade in milling conditions”, 24th International Conference on Offshore Mechanics and Arctic Engineering, Halkidiki, Greece, (CD-ROM, no