Supporting Information:
Mechanistic Investigation on Catalytic Deoxygenation of Phenol as
a Model Compound of Biocrude Under Methane
Aiguo Wang1, Danielle Austin1, Peng He1, Michelle Ha2, Vladimir K. Michaelis2, Lijia Liu3, Hui Qian4, Hongbo Zeng5, Hua Song1*
1Department of Chemical and Petroleum Engineering, University of Calgary 2500 University Drive, NW, Calgary, Alberta T2N 1N4, Canada
2Department of Chemistry, University of Alberta
11227 Saskatchewan Drive, Edmonton, Alberta T6G 2G2, Canada
3Jiangsu Key Laboratory for Carbon-Based Functional Materials & Devices, Institute of Functional Nano and Soft Materials (FUNSOM), Soochow University-Western University Centre for Synchrotron Radiation Research, Soochow University, Suzhou, Jiangsu, 215123,
China
4National Institute for Nanotechnology, National Research Council Edmonton, Alberta, T6G 2M9, Canada
5Department of Chemical and Materials Engineering, University of Alberta 9211-116 Street NW, Edmonton, Alberta T6G 1H9, Canada
Supporting Information contains 21 pages including 12 Figures and 6 tables.
*Corresponding author.
Fax: +1 (403) 284-4852; Tel: +1 (403) 220-3792; E-mail: sonh@ucalgary.ca
Contents
Characterizations ...4
XRD of various fresh and spent catalysts...6
DRIFT and NH3-TPD ...6
XRD of fresh and spent 1%Zn/ZSM5 catalysts...9
TEM-EDX ...10
XPS ...12
Active sites on catalyst ...13
Liquid 13C NMR ...14
Liquid 1H and 2H NMR ...15
The rate of phenol and methane...16
Phenyl ring opening ...19
List of Tables
Table S1. Characterization of acidic sites on various catalysts upon NH3-TPD ...9
Table S2. Total amount of NH3 molecules desorbed per Al site in HZSM5 and 1%Zn/ZSM5 ...14
Table S3. 13C liquid NMR comparative peak area ratio with respect to CDCl3 of the products from phenol deoxygenation under 13CH4 and CH4 environment...14
Table S4. 1H liquids NMR peak area ratio with respect to CDCl3 of the products from the reactions between phenol and CH4/CD4...15
Table S5. 13C liquid NMR comparative peak area ratio with respect to that for CDCl3 of the products collected from the reactions between phenol-1-13C/phenol and methane ...19
Table S6. The composition of liquid products collected over 1%Zn/ZSM5 under N2 environment using benzene as the feedstock ...20
List of Figures
Figure S1 Powder XRD patterns of various fresh catalysts (a) synthesized via incipient wetness
impregnation and the spent catalysts (b) collected after reaction under methane environment ...6
Figure S2. DRIFT spectra collected over various fresh catalysts upon pyridine adsorption...8 Figure S3. The NH3-TPD profiles and Bigaussian deconvoluted peaks of various catalysts. black line is experimental curve, and the red line is the fitting curve...8
Figure S4. Powder XRD patterns of fresh HZSM5 and 1%Zn/ZSM5, as well as spent
1%Zn/ZSM5 catalysts collected under CH4/N2 environments...10
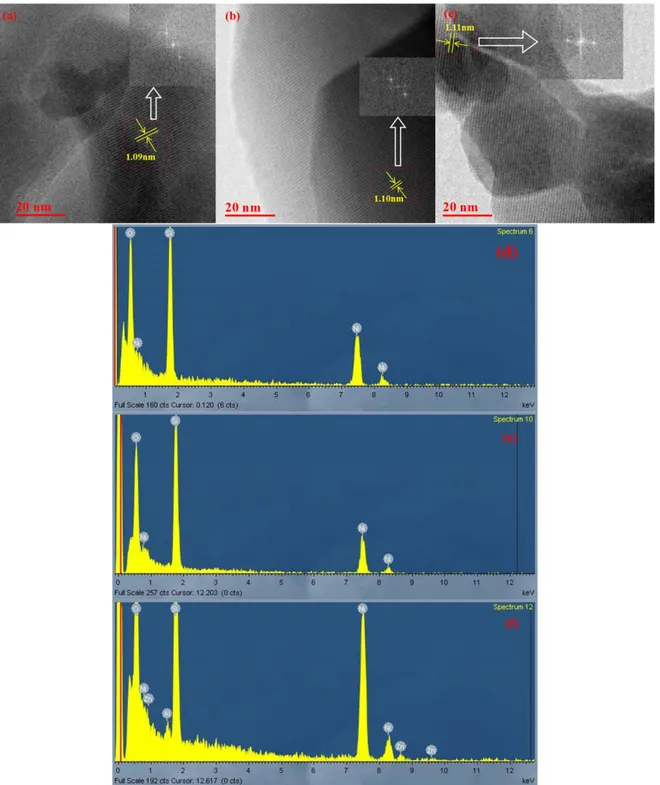
Figure S5. The TEM images of fresh 1%Zn/ZSM-5 catalyst (a), spent 1%Zn/ZSM-5catalyst
collected under environments of CH4 (b) and N2 (c). The inset of (a), (b), and (c) show the FFT analysis of selective region in the crystal, respectively; and the interplanar spacing between two (101) planes is determined to be 1.09, 1.10 and 1.11 nm, respectively. The EDX patterns (d, e, and f) of the samples taken from corresponding TEM images. The signal of Ni peaks is originated from the substrate. ...11
Figure S6. XPS spectra of 1%Zn/ZSM-5 before and after reactions under CH4/N2 environments at Zn 2p regions. The spectra were smoothed using the mean of 50 points. ...12
Figure S7. H2-TPR of 1%Zn/ZSM5 (30 ml/min, 5 %H2/Ar, 10 ºC/min) ...13
Figure S8. The 1H (a and b) and 2H (c and d) NMR spectra of the liquid products collected from the reaction between phenol and CH4/CD4. The peak at 7.23 ppm belongs to CDCl3 which serves as the internal reference. ...15
Figure S9. Zinc L3-edge XAS spectra collected in fluorescence mode for fresh catalyst, spent catalysts collected after varying reaction time at 400 ºC, and metal Zn, ZnO references at room temperature. The spectra are normalized to by subtracting a straight line fitted to zero before L3 edge...16
Figure S10. The rate constant of methane and phenol during phenol deoxygenation over
1%Zn/ZSM5 at 400 ºC. ...17
Figure S11. 1H MAS NMR of Zn/ZSM-5 catalysts for the reaction of methane and phenol with different time. (a) Zn/ZSM-5 catalysts were collected after the reaction of phenol and CH4 for 1 s (solid line), phenol and CD4 for 1 s (red dotted line); (b) Zn/ZSM-5 catalysts were collected after
Characterizations
Powder X-ray diffraction (XRD) analysis of the catalysts was carried out on a Rigaku ULTIMA III X-ray diffractometer with a Cu Kα irradiation source at a voltage of 40 kV and current of 44 mA. All powder diffraction data were acquired between a 2θ of 3-90º, using 2º step/min.
TEM- Powder samples were dispersed in pure ethanol; sonicated for about 2 mins; then placed 5 µl droplet on carbon coated Nickel TEM grids and dried at ambient air before imaging. All images were obtained on JEOL2200FS TEM at 200 kV. Energy dispersive X-ray spectra (EDXs) were acquired using Oxford INCA Energy in STEM mode with 1.5 nm probe.
NH3-TPD was performed on the Finesorb-3010 Chemisorption Analyzer using ~200 mg sample. Ammonia was selected due to its simplicity, small molecular size, and ability to titrate both strong and weak acid sites on the catalyst. Prior to measurements, fresh samples were calcined in He flow with 30 sccm at 600 °C for 30 min with a ramp rate of 20 °C/min. All samples were then cooled to 100 °C and then adsorption of ammonia was performed in 0.5% NH3/N2 with a flow rate of 30 sccm for 90 min. After flowing He for 60 min to remove any physically adsorbed NH3, TPD was carried out by ramping to 600 °C at 10 °C/min and held for 30 min. A thermal conductivity detector (TCD) determined the amount of desorbed NH3. The acquired curve is deconvoluted with Bigaussian.
The surface acidity was studied upon pyridine adsorption. The DRIFT spectrum was acquired with a Thermo-Scientific-Nicolet iS50 equipped with an environmental chamber and a liquid-nitrogen cooled mercury–cadmium–telluride (MCT) detector. The gas inlet was connected to a bubbler for liquid feedstock introduction via two three-way valves. Inlet gas could pass through the liquid sample before entering the chamber. For conducting pyridine adsorption, the
catalyst sample was first put in the environmental chamber at 500 ºC with a 30 sccm N2 flow for 30 min to remove impurities adsorbed on the catalyst surface before collecting background spectra at room temperature. The N2 flow was then sent into the aforementioned bubbler filled with pyridine and kept for 10 min in order to introduce pyridine into the environmental chamber as a vapor phase. After that, the gas flow was switched back to 30 sccm pure N2 by bypassing the bubbler. The spectrum was then recorded in an absorbance mode upon stabilization for 30 min at room temperature under 30 sccm of N2.
The X-ray photoelectron spectroscopy analysis was performed using Kratos Axis spectrometer with monochromatized Al Kα (hυ = 1486.71 eV). The spectrometer was calibrated using the binding energy (84.0 eV) of Au 4f7/2 with reference to Fermi level. The pressure of analysis chamber during experiments is more than 5×10⁻¹⁰ Torr. A hemispherical electron-energy analyzer working at the pass energy of 20 eV was used to collect core-level spectra while survey spectrum within a range of binding energies from 0 to 1100 eV was collected at analyzer pass energy of 160 eV. Charge effects were corrected by using the C 1s peak at 284.8 eV. A Shirley background was applied to subtract the inelastic background of core-level peaks. Non-linear optimization using the Marquardt Algorithm (Casa XPS) was used to determine the peak model parameters such as peak positions, widths and peak intensities. The model peak to describe XPS core-level lines for curve fitting was a product of Gaussian and Lorentzian functions.
The water content of liquid samples was determined using Karl Fischer (KF) titration (Metrohm 870 Titrino Plus) through averaging the results collected from at least three independent measurements.
XRD of various fresh and spent catalysts
There are no additional peaks observed in the XRD patterns shown in Fig.S1, indicating that the support framework is well maintained after the loading of metals species. It is also observed that the intensity of the diffraction peaks originated from (101) and (020) crystal planes of ZSM5 are reduced to varying degrees because of the metal ions deposition when these metal species (Zn, Ag, Ga, Pt, Pd, Ru, Ir) are loaded on the framework.
Figure S1 Powder XRD patterns of various fresh catalysts (a) synthesized via incipient wetness
impregnation and the spent catalysts (b) collected after reaction under methane environment
DRIFT and NH3-TPD
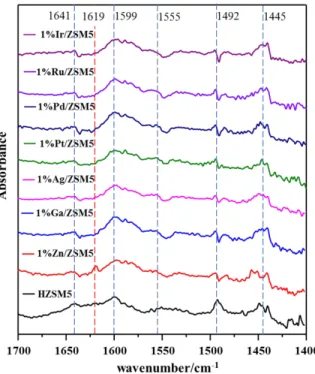
The surface acidity of various catalysts employed in this work is also investigated by using pyridine as the probe and recorded in terms of DRIFT spectra; the corresponding results are depicted in Fig. S2. The peaks at around 1445 cm-1 are assigned to Lewis acid sites 4-5, while those appearing at 1555 cm-1 are due to Bronsted acid sites upon pyridine adsorption. The peaks located at 1492 cm-1 are assigned to coordinating pyridine molecules (pyridine and pyridinium
ion), which is due to the Lewis and Bronsted acid sites6. The peaks at around 1600 cm-1 are assigned to the hydrogen-bonded pyridine7, which are closely associated to Bronsted acid sites, while the peaks at around 1619 cm-1 are assigned to pyridinium H-bonded with pyridine, which are attributed to Lewis acid sites6-8. The peaks at around 1641 cm-1 due to pyridinium H-bonded with pyridine and the ZSM-5 framework correspond to the Bronsted acid sites4. Spectra of all supported metal catalysts exhibit the typical signals for pyridine molecules protonated at Bronsted sites and the signals for pyridine coordinated at Lewis sites, with similar distribution of those two acid sites. However, the peak at 1619 cm-1 observed exclusively on the spectra of 1%Zn/ZSM5 is indicative of more Lewis acid sites4 available, which could have a preponderant role in the deoxygenation process9 and contribute to the better catalytic performance on phenol conversion.
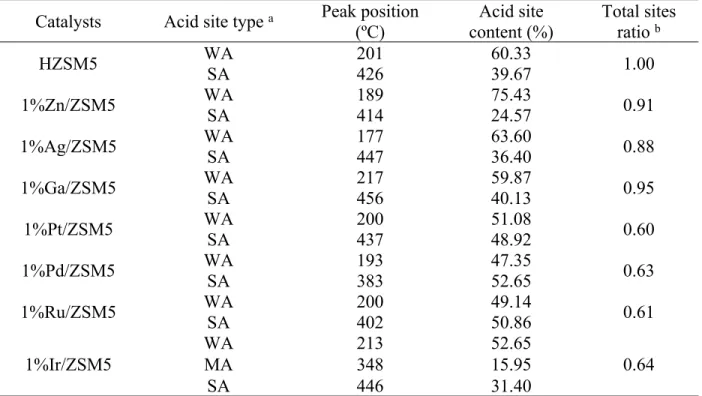
The features of surface acidic sites of various catalysts developed in this study are further analyzed using NH3-TPD, the results of which are presented in Fig. S3 for better comparison. The low-temperature (LT) peak around 200 ºC might originate from NH3 molecules desorbed from the weak surface acidic sites (WAS) while the high-temperature (HT) peak located at 400 ºC is probably associated with NH3 molecules desorption from strong surface acidic sites (SAS), 10 and the peaks in the region of 300-400 ºC is indicative of the presence of medium acidic sites (MAS). It’s evident that the metal loading on zeolite support decreases the total acid sites and changes distribution of WAS, MAS, and SAS as seen in Table S1. Higher ratio of WAS to SAS is observed on the surface of 1%Zn/ZSM5 catalyst, probably due to more Lewis acid sites available (in Fig. S2) which can be treated as WAS. The considerably abundant acidic sites and higher ratio of WAS to SAS over 1%Zn/ZSM5 might facilitate the phenol dissociation to form the desired BTEX products with less coke under methane environment.
Figure S2. DRIFT spectra collected over various fresh catalysts upon pyridine adsorption
Figure S3. The NH3-TPD profiles and Bigaussian deconvoluted peaks of various catalysts. black line is experimental curve, and the red line is the fitting curve.
Table S1. Characterization of acidic sites on various catalysts upon NH3-TPD Catalysts Acid site type a Peak position
(ºC) Acid site content (%) Total sites ratio b WA 201 60.33 HZSM5 SA 426 39.67 1.00 WA 189 75.43 1%Zn/ZSM5 SA 414 24.57 0.91 WA 177 63.60 1%Ag/ZSM5 SA 447 36.40 0.88 WA 217 59.87 1%Ga/ZSM5 SA 456 40.13 0.95 WA 200 51.08 1%Pt/ZSM5 SA 437 48.92 0.60 WA 193 47.35 1%Pd/ZSM5 SA 383 52.65 0.63 WA 200 49.14 1%Ru/ZSM5 SA 402 50.86 0.61 WA 213 52.65 MA 348 15.95 1%Ir/ZSM5 SA 446 31.40 0.64 a WA, MA, and SA refer to the sites with weak, medium and strong acidity.
b Total sites ratio is NH3-TPD peak ratio with respect to HZSM5 and calculated based on the area of the deconvoluted peaks.
XRD of fresh and spent 1%Zn/ZSM5 catalysts
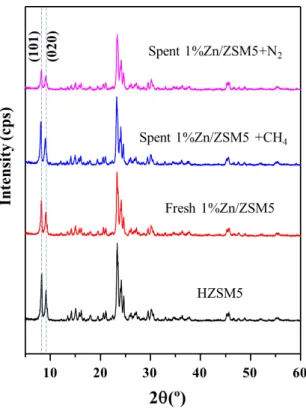
As the XRD patterns shown in Fig. S4, it’s noticed that the intensity of the peaks originated from (101) and (020) crystal planes of ZSM5 are significantly reduced under N2 environment, while slightly increased under CH4 environment when compared with fresh catalyst 1%Zn/ZSM5. This might be because Zn species migrate away from the ZSM5 framework, which increases the crystallinity of those two planes under CH4 environment. In contrast, Zn agglomeration occurs in the reaction under N2 environment, which results in the reduction of the
Figure S4. Powder XRD patterns of fresh HZSM5 and 1%Zn/ZSM5, as well as spent
1%Zn/ZSM5 catalysts collected under CH4/N2 environments.
TEM-EDX
As shown in Fig. S5, quite similar interplane spacing between two (101) planes suggests the crystal structure of support is well maintained during the reaction, which is consistent with the observation that there is no additional peak in XRD patterns in Fig S4. There is no Zn species detected by EDX on the fresh and spent catalyst collected under methane environment as shown in Fig. S5d and e. This may be due to low concentration caused by the high dispersion of Zn. While Zn species detected by EDX on the spent catalyst collected under N2 environment is indicative of higher concentration of Zn species, which may be caused by a certain degree of Zn agglomeration. This observation is consistent with the reduction of the crystallinity observed in XRD patterns in Fig S4. Namely, methane may facilitate the dispersion of Zn species in the
XPS
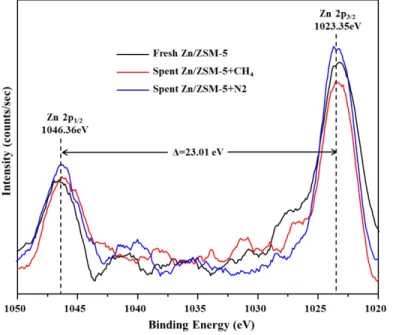
As displayed in Fig. S6, Zn 2p has two typical fitting peaks found at about 1023.35 and 1046.36 eV corresponding to Zn 2p3/2, and Zn 2p1/2, respectively11-13. The binding energy separation between Zn 2p3/2 and Zn2p1/2 is 23.01 eV, which is in agreement with reported data (Δ= 23 eV) 13. These observations suggest Zn species on the catalysts as oxidation state of 2+. As compared the spectra collected from phenol +CH4 run with that from the fresh one, the intensity of peak associated with Zn species is slightly reduced, which can result from Zn species that might mitigate into the inner pores of the zeolite support and re-disperse better on the surface in the presence of methane. In contrast, the surface concentration of Zn species increases a little after reaction under N2 environment probably as a result of Zn agglomeration. These observations are highly consistent with the results of XRD in Fig. S4 and TEM-EDX in Fig. S5.
Figure S6. XPS spectra of 1%Zn/ZSM-5 before and after reactions under CH4/N2 environments at Zn 2p regions. The spectra were smoothed using the mean of 50 points.
Active sites on catalyst
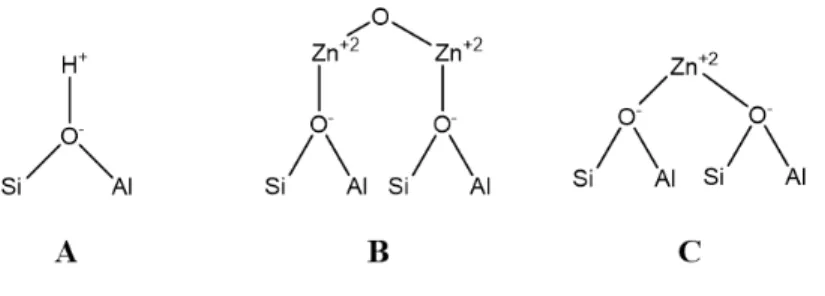
In addition to acidic sites (A), extra-crystalline ZnO and other Zn species (B and C) could be present on 1%Zn/ZSM5 catalyst as described below. Zn species (B and C) coordinated with zeolite can’t be reduced, while extra-crystalline ZnO could be reduced. 14
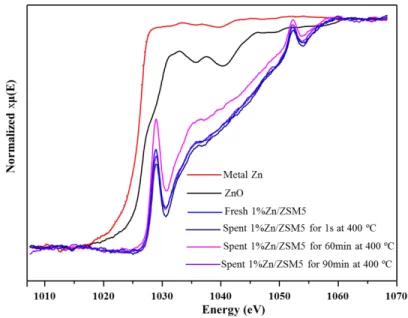
H2-TPR (temperature programmed reduction) investigation (Fig. S7) on 1%Zn/ZSM5 shows a tiny reduction, implying that the formation of extra-crystalline ZnO is negligible. Namely, Zn species are almost chemically bonded to zeolite by replacement of H+, which is consistent with the observation in Zn L3-edge XA spectra as shown in Fig. 1. Therefore, the catalytic sites in the reaction are acidic sites (A) and Zn species (B and C).
Figure S7. H2-TPR of 1%Zn/ZSM5 (30 ml/min, 5 %H2/Ar, 10 ºC/min)
The distribution of these sites is further determined based on the results of NH3-TPD of HZSM5 and 1%Zn/ZSM5.
Table S2. Total amount of NH3 molecules desorbed per Al site in HZSM5 and 1%Zn/ZSM5 NH3 adsorbed (NH3 molecule/Al site)
Predicted
Sample Zn/Al
Zn site (B) Zn site (C) Experimental
HZSM5 0 0 0 1.02
1%Zn/ZSM5 0.15 1.02 0.87 0.93
Ammonia adsorption measurements (Table S2) indicate both two Zn sites (B and C) are present. The mole percent of three sites A, B, C are estimated to be 83.5%, 6.6%, and 9.9%, respectively.
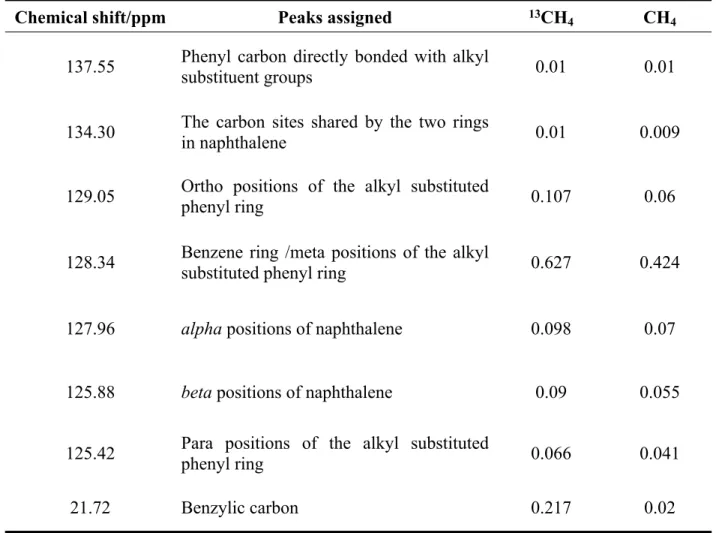
Liquid 13C NMR
Table S3. 13C liquid NMR comparative peak area ratio with respect to CDCl3 of the products from phenol deoxygenation under 13CH4 and CH4 environment
Chemical shift/ppm Peaks assigned 13CH
4 CH4
137.55 Phenyl carbon directly bonded with alkyl substituent groups 0.01 0.01
134.30 The carbon sites shared by the two rings
in naphthalene 0.01 0.009
129.05 Ortho positions of the alkyl substituted
phenyl ring 0.107 0.06
128.34 Benzene ring /meta positions of the alkyl
substituted phenyl ring 0.627 0.424
127.96 alpha positions of naphthalene 0.098 0.07
125.88 beta positions of naphthalene 0.09 0.055
125.42 Para positions of the alkyl substituted phenyl ring 0.066 0.041
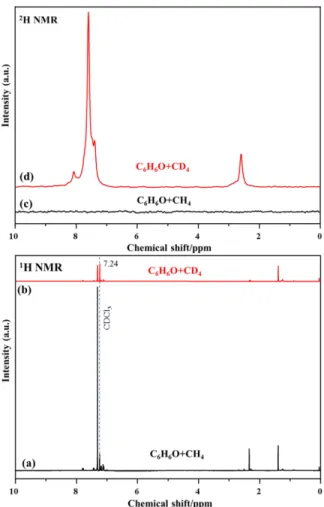
Liquid 1H and 2H NMR
Figure S8. The 1H (a and b) and 2H (c and d) NMR spectra of the liquid products collected from the reaction between phenol and CH4/CD4. The peak at 7.23 ppm belongs to CDCl3 which serves as the internal reference.
Table S4. 1H liquids NMR peak area ratio with respect to CDCl3 of the products from the reactions between phenol and CH4/CD4
The type of proton Chemical Shifts /ppm C6H6O+CH4 C6H6O+ CD4
aromatic 7.0-7.8 17.29 4.52
Figure S9. Zinc L3-edge XAS spectra collected in fluorescence mode for fresh catalyst, spent catalysts collected after varying reaction time at 400 ºC, and metal Zn, ZnO references at room temperature. The spectra are normalized to by subtracting a straight line fitted to zero before L3 edge.
The rate of phenol and methane
The reaction rates of methane and phenol during phenol conversion over 1%Zn/ZSM5 at 400 ºC were calculated assuming a pseudo-first-order reaction as below:
ln (1 ― 𝑥) = ―𝑘 ∙ 𝑚𝑐𝑎𝑡∙ 𝑡
where is the pseudo-first-order rate constant (𝑘 𝑔―1∙ 𝑚𝑖𝑛―1), is the conversion of methane or 𝑥 phenol, 𝑚𝑐𝑎𝑡 is the mass of catalyst in the reaction (1.0 g) and t is the reaction time (min).
Based on the results shown in Table 3, the reaction rate of methane and phenol are calculated to be as below:
𝑟𝑝ℎ𝑒𝑛𝑜𝑙= 6.7 × 10―2 (𝑚𝑖𝑛―1) 𝑟𝑚𝑒𝑡ℎ𝑎𝑛𝑒= 5.4 × 10―4 (𝑚𝑖𝑛―1)
Figure S10. The rate constant of methane and phenol during phenol deoxygenation over
1%Zn/ZSM5 at 400 ºC.
As shown in Fig. S11, the peak at 7.4 ppm due to the hydrogen atoms of the aromatic ring; the shoulder peak at 7.0 ppm from hydrogen atoms at ortho- and meta- sites of phenol; the broad peak at 5.5 is assigned to –OH group attached to aromatic ring and the protons of Bronsted acid sites (with a chemical shift of 4-6 ppm); the signal at 2.3 ppm is assigned to benzylic proton; the signal at 1.7 ppm due to isolated external silanol groups; and the small peak at 0.9 ppm from methane species (CH4-xDx) absorbed on the catalyst. Initially, the decrease in intensity of peaks at
7.4 ppm, 7.0 ppm, 5.5 ppm, 1.7 ppm in (a) may be due to the H/D exchange reaction. The decrease in intensity of peak at 2.3 ppm is probably due to –CD3 group attached to the ring. After 1 h of reaction, the significant decrease in the intensity of peaks at 7.4 ppm and 2.3 ppm due to methane-D4 incorporation into both aromatic ring and the attached methyl groups. The peaks at
Figure S11. 1H MAS NMR of Zn/ZSM-5 catalysts for the reaction of methane and phenol with different time. (a) Zn/ZSM-5 catalysts were collected after the reaction of phenol and CH4 for 1 s (solid line), phenol and CD4 for 1 s (red dotted line); (b) Zn/ZSM-5 catalysts were collected after the reaction of phenol and CH4 for 1 h (solid line), phenol and CD4 for 1 h (red dotted line).
Phenyl ring opening
Aromatic ring opening is supported by the quantitative analysis of liquid 13C-NMR results presented in Table S3 and Table S5. The mole percentages of carbons from methane and phenol-1-C in the liquid products are estimated to be 2.0% and 16.1%, respectively, based on the natural abundance of 13C (1.1%). Namely, the ratio of the carbons from phenol-1-C to the carbons from other sites of phenol after the reaction is approximately 0.19, which is slightly lower than that in phenol (0.20) before the reaction. The loss of phenol-1-C from phenol implies that aromatic ring opening reaction did occur under this circumstance, resulting in the removal of phenol-1-C as the form of gas products (CO or CO2).
Table S5. 13C liquid NMR comparative peak area ratio with respect to that for CDCl3 of the products collected from the reactions between phenol-1-13C/phenol and methane
Chemical shift/ppm Peaks assigned Phenol-1-13C phenol
137.55 Phenyl carbon directly bonded with alkyl substituent groups 0.162 0.009 134.30 The carbon sites shared by the two rings
in naphthalene 0.072 0.000
129.05 Ortho positions of the alkyl substituted phenyl ring 0.999 0.068 128.34 benzene ring /Meta positions of the alkyl
substituted phenyl ring 5.357 0.371
127.96 alpha positions of naphthalene 0.618 0.035
125.88 beta positions of naphthalene 0.525 0.038
Figure S12. Mass spectra of gas products (a) CO and (b) CO2 obtained from the reactions between phenol/phenol-1-13C and methane at 400 ºC (60 min) over 1%Zn/ZSM5 with the estimated isotopic composition (mol%)
Table S6. The composition of liquid products collected over 1%Zn/ZSM5 under N2 environment using benzene as the feedstock
Liquid composition (C mol %)
1%Zn/ZSM5 No catalyst Benzene 75.1 98.7 Toluene 10.4 1.3 Ethylbenzene 3.65 0 Xylene 0.79 0 C9 aromatics 1.57 0 Naphthalene 7.86 0 Diphenylmethane 0.68 0
Reaction conditions: 0.0/1.0 g catalyst with 0.1 g benzene, 2.0 MPa at 400 ºC, 60 min, 300 mL batch reactor. The tiny amount of toluene is observed in the run without catalyst due to the impurities in the benzene.
References
1. Pines, A.; Gibby, M. G.; Waugh, J. S., Proton‐Enhanced Nuclear Induction Spectroscopy. A Method for High Resolution NMR of Dilute Spins in Solids. The Journal of Chemical Physics
1972, 56 (4), 1776-1777.
2. Bennett, A. E.; Rienstra, C. M.; Auger, M.; Lakshmi, K. V.; Griffin, R. G., Heteronuclear decoupling in rotating solids. The Journal of Chemical Physics 1995, 103 (16), 6951-6958.
3. William LEarl; D.LVanderhart, Measurement of 13C Chemical Shifts in Solids. Journal
of Magnetic Resonance (1969) 1982, 48 (1), 35-54.
4. Topaloǧlu Yazıcı, D.; Bilgiç, C., Determining the surface acidic properties of solid catalysts by amine titration using Hammett indicators and FTIR-pyridine adsorption methods.
Surface and Interface Analysis 2010, 42 (6-7), 959-962.
5. Busch, O. M.; Brijoux, W.; Thomson, S.; Schüth, F., Spatially resolving infrared spectroscopy for parallelized characterization of acid sites of catalysts via pyridine sorption: Possibilities and limitations. Journal of Catalysis 2004, 222 (1), 174-179.
6. Hemmann, F.; Jaeger, C.; Kemnitz, E., Comparison of acidic site quantification methods for a series of nanoscopic aluminum hydroxide fluorides. RSC Adv. 2014, 4 (100), 56900-56909. 7. PARRY, E. P., An Infrared Study of Pyridi,ne Adsorbed on Acidic Solids. Characterization of Surface Acidity JOURNAL OF CATALYSIS 1963, 2, 371-379
8. Tommy Barzetti, E. S., Daniele Moscotti and Lucio Forni, Pyridine and ammonia as probes for FTIR analysis of solid acid catalysts. J. Chem. Soc., Faraday Trans., 1996, 92, 1401-1407.
9. Veses, A.; Puértolas, B.; López, J. M.; Callén, M. S.; Solsona, B.; García, T., Promoting Deoxygenation of Bio-Oil by Metal-Loaded Hierarchical ZSM-5 Zeolites. ACS Sustainable
Chemistry & Engineering 2016, 4 (3), 1653-1660.
10. Ferenc Lonyi, J. V., On the interpretation of the NH 3-TPD patterns of ZSM-5 and H-mordenite. Microporous and Mesoporous Materials 2001, 47 (2), 293-301.
11. Deerattrakul, V.; Dittanet, P.; Sawangphruk, M.; Kongkachuichay, P., CO2 hydrogenation to methanol using Cu-Zn catalyst supported on reduced graphene oxide nanosheets. Journal of CO2 Utilization 2016, 16, 104-113.
12. Lupan, O.; Emelchenko, G. A.; Ursaki, V. V.; Chai, G.; Redkin, A. N.; Gruzintsev, A. N.; Tiginyanu, I. M.; Chow, L.; Ono, L. K.; Roldan Cuenya, B.; Heinrich, H.; Yakimov, E. E., Synthesis and characterization of ZnO nanowires for nanosensor applications. Materials
Research Bulletin 2010, 45 (8), 1026-1032.
13. Al-Gaashani, R.; Radiman, S.; Daud, A. R.; Tabet, N.; Al-Douri, Y., XPS and optical studies of different morphologies of ZnO nanostructures prepared by microwave methods.
Ceramics International 2013, 39 (3), 2283-2292.
14. Biscardi J A, M. G. D., Iglesia E., Structure and density of active Zn species in Zn/H-ZSM5 propane aromatization catalysts. Journal of Catalysis 1998, 179 (1), 192-202.