HAL Id: hal-00488272
https://hal-mines-paristech.archives-ouvertes.fr/hal-00488272
Submitted on 1 Jun 2010
HAL is a multi-disciplinary open access archive for the deposit and dissemination of sci-entific research documents, whether they are pub-lished or not. The documents may come from teaching and research institutions in France or abroad, or from public or private research centers.
L’archive ouverte pluridisciplinaire HAL, est destinée au dépôt et à la diffusion de documents scientifiques de niveau recherche, publiés ou non, émanant des établissements d’enseignement et de recherche français ou étrangers, des laboratoires publics ou privés.
Strategic inputs into patent pools
Justus Baron, Henry Delcamp
To cite this version:
CERNA WORKING PAPER SERIES
Strategic inputs into patent pools
Justus Baron
Henry Delcamp
Working Paper 2010:05
Cerna, Centre d’économie industrielle MINES ParisTech
60, boulevard Saint Michel 75272 Paris Cedex 06 – France
Tél. : 33 (1) 40 51 90 00 May 2010
Strategic inputs into patent pools
1
Justus BARON
2Henry DELCAMP
3Abstract:
This article explores what factors determine the decision of a patent pool to accept new inputs. We propose a dynamic analysis of 1337 U.S. patent inputs into 7 important pools. This analysis highlights a trade-off between firm and patent characteristics as the determinants of inclusion of patents into pools. For instance we prove that firms already member of the pool or holding large patent portfolios are able to include lower quality patents. These findings can be explained both by bargaining power and information asymmetry. In particular, as measured by a new indicator, insiders and firms practicing the technology file patents that are better aligned with the criteria of essentiality.
1
We are indebted to Timothy Simcoe, Anne Layne-Farrar, François Lévêque, Yann Ménière and Jan Eilhard for comments and suggestions. We thank Knut Blind and researchers at TU Berlin for their support. All errors are our own.
2
CERNA, Mines ParisTech
3
Introduction
Many important standards incorporate proprietary technology that can be licensed from patent pools. Patent pools are agreements between different patent holders to offer joint licenses for a bundle of patents. There have been patent pools since the early 19th century, but only since the successful launch of the MPEG24 and DVD patent pools in 1997 and 1999 the phenomenon is evolving at breathtaking speed. Patent pools are today a phenomenon of increasing and undeniable importance in ICT (Information, Communication and Telecommunication) technologies. Modern mobile phones, DVD or mp3 players, receivers for digital TV…: all these high tech consumer goods use technology that can be licensed from patent pools. The value of products produced under pool licenses by now exceeds 100 billion US dollar per year even taking into account only the US market (Clarkson, 2004).
There are many advantages of this type of organizations. Patent pools can help reducing the adverse effects resulting from the fact that technological standards incorporate an increasing amount of technologies protected by patents (Shapiro, 2001). One aspect of this patent proliferation is the « patent thicket » problem5. The patent thicket describes a situation in which holders of different patents that are all necessary for complying with a standard mutually block each other in the implementation of the standard. Another advantage of pools highlighted by the economic literature is to reduce the transaction costs by cutting down the number of licenses needed by firms without patents who wish to produce products that comply with the standard. The last advantage of patent pools is to reduce the multiple marginalization problem6. This problem arises if different firms have market power over complementary inputs, such as different patents necessary for complying with the same standard, and fix prices independently of each other.
Nonetheless, although the pools can help reducing transaction costs and the multiple marginalization problem, they also have drawbacks. The main threat is the possibility that firms use the pool for anticompetitive behaviors (Carlson, 1999). In fact, competition authorities monitor pool creation very closely.
4
MPEG2 is a data compression technology of moving pictures used e.g. in digital television, Internet streaming, DVDs etc.
5
The creator of this term defines the patent thicket as « a dense web of overlapping intellectual property rights that a company must hack its way through in order to actually commercialize new technology. » (Shapiro, 2001).
6
This problem was first analyzed by Cournot (1838) as « the exercise of market power at successive vertical layers in a supply chain ».
The main concern for competition emphasized by the literature is the introduction of unnecessary or substitutable patents. For substitutable patents, the risk is that the pool can be used as a price fixing mechanism or help to foreclose competition by introducing a patent and excluding its substitute. In order to avoid these problems, Lerner and Tirole (2004) underline that it is necessary that a pool be formed only of complementary patents.
The effects of introducing unnecessary or substitutable patents are controversially discussed. For example Gilbert (2009) states that if the pool contains at least one essential good quality patent, the introduction of new patents even of poor quality or non essential, without increasing the level of royalties, should not deteriorate the consumer welfare. On the other hand, the inclusion of unnecessary patents into a pool would have the effect to mitigate the advantages of pools for holders of valuable patents. This could result in two important drawbacks. The first one is to reduce the return on technologically significant patents and thus to discourage the innovation efforts. The second potential adverse effect is that holders of good quality patents are less inclined to join the pool. Layne-Farrar and Lerner (2008) find that pools attracting low value patents tend to have fewer members and firms with higher value patent portfolio are less likely to join them. Consequently, pools are less likely to be exhaustive and to effectively reduce transaction costs and multiple marginalization problems.
The problem of strategic inputs into pools has been recently highlighted by several scholars. Layne-Farrar and Lerner (2008) underline the fact that many pools create the incentive to add a high number of patents. Lampe and Moser (2009) analyze the incentive effects of a patent pool for sewing machines in the 19th century. They find that while patent applications increased, there is no observable increase in innovation. They conclude that this finding lends credit to the hypothesis that pools induce an increase in strategically motivated patent applications.
The purpose of this paper is to test the hypothesis of strategic patent inputs into pools using data from contemporary patent pools. We have produced a unique dataset on the timing of patent introduction into several of the most important pools that currently exist. Furthermore, we make use of technical documents to construct a novel indicator for the relative importance of a standard for a patent.
We will highlight patterns of patent introduction providing sufficient evidence for strategic behaviors. This paper shows that a majority of patents in pools have been introduced after its
creation. Only a minority of these late patent introductions can be explained by new patent holders joining the pool. We find that the value of patents introduced by pool members decreases with time. These findings could also be explained by technological reasons. For instance, one could argue that late patent inputs relate to incremental amendments to the underlying standard. However, we find that patents introduced late are essential to increasingly broad parts of the standard. Among patents filed late, those patents that have the broadest essentiality claim on the standard are of the lowest quality. Therefore we argue that the decline in patent value over time is not explained by technological reasons, and more explicitly by the fact that the pool increases to include incremental improvements upon the standard. These results lend credit to the suspicion that pools provide an additional incentive for strategic patent files. We address directly the question of strategic inputs. Testing a range of firm characteristics, we find that insiders introduce patents of lower quality. These findings could be explained by bargaining power and information asymmetries. We find arguments and empirical evidence for both explanations.
The remainder of this paper is organized as follows. Section 1 presents a review of economic theory on pools. Section 2 deals with the methodology of the paper and the presentation of the data. Section 3 presents a quick overview over the interest and novelty of our data to establish new findings. Section 4 explains our main results on the importance of firms’ characteristics for the inclusion of patents in pools. Section 5 presents our main results on the importance of information asymmetry to understand changes in quality of patents included in a pool.
I.
Stylized facts and theoretical background
The economic literature on patent pools discusses the possibility that a pool creates incentive for strategic patent files. For instance Lampe and Moser (2009) find evidence for strategic patent files motivated by the expectation of a patent pool. Layne-Farrar and Lerner (2008) contend that pools may provide incentives to multiply the number of patent files and may allow at least some pool members to introduce into the pool a high number of patents of limited technological and economic value. In particular certain royalty distribution schemes could be thought of to encourage the multiplication of patents.
Revenue-sharing rules
Not all patent pools collect royalties. For example, the Bluetooth pool has a royalty-free licensing rule. In this case, introduction of patents into the pools is driven by non-monetary incentives, such as the access to other firms’ technology. However, all pools collecting royalties have rules on how these royalties are shared between members. There is no public requirement on which revenue sharing rule a pool must adopt. Therefore members can agree on whatever rules they want. Layne-Farrar and Lerner (2008) identify two main types of sharing rules: numeric proportional rules and value proportional rules. Both rules provide important incentives to firms for increasing their share of patents in the pool.
The numeric proportional rule is founded on a division of earnings based on the number of essential patents in the pool. All the pools administered by MPEG LA use this revenue sharing rule. A variant of this rule is the revenue sharing rule of the MPEG 2 patent pool in which the calculation of the number of essential patents is weighted by country. The numeric proportional rule has a direct impact on the incentives to introduce large number of patents because each new patent increases the part of revenue allocated to its holder.
The value added rule exists in several variants. The first possibility is a negotiation that determines what share of revenue each contributor receives. The second possibility is a royalty sharing rule based on determinants such as the age of patents, the number of claims, the number of times the patents are infringed, or the part of the standard these patents are essential for. In this case, the number of patents taken into account for the calculation of the share of revenue is weighted by some indicators of patent quality. The value added rule was for example adopted by the DVD 6C patent pool.
Even though the value added rule weights the number of patents by some indicators of patent quality, it still provides incentives to firms to increase their share of patents in the pool. The business review letter7 of the DVD6C pool states: « The formula that will determine the royalty allocation is based on how many of each Licensor's "essential" patents are infringed. Thus, although the formula weights the patent count with other factors, each Licensor will benefit monetarily from the exclusion of other Licensors' non-"essential" patents and accordingly has a
7
strong incentive to encourage the expert to review other Licensors' patents critically, and to bring to the expert's attention any patents that have ceased to be "essential." ».
It is thus straightforward why companies could have incentives to introduce a high number of patents into a pool. As a further step, it is necessary to analyze whether the rules of pools provide sufficient safeguards against strategic inputs.
The rules governing inclusion of patents into patent pools
In order to be introduced in a pool, a patent has to be « essential » to the underlying standard. In order to ensure the essentiality of the patents, and thus the compliance of patents with the criteria adopted by the pool, patent pools usually have a third party evaluator that establishes essentiality reports. The evaluator’s work is to analyze the patent and to declare whether this patent is « essential » according to the criteria of essentiality chosen by this particular pool.
There are several factors to consider in order to understand if essentiality evaluation is a sufficient safeguard against strategic patent inputs into pools. If the essentiality report is objective and the criteria of evaluation are well-defined, no patent that is not essential to the standard should be included into the pool. For several reasons essentiality reports may not rule out the possibility that pools attract and accept low value patents.
First, it is difficult to ascertain that essentiality reports are impartial and objective in all cases. Patent evaluators are appointed by the pool administrator and paid by the patent holders. As the procedure is non-contentious, there are little safeguards provided against pool policy considerations influencing the evaluation. In several cases of litigation, licensees have accused patent evaluators to be overly lax in their evaluation of allegedly essential patents.8 Furthermore, not in all pools members are forced to consult the expert. The MPEG 2 pool stipulates: « The licensors are bound by the expert’s opinion. However, they need not consult the expert if they agree unanimously in good faith that a submitted patent is an essential patent or that a portfolio patent is not essential». Contrariwise, in other pools such as DVD 6C, the expert decision is required: « The agreement provides that the expert's determinations are "conclusive and
8
This claim is raised as patent misuse defence in many patent infringement cases, e.g. by disc replicator ODS in its litigation MPEGLA over the MPEG2 patent pool; Landgericht Düsseldorf Urteil vom 30. November 2006, Az. 4b O 346/05; V. b) cc);
appealable," although the expert must submit a report explaining any decision that a patent was not "essential". »
Second, the criteria of the essentiality evaluation are not necessarily aligned with the general quality of the patent. Essential patents can still be of low technological or economic value. For instance owners of an essential technology often can choose to protect it by one large or several narrow patents. Each of these numerous narrow patents may still be necessarily infringed by any implementation of the standard and comply with the criteria of essentiality of the respective pool.
Finally the criteria of essentiality are not always exactly the same and may be endogenous: the definition of patent essentiality is a subject of debate; but two mains interpretations emerge from the literature and the decisions of competition authorities (Gilbert, 2009). The first one focuses on technical essentiality. This first interpretation was used by the Department Of Justice (hereafter DOJ) in the 1997 business review letter for the MPEG 2 patent pool9, which emphasizes: « there is no technical alternative to any of the portfolio patents within the standard ». Whereas in this first interpretation essentiality is purely a matter of technology, a second – broader – definition includes criteria of economic feasibility. As to this definition, patents are essential not only if there is no technological alternative, but also if an available technological alternative is so costly that it is impossible to implement the standard at a competitive cost without using the patent. This broader definition includes all patents « necessarily infringed » as a practical matter by compliance with the standard specifications.
In practice, pools have a considerable margin in choosing their criteria of essentiality. For example, in the case of DVD 6C, essentiality is defined as follows: « A Licensor's patent is "essential" […] if it is "necessarily infringed," or "there is no realistic alternative" to it "in implementing the DVD Standard Specifications». Whereas the DVD 6C pool thus implements a definition of essentiality as a practical matter, the MPEG 2 pool sticks to the more narrow criteria of technical essentiality. In the MPEG 2 pool, an essential patent is defined as « any patent claiming an apparatus and/or a method necessary for compliance with the MPEG 2 standard under the laws of the country which issued or published the patent. ». Even if we believe that the patent evaluator makes an absolutely correct job in evaluating objectively all patents according to the criteria of essentiality chosen by pool members, we still can think that the pool members choose these criteria bearing in mind which criteria would fit best their patent portfolio.
9
We have thus found characteristics of patent pools providing incentives for introducing low value patents. The procedures of accepting patents may for several reasons not rule out the possibility that low value patents are incorporated into pools.
II. Methodology
Even though some commentators suggest that pools may increase the number of low value patents, there is to date no reliable evidence. If the number and quality of essential patents is endogenous to pools, this does not necessarily imply that patents in pools are in average of lower quality than other patents. Besides the potentially negative incentive effect, one expects pools to have a positive selection effect: Patents essential to technological standards are generally found to be of higher value than other patents, because SSOs tend to select the best technologies. As patents included in pools are by force of law required to be essential, patents included are expected to be of higher value than the average patent. Delcamp (2009) underlines the link between essentiality and quality showing that pool patents in general receive more citations than control patents presenting the same characteristics.
We thus suggest going a step further by analyzing patent quality with respect to the owners of the patent and the timing of their introduction. In particular, we argue that if patent introduction and acceptation is strategically motivated, we should be able to find a difference between patents introduced into the pool by firms with different characteristics. We thus expect to find that insiders or powerful firms are able to introduce patents of lower quality into pools than firms with weaker bargaining power or outsiders.
Data
We have produced a unique database of 7 patent pools with 8046 patent observations: DVD6C, MPEG2, MPEG4 Systems, MPEG4 Visuals, AVC H/264, IEEE 1394 and DVB-T. Some (few) patents are included in several pools; for our purpose the same patent in different pools is treated like different patent observations. Furthermore patents sometimes change the designation by which they are identified on patent lists (from application number to grant number) or are dropped (by expiry or retrieval of the holder). For these reasons the number of patent observations is higher than the number of patents currently included in the seven pools (around 5000).
We retrieve the patent numbers and the name of patent holders from the lists available on the websites of the pools10. We check using Internet Archives11 when the patent first appeared on the list of pool patents. Patent pool managers regularly update the lists of pool patents on their websites. Like any other information of the site, these data are stored in Internet Archives. Comparing current with previous lists allows identifying the date when a patent is first listed as part of the pool. This date will in the following be called the date of input.
We match the 1337 US patents in our sample with the NBER database and thus obtain a full range of information on the patents, and especially the number of claims, forward and backward cites (forward cites count the number of times a patent is cited by ulterior patents, backward cites count the number of previous patents cited by a patent), patent generality, technological class, and grant and application year. In order to deal with truncation problems and missing observations, we completed the dataset using the web service of the European Patent Office12. Using these databases, we also retrieve the size of the patent family. The patent family is defined as the group of patents sharing the same priority number.
You can see on the following graph the number of U.S. American patents per pool. On the graph, the preponderant number of patents in the DVD6C patent pools becomes apparent. In order to rule out that some of our findings are only due to characteristics that are specific to this pool, we test all our hypotheses also on a sample excluding DVD6C (results in the annex).
872 149 127 112 63 95 DVD 6C MPEG 4 visual avc MPEG 2 IEEE 1394 MPEG 4 systems dvb-t
Figure 1 : Number of U.S. patents / pool
10
www.mpegla.com (MPEG2, MPEG4 Systems, MPEG4 Systems, AVC, IEEE 1394), www.dvd6cla.com (DVD6C),
www.sisvel.com (dvb-t)
11
www.archive.org
12
We dispose for each patent of four important dates: application date, grant date, date of pool creation and date of introduction into the pool. From these dates are drawn our age variables: patent age is the difference between today and the grant date, input age is the difference between date of input and pool creation date, age at input is the difference between date of input and grant date, age at creation is the difference between the date of pool creation and grant date (which can be positive or negative). We further obtain a dummy variable late application which is one for all patents applied after creation of the pool.
Indicators
Many aspects of our theory deal with patent quality or value. As patent quality is at the core of our research hypotheses, the choice of the indicator of patent quality is crucial. Layne-Farrar and Lerner (2008) in their empirical assessment of patent pools use forward cites as an indicator of patent quality. Simcoe (2008) as well uses forward cites when he compares patent quality of patents incorporated into standards with the average quality of patents.
The general argument is that a patent receiving more follow-up citations has proven to be important for ulterior research; it is thus more likely to be a fundamental invention and to carry important technological know-how. Harhoff, Narin, Scherer and Vopel (1997) find that patents more cited are also perceived as more valuable by their owners in survey data; Hall, Jaffe and Trajtenberg (2001) find that patents receiving more citations indeed are more correlated with firm value and Giummo (2003) finds on a sample of German patents that patents cited more often generate higher royalty revenue.
Economists have thought about a potential bias resulting from citations a patent receives from patents of the same patent holder13. To exclude any bias and in line with most empirical research on patent value, we use citations received by patents except citations from the same firm. To be sure, we check and find that our results are not sensitive to using all cites instead.
More worrying in our context is that Hall et al. found that in technology classes where complementary innovations are important, such as ITC technologies, patent citations are less likely to work properly as indicators of patent value. In order to deal with this problem, we distinguish forward and backward cites that are among patents in the same pool (internal cites). External cites are accordingly defined as citations a patent receives from ulterior patents that are not included
13
into the same pool. All results are provided for external cites and all not-self-cites (called from now on all citations for the ease of exposition).
0% 10% 20% 30% 40% 50% 60% 70% 80% 90% 100%
Internal cites External cites
Patents receiving at least one cite Patents receiving no cites
Figure 2 : Internal and external cites
A further problem of patent citations as indicator in economic analysis is that patent citations happen over time and the NBER citation database ends at 2006. In order to control for this truncation problem, we control for patent age and check the robustness of our results by dropping patents applied after 2003. We use different methods of correcting for patent age and application year effects, such as using application year dummies14.
Patent cites are a widely accepted indicator of patent quality. But this indicator has also sometimes been criticized, and Lanjouw and Schankerman (2002) suggest using a compounded indicator composed of forward cites, backward cites, number of claims and family size.
Family size is often accepted as carrying a message on patent value; as each patent file to a foreign patent office is costly. A patent that is filed to many patent offices is thus likely to be of bigger expected financial value to its owner. Of course the presence of a pool may fundamentally flaw this reasoning, as a pool with numerical proportionality rule provides endogenous incentives to file patents. For this reason we will use family size as a robustness check only.
The second alternative indicator is the number of claims. The number of claims is sometimes used as alternative indicator of patent value. In our context, the number of claims is representative of something very specific: we argue that one way to multiply the number of patents in the pool and thus the firm’s share in the royalty streams is to file many narrow patents instead of few large patents. This strategy should clearly be observable using the number of claims.
14
At some point we use patent generality as control variable and in summary statistics. Patent generality is defined as the HHI (the Hirschman Herfindhal Index measures the share of observations in a sample that relate to the n biggest individuals) of the different classes of the patents cited by the patent.
To finish the analysis of patents, we construct a novel indicator for the breadth of the essentiality claim. As discussed earlier, the patent essentiality reports indicate the standard sections for which each patent is essential. Summaries of the essentiality reports carried through by independent patent experts are available on the pools’ websites. These summaries indicate the sections and subsections of the standard document for which the respective patent is essential. We count these sections and subsections and correct by the median of the numbers of patents in the same pool (respectively in the same licensing program for pools with several distinct licensing programs).
The indicator we use for subsequent analysis is the corrected number of sections; but the number of subsections and the not corrected numbers are used for robustness checks. The corrected number of sections divided by the number of claims is our variable for focus of the patent on the standard. The number of sections is an indicator of the broadness of the essentiality claim, the number of claims of the patent is an indicator of the broadness of the patent. The quotient is thus an indicator of the relative weight of the standard-relevant claims in the patent.
Regression methodology
The number of forward cites, claims and patents in the same family are non-negative integers. We use usual count data regression instruments, for instance poisson and negative binomial regressions15. Our new indicator for the focus on the standard is bound to be positive and the density of distribution is almost strictly decreasing with the value, with very few extremely high values (see distribution graph in the annex). Standard OLS is thus not adapted to regressions with focus_standard as explained variable, and once again we use count data methodology.
III. Descriptive
Findings
An important aspect of pools that has so far received practically no academic attention is the growth over time. The only exception is case study evidence collected by Aoki & Nagaoka (2004)
15
on coalition formation. By contrast, our dataset provides novel quantitative information on the timing of patent pools which allows econometric approaches and yields new insights.
The following graphs illustrate the growth path of two important pools.
Figure 3 : DVD 6C pool patents as to country of patent file
Figure 4: MPEG 2 pool patents as to country of patent file
The following chart provides an overview over all the patent pools in our sample. As can be seen, the big majority of U.S. patents that are currently in these pools have been added to the pool at some point after its launch (in blue).
0% 10% 20% 30% 40% 50% 60% 70% 80% 90% 100% IEE E 13 94 DV D 6C MP EG 2 MP EG 4 sys tems MP EG 4 v isua l avc dvb-t Founding patents Not founding patents
Figure 4 : U.S. founding patents / pool
These graphs provide some evidence on the changes of pools over time. There is a spectacular increase in the number of patents in the years after the creation of the pool. In our database, much more than half of the patents have been added to the pool after it was launched.
Neither mergers of pools nor joining of new pool members provide sufficient explanations for this increase in patents over time. We verify immediately that this strong increase is only to a very small extent due to new pool members. The following chart looks only at U.S. patents introduced in the pools after their launch. In the big majority of cases, these patents introduced at a later stage are owned by companies that already before held patents in the same pool. Only a very small share (with the exception of MPEG 2) of patents introduced late into the pools can be explained by new members joining the pool.
0% 10% 20% 30% 40% 50% 60% 70% 80% 90% 100% IEEE 1 394 DVD 6 C MP EG 2 MP EG 4 sy stem s MP EG 4 vi sual avc U.S. patents introduced by outsiders U.S. patents introduced by pool members
Figure 5 : Part of patents introduction not explained by new pool members
As explained in the precedent subsection, our data on the patents’ date of introduction into the pools allows us to establish new findings based on the timing of introduction. Given the above results (the majority of patents are included after the pools’ creation and by companies already members of the pool), it seems logical to analyze the technological quality of the numerous patents introduced late.
As discussed, various features of pools as they are currently designed seem to encourage pool members to increase their number of patents. In a non-cooperative setting, the introduction of numerous low quality patents by one firm could induce other pool members to do the same in order to keep their share in the pool revenue.
But also alternative possible explanations need to be taken into consideration. First of all, standards evolve over time and continue to evolve when the industry has started implementing them. Minor changes to standard specifications or adoption of new annexes and new specifications can incorporate new proprietary technology, which justifies the inclusion of new patents into existing pools. The growth of patent pools could thus entirely be explained by technological amendments to the standard. If a standard is continuously modified to incorporate incremental
improvements, proprietary technology included is of minor importance compared to the core of the standard. It could thus be a plausible explanation for a variation of patents’ quality over time.
We have thus two different sets of explanations for the increasing number of patent. In order to control for the technological explanation (variation of patents’ quality explained by incremental improvements), we introduce a patent generality index. Indeed, we expect patents protecting incremental improvements to be less general, so this control should capture the effect of the narrowing scope of ongoing standardization. In order to analyze the possible link between patents’ quality and timing of introduction, we run the following regression.
(
;
;
;
;
;
;
;
;
)
p p p p p p p p c pyQ
=
f
α η β δ ϕ γ λ φ ε
(I) pQ
: Quality of patent p pα
: Age input of the patent pp
β
: Technology class effectp
δ
: Patent age effectp
ϕ
: Application year effect pγ
: Citing year effectp
λ
: Patent generality indexc
φ
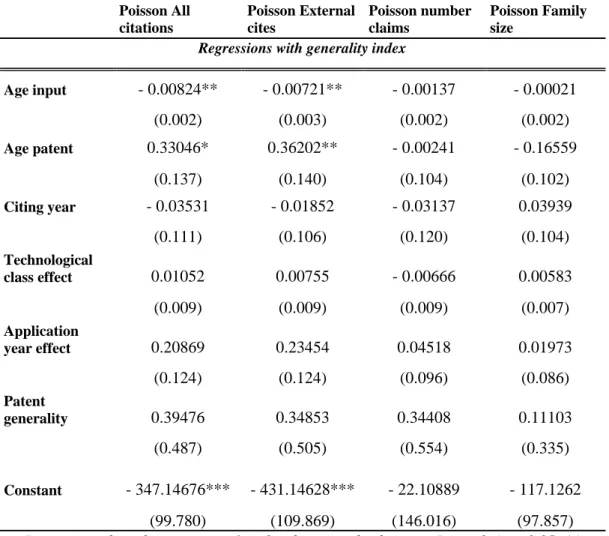
: Vector of control dummy variables for patent poolsWe successively test this hypothesis on the total number of citations (allnscites), the number of external cites, the number of claims and the family size of the patent. We run successively Poisson and negative binomial estimates on each indicator. We run these regressions on patents included by companies already member of the pool. Indeed, we will argue that pool outsiders might have deviating incentives or are constrained in their capacity to introduce low quality patents. In order to control for the patents’ characteristics (age, citing year and application year), we use the approach proposed by Mehta, Rysman and Simcoe (2008) based on the assumption that the
citation age process begins when a patent is granted. This alternative approach allows to control, in the same regression, for the age, citation year and application year effect of the patent.16
As we can see in table 1 the quality of patents included in the pool decreases over time. This result is significant for 3 out of 4 indicators used in this paper. Even if the result based on the number of cites may be questionable (because the number of cites increase over time), having several indicators pointing in the same sense confirms our first result: the quality of pools’ patents decreases over time.
Table 1 : Equation 1 results with generality inde
16
For a discussion of this hypothesis, see : Mehta, Rysman, Simcoe, «Identifying the age profile of patent citations», Journal of Applied Econometrics
Poisson All citations Negative binomial All citations Poisson External cites Negative binomial External cites Poisson number claims Negative binomial number_claims Poisson Family size Negative binomial Family size
Model 2 : Regressions with generality index
Age input -0.00971*** -0.00912*** - 0.00785** - 0.00718*** -0.00439 -0.00422 -0.01091 - 0.00699* (0.003) (0.002) (0.002) (0.002) (0.003) (0.002) (0.007) (0.003) Age patent 0.16905*** 0.18357** 0.15985*** 0.17642** 0.01037 0.01817 -0.30259 - 0.20426* (0.05) (0.061) (0.047) (0.055) (0.047) (0.053) (0.176) (0.081) Citing year 0.33305*** 0.36415*** 0.34801*** 0.38208*** -0.00033 0.00607 -0.20135 -0.08164 (0.079) (0.094) (0.076) (0.091) (0.086) (0.096) (0.197) (0.115) Technologic al class effect - 0.0021* - 0.00235* - 0.00186** - 0.00202** -0.00225** - 0.00247*** -0.00073 -0.00051 (0.001) (0.001) (0.001) (0.001) (0.001) (0.001) (0.001) (0.001) Application year effect 0.00884 -0.00616 -0.00738 -0.01131 -0.03924 -0.04828 -0.29737 - 0.13129 . (0.076) (0.068) (0.074) (0.064) (0.070) (0.072) (0.23) (0.139) Patent generality 0.03818 0.13761 -0.15368 -0.15384 -0.08599 -0.08608 0.77843 0.70735 (0.222) (0.252) (0.155) (0.161) (0.181) (0.171) (0.484) (0.363) Constant -663.971*** -726.299*** - 693.510*** - 761.826*** 4.249 -8.573 409.696 168.88 (157.681) (188.18) (152.55) (182.247) (173.272) (192.506) (396.155) (230.321)
Regressions based on equation 1 with robust standard errors. Legend: * p<0.05; ** p<0.01; *** p<0.001. Pool dummy control variables not reported.
The result is confirmed with 3 out of 4 indicators even though we control for patent generality. Furthermore, later we will see that patents with a narrow essentiality claim are actually of better quality than other patents in the same pool, which is in contradiction with the technological explanation. We can thus argue that the quality of pool patents decrease over time and that this decline can not only be explained by the technological explanation.
To summarize, we have drawn three rather strong findings from the data. A majority of patents in the pools has been added after the launch of the licensing program, insiders stand for a majority of these late patent inputs, and the quality of patents introduced by insiders declines over time. These findings lend credit to the suspicion that firms introduce strategic patents in order to increase their share in the pool. In the next section, we will develop a set of hypotheses that allow testing more directly this suspicion against the data.
IV.
Do firm characteristics matter?
Hypotheses
In order to establish the existence of strategic driving factors of patent introduction into pools, we will in this section suggest a set of research hypotheses. These hypotheses lead to a couple of equations that can be tested against the data. We argue that a theory of strategic patent introductions into patent pools makes sense only if companies have a differential capacity of strategic patent inputs. Strategic patent inputs only have an impact on the distribution of pool income if some pool members are able to increase their share on the expense of others.
Our general hypothesis is therefore that the probability for a patent to be accepted by a pool is dependent on who owns the patent. We thus assume that the evaluation of a patent’s essentiality is not an absolutely exogenous criterion, but that the pool has some margin in selecting patents. More concretely, we assume that the pool operates a binary decision of accepting or refusing the patent (I =[0,1]). This decision is dependent upon two factors: the characteristics of the patent (P), and the characteristics of the patent holder (X).
( , )
I
f X P
+ +
X and P are vectors of parameters. The parameters are sorted so that the relationships between P and I and X and I are positive by definition: X is defined as the ability of firm X to introduce patents of given characteristics into a pool, and P is defined as the attractiveness or intrinsic value of a patent for a pool. Patents accepted by the pool (πI=1) are easily observable, as it is the group of patents included in the pool. Patents not accepted by the pool (
π
I=0) are unobservable. This group includes patents submitted to the pool for evaluation and refused by the evaluator, but also the patents that their holder did not submit because they anticipated that their patent would be rejected. On both groups of patents there is no public information available.We therefore concentrate on the patents in the pool. From (1) we infer that these patents have a higher value to the pool P than the average patent17. Further we infer that these patents qualify by the characteristics X of their holders. Among patents accepted by the pool, the value of the patent to the pool and the characteristics of the patent holder are substitutes. A patent held by a firm with less favorable characteristics needs to be of higher value to the pool in order to be accepted. Patents introduced into pools by firms with more favorable characteristics can include patents of low intrinsic value that would not have been accepted if submitted by a firm with less favorable characteristics. If P and X are independent, we expect that among patents in the pool the average value to the pool of patents held by firms with more favorable characteristics is lower:
( )
P
f X
−
=
for allπ
I=1 (2)The assumption of independence between P and X is a rather strong assumption only for general firm characteristics such as the size of the patent portfolio. Arguably, these firms have a different propensity to patent, which impacts the average quality of their patent. The characteristics of a firm with respect to a pool should however not be correlated with its general propensity to patent.
All other things being equal, we expect the value of the patent for a pool to depend positively upon the technological significance of the underlying invention. We will refer to this factor as the patent’s (intrinsic) quality Q.
( )
P
f Q
+=
for allπ
I=1 (3) 17The relationship between Q and P is positive by assumption. We assume that the pool values patent quality, without explicitly testing it. We do not suggest that patent quality is an explicit criterion of choice, but that all other things being equal patents chosen by pools are of better quality. The reader is referred to Delcamp (2009) for an empirical verification of this assumption.
Many characteristics of a firm can determine its capacity to introduce patents into a patent pool. In order to capture as many effects as possible, we will define X as a vector of firm characteristics, some of which are general firm characteristics, others specific to the relationship between the firm and this particular patent pool, and still others specific to the relationship between the firm, the particular pool and the particular patent.
(
1,
2,...,
n)
X
=
f x x
x
(4)In the following econometric analyses, we will in particular test the following characteristics of a firm x with respect to a pool i p regarding a patent j πk:
Insider (x ,i p ,j πk) a dummy variable which is 1 if company x was already member of the pool i
j
p before the input of the patent πk
Ppprior (x ,i p ,j πk) the share of patents in pool p held by company j x before the input of the i
patent πk
Vertical (x ,i p ) a dummy variable which is 1 if company j x is a licensee of pool i p j
Corpsize (x ) i An indicator of the size of company x . i
Portfolio (x ) i The number of patents held by company x . i
We will thus proceed to estimate the following (linear) equation against the database of all patents introduced into existing patent pools:
i j i j i j i i
(x ,p ,
)
(x ,p ,
)
(x ,p )
(x )
(x )
k k k pQ
Insider
Pprior
Vertical
Corpsize
Portfolio
π πα
π
β
π
χ
δ
φ
ϑ
ω
ε
= ×
+ ×
+ ×
+ ×
+ ×
+ ×Ω + ×Ω +
(II) πΩ and Ω are vectors of control variables on characteristics of the patent and the pool. As p
characteristics play any role in determining the acceptation of the patent by the pool, the direction of the relationship between X and Q is necessarily negative. By definition the bargaining power X positively influences the inclusion of a patent in a pool, and thus by assumption it is negatively correlated with the patent’s quality. The results of the regression thus establish whether the particular firm characteristics determine the firm’s bargaining power and if so in what direction.
Results
We successively test this hypothesis on the total number of citations, the number of external cites, the number of claims and the family size of the patent. We run successively Poisson and negative binomial estimates on each indicator. We run these regressions on all patents except patents included at the pool creation (founding patents). Indeed, it is impossible to calculate the explanatory variables (such as the power in the pool at the time of inclusion) for these patents. In order to control for the patents’ characteristics (age, citing year and application year), we use the approach proposed by Mehta, Rysman and Simcoe (2008) based on the assumption that the citation age process begins when a patent is granted. This alternative approach allows to control, in the same regression, for the age, citation year and application year effect of the patent.18
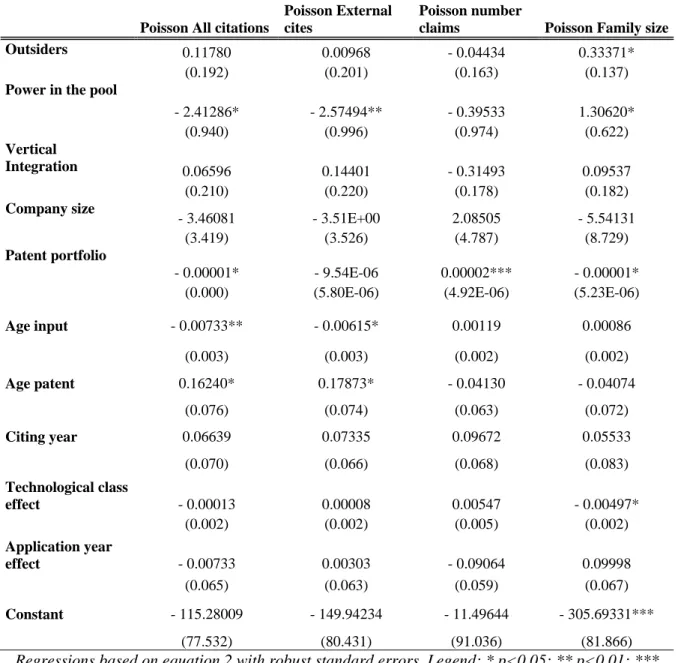
Poisson All citations Negative binomial All citations Poisson External cites Negative binomial External cites Poisson number claims Negative binomial number_claims Poisson Family size Negative binomial Family size Outsiders 0.55548*** 0.50148*** 0.33763* 0.27275* -0.06273 -0.04477 0.08680 0.09170 (0.151) (0.142) (0.143) (0.135) (0.119) (0.113) (0.153) (0.137) Power in the pool 0.23409 0.22076 -0.10469 -0.13383 -0.11783 -0.10840 0.07229 -0.43808 (0.407) (0.427) (0.330) (0.350) (0.422) (0.419) (0.753) (0.694) Vertical Integration 0.25333 0.16040 0.23518 0.20623 -0.10828 -0.03429 0.61273** 0.42915* (0.157) (0.158) (0.146) (0.140) (0.141) (0.156) (0.237) (0.189) Company size -20.7131*** -20.17550** -18.00160** -16.187506* -4.97980 -5.27282 8.01548 -4.46581 (5.529) (6.421) (5.587) (6.535) (6.413) (6.555) (12.981) (9.189) Patent portfolio - 0.00001 - 0.00001 - 0.00001 - 0.00001 0.000015*** 0.000014*** - 0.00003* -0.00002** (0.001) (0.001) (0.001) (0.001) (3.56E-06) (3.77E-06) (0.001) (6.74E-06)
Age input - 0.00491* -0.00341 -0.00343 -0.00142 -0.00232 -0.00262 -0.00743 -0.00484
(0.002) (0.002) (0.002) (0.002) (0.002) (0.002) (0.005) (0.003)
Age patent 0.08321 0.09037 0.08353 0.09808 -0.04084 -0.03368 -0.09313 -0.08426
18
For a discussion of this hypothesis, see : Mehta, Rysman, Simcoe, «Identifying the age profile of patent citations», Journal of Applied Econometrics
(0.075) (0.081) (0.069) (0.072) (0.057) (0.056) (0.247) (0.150) Citing year 0.15731* 0.22227** 0.16497** 0.23781*** 0.09392 0.10637 0.23750 0.16115 (0.067) (0.079) (0.060) (0.069) (0.057) (0.063) (0.214) (0.139) Technological class effect -0.00048 -0.00099 -0.00071 -0.00129* -0.00002 -0.00021 -0.00093 -0.00070 (0.001) (0.001) (0.001) (0.001) (0.001) (0.001) (0.001) (0.001) Application year effect -0.09178 - 0.12960* -0.08273 - 0.11181* -0.09342 -0.09687* 0.04363 0.04928 (0.059) (0.064) (0.054) (0.056) (0.051) (0.049) (0.224) (0.137) Constant -129.0434* -183.27743* -162.0797** -249.6022** 1.55497 -16.49392 -558.9418** -417.439*** (61.376) (89.008) (59.258) (81.858) (66.292) (72.297) (179.705) (90.085)
Regressions based on equation 2 with robust standard errors. Legend: * p<0.05; ** p<0.01; *** p<0.001. Pool dummy control variables not reported.
Table 2 : Equation 2 results
Table 3 highlights two important and interesting results. First of all, patents broughts by outsiders are of better quality. This result is verified for each indicator based on the patent number of citations. But this result could have three different complementary effects. The first one is that outsiders tend to present first patents of better quality to maximize their chances of joining the pool. The other one is that insiders have power over the decision to insert or not a patent and can therefore introduce patents of lower quality. The last one is that insiders benefit from an asymmetry of information enabling them to include patents more easily. It is difficult to isolate the effect of each of these explanations on the overall result but we can emphasize that patents included by outsiders are of better quality than patents included by insiders.
V.
How do firm characteristics matter?
Hypotheses
There remains an important issue to clarify. The fact that we find firm characteristics to be correlated with patent quality could be explained by two different sets of arguments. As to a first theory, some firms are able to introduce patents of lower value to the pool because they have better bargaining powerΨ( )X . These firms can induce a pool to accept a patent that it would have rejected if it was submitted by a firm with lower bargaining power:
( ( ), )
In particular the better ability of insiders to introduce low-value patents could be explained by bargaining power. Patent pool administrators and patent evaluators are paid by pool members. It is reasonable to argue that they maximize the welfare of the pool members. Patents presented by outsiders are thus only accepted if the value they add to the pool more than compensates pool members for the decrease of their share in pool income. Patents introduced by pool members modify shares of individual pool members, but do not reduce the joint shares of all members. Patents submitted by insiders should thus be accepted as soon as they add some value to the pool. On a different stance, pool administrators could have a further incentive to reject patents presented by companies that are not yet pool members: accepting such patents means that their holders become pool members. If the pool increases, joint decision making becomes costlier and the risk of non-cooperative strategies increases.
By contrast to pool insiders, vertically integrated firms (patent holders that are also licensees of the same pool) may have weaker bargaining power. Licensees of a pool have an additional incentive to become pool members: being member of the pool allows them to participate at fixing the price of licenses. If vertically integrated firms are members of a pool, they fix a lower royalty rate, in order to reduce their downstream production costs. For the other pool members, this shift away from the income-maximizing royalty rate is an additional cost. They will thus accept patents submitted by their licensees only if the value they add to the pool at least compensates for this cost.
Also more general firm characteristics can play a role. For instance we find that firms with a larger patent portfolio are able to introduce patents of lower value. This finding clearly points to arguments on bargaining power. It can be e.g. due to the fact that firms owning many patents are more attractive technological allies, or that they are more likely to build up a competitive threat to the pool if their patents are rejected. A patent administrator is also more likely to cherish these firms, as they may become necessary for further pool projects.
But there is another explanation that is alternative or complementary to the theory of bargaining power. This second explanation states that the acceptance of the patent by the pool is determined by the patent’s quality and a further patent characteristic which is correlated with firm characteristics. Some firms would thus be more able to introduce patents of low quality into the pool not because they have stronger bargaining power (which would allow them to obtain more easily inclusion of their patent at given patent characteristics), but rather because they have patents that at given quality are better suited for the pool:
( ( , ( )))
I
=
f P Q
Θ
X
(6)We will call this factor the “focus on the standard” of a patent. We use our new indicator to approximate the focus. At given patent quality, patents that are more focused on the standard are more likely to be accepted by the pool. By analogy to (2), we thus obtain:
( )
Q
=
f
Θ
for allπ
I=1 (7) We directly proceed to estimate this equation against the data:( )
k k p
Q
π= ×Θ
α
π
+ ×Ω + ×Ω +
ϑ
πϑ
ε
(III)Results
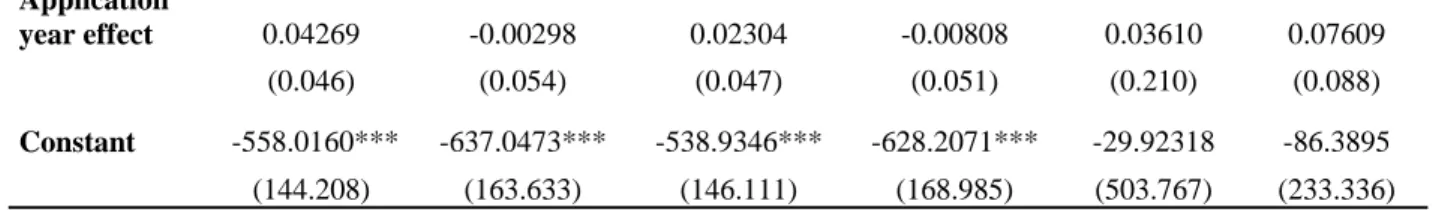
We successively test this hypothesis on the total number of citations (allnscites), the number of external cites and the family size of the patent. We can not use the number of claims as an indicator for this regression because this variable is used to define the variable focus standard. We run successively Poisson and negative binomial estimates on each indicator. In order to control for the patents’ characteristics (age, citing year and application year), we use the approach proposed by Mehta, Rysman and Simcoe (2008) based on the assumption that the citation age process begins when a patent is granted.
Poisson All citations Negative binomial All citations Poisson External cites Negative binomial External cites Poisson Family size Negative binomial Family size Focus standard -0.41215 -0.12382 -0.18651 -0.03298 0.54485 0.86961 (0.386) (0.179) (0.241) (0.139) (0.281) (0.480) Focus standard late -39.67314*** -36.06864*** -41.55403*** -39.20032*** 13.26395* 14.96158*** (2.804) (2.998) (2.806) (2.905) (6.293) (3.433) Age patent 0.21825*** 0.24041*** 0.18384** 0.20649*** -0.12230 -0.06593 (0.055) (0.059) (0.057) (0.0606) (0.219) (0.092) Citing year 0.23673*** 0.32167*** 0.24705*** 0.32260*** -0.01875 -0.03079 (0.056) (0.075) (0.053) (0.072) (0.090) (0.070) Technological class effect - 0.00082 -0.00095 -0.00091 -0.00116* -0.00106 -0.00094 (0.001) (0.001) (0.001) (0.001) (0.001) (0.001)
Application
year effect 0.04269 -0.00298 0.02304 -0.00808 0.03610 0.07609
(0.046) (0.054) (0.047) (0.051) (0.210) (0.088)
Constant -558.0160*** -637.0473*** -538.9346*** -628.2071*** -29.92318 -86.3895
(144.208) (163.633) (146.111) (168.985) (503.767) (233.336)
Regressions based on equation 3 with robust standard errors. Legend: * p<0.05; ** p<0.01; *** p<0.001. Pool dummy control variables not reported.
Table 3 : Equation 3 results
As we can see in table 4, our hypothesis that quality is negatively correlated with the focus standard of the patent and thus that quality and focus standard are substitutes in order to include a patent in the pool is verified. This hypothesis is verified for all indicators based on the number of citations. This result is not verified when we take into account the family size of the patent as an indicator of quality. But, in this case, it is difficult to use the family size as an indicator of quality. Indeed, the family size is linked to the width of the patent and then to the focus standard of the patent.
We next test if the focus of the patent on the standard is function of firm characteristics. This is particularly plausible for characteristics of the firm with respect to the pool. For instance pool members, but also licensees of the pool, could have an information advantage over outsiders that allows them to better adjust their research projects or even the wording of their patent files in order to match the criteria of essentiality. As such adjustment is not necessarily instantaneous, we also use lagged variables and variables on duration.
Precisely, we will estimate the following equation:
( ) ( , , ) _ ( , , )
( , , ) ( , )
k i j k i j k
i j k i j p
Insider x p lag Insider x p
Seniority x p Vertical x p π
π
α
π
β
π
χ
π
δ
ϑ
ω
ε
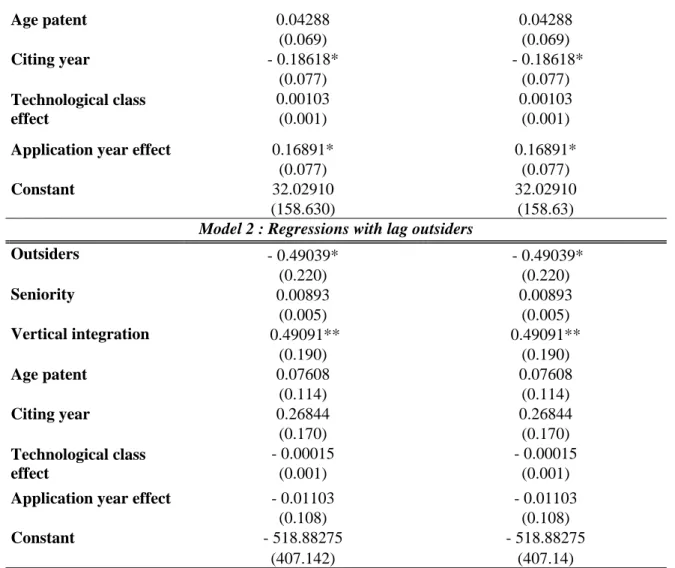
Θ = × + × + × + × + × Ω + × Ω + (IV)Poisson Focus standard
Negative binomial Focus standard
Model 1 : Regressions without lag outsiders
- 0.34761** - 0.34761** Outsiders (0.115) (0.115) 0.00011 0.00011 Seniority (0.003) (0.003) 0.01523 0.01523 Vertical integration (0.301) (0.301)
Age patent 0.04288 0.04288 (0.069) (0.069) Citing year - 0.18618* - 0.18618* (0.077) (0.077) 0.00103 0.00103 Technological class effect (0.001) (0.001)
Application year effect 0.16891* 0.16891*
(0.077) (0.077)
Constant 32.02910 32.02910
(158.630) (158.63) Model 2 : Regressions with lag outsiders
- 0.49039* - 0.49039* Outsiders (0.220) (0.220) 0.00893 0.00893 Seniority (0.005) (0.005) 0.49091** 0.49091** Vertical integration (0.190) (0.190) Age patent 0.07608 0.07608 (0.114) (0.114) Citing year 0.26844 0.26844 (0.170) (0.170) - 0.00015 - 0.00015 Technological class effect (0.001) (0.001)
Application year effect - 0.01103 - 0.01103
(0.108) (0.108) Constant - 518.88275 - 518.88275
(407.142) (407.14)
Regressions based on equation 4 with robust standard errors. Legend: * p<0.05; ** p<0.01; *** p<0.001. Pool dummy control variables not reported.
Table 4 : Equation 4 results
As we can see in table 5, the regression on focus standard brings out two important results confirming the information asymmetry hypothesis. First of all, outsiders (not already member of the pool) include patents less focused on the standard than insiders. This can be explained by the information asymmetry enjoyed by outsiders relative to insiders (they better know expectations and technological boundaries of the pool). This result is reinforced by a positive and significant coefficient for the vertical integration variable meaning that vertically integrated patent holders include patents more focused on the standard than non vertically integrated firms. This seems consistent with our assumption on information asymmetry because vertically integrated firms have better knowledge of the technological scope of the project and therefore also benefit from an information asymmetry compared to non-integrated firms.
Corrolary : Timing of patent application
There have been recently some academic contributions investigating the timing of patent application in the context of patent pools. In a theoretical paper, Dequiedt and Versaevel (2007) apply models of patent races to the case of pool creation. The authors suggest that participation in a pool increases the returns on patents. Potential entrants into pools have to bargain with pool members about the conditions of entry. It is assumed that candidates for entry have no bargaining power respective to the pool members (as is confirmed by the data in our sample).
Founding members of patents pools can thus expropriate from entrants the additional returns on patents due to patent pool participation. From this fundamental hypothesis, Dequiedt and Versaevel derive that there is a strong incentive to be among the founding members of a pool. Consequently, they expect firms to conduct R&D races in the period just before pool creation. The authors expect these races to be reflected in an increase of patent applications in the period preceding pool creation, with a pique of applications just before the launch of the pool. Once the pool is created, patent applications fall immediately to a low level.
This pattern of patent applications has been empirically verified by Lampe and Moser for the case of the sewing machines patent pool from the 19th century. Lampe and Moser nevertheless argue that this strong increase in patent applications does not reflect a culmination in R&D activity, but rather a strong increase in strategic patent applications. Prospective pool members could have patented more in order to strengthen their bargaining power in the pool. Pool outsiders have incentives to patent more in order to protect themselves against the increased risk of patent litigation due to the pooling of litigation resources by pool members. Consistently with the theory of strategic patent files, Lampe and Moser find that innovation slowed rather than speeded up during the period leading to pool formation.
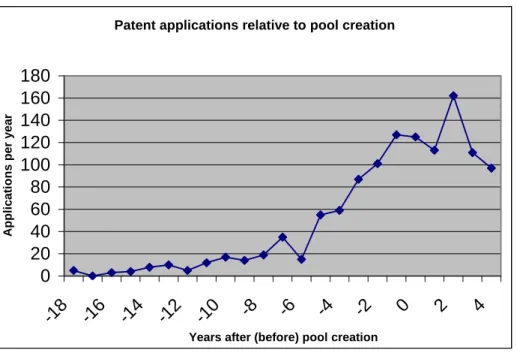
Our own sample allows examining this question with data from different contemporary patent pools. Figure 5 shows the time profile of patent application relative to pool creation for the U.S. patents in our sample. The graph is at odds with the predictions of Versaevel and Dequiedt and the findings of Lampe and Moser, as nearly half of the patents currently in the pools have been filed after pool creation. Patent applications pique several years after pool creation.
Patent applications relative to pool creation 0 20 40 60 80 100 120 140 160 180 -18 -16 -14 -12 -10 -8 -6 -4 -2 0 2 4
Years after (before) pool creation
Ap p li c ati o n s per year
Figure 6 : Timing of patent application
Note that there is a truncation problem for patent applications occurring 3 years or more after pool creation, as the most recent pool creation takes place in 2002, and patent application dates are provided until 2005. This problem biases downwards the number of patent applications on the right-hand side of the chart. For patents filed more than four years after pool creation, this truncation problem concerns several pools. Therefore the chart stops at pool creation plus four years. Due to truncation, the pique of applications may be even later than suggested by the chart.
By contrast to Lampe and Moser, we do not observe that patent applications decrease after the creation of the pool. We would expect a pique in patent applications immediately before pool creation if it was only possible or at least easier to introduce strategic patents at the launch of the pool, and holders of proprietary technology thus hurry to be in possession of numerous patents at the time of pool creation. This might have been the case of the 19th century pool observed by Lampe and Moser, to which no further patents have been added after the year of launch. By contrast, we have shown that in our sample of contemporary pools it is easier for firms to introduce numerous low-value patents once they are pool members. Recall that a big majority of patents introduced into existing pools are brought in by companies that already before held some patents in the pool. It is thus consistent with our general assumptions that we find most patents to be filed once the pool has taken off and firms have ascertained their membership. Nevertheless, our sample of modern patent pools confirms the findings of Lampe and Moser that pools provide incentives for strategic patent files.
Conclusion
Building upon a very comprehensive fact finding work, we are able to provide a first empirical analysis of the dynamics of contemporary patent pools. This analysis provides evidence that pool introduce numerous low-value patents, increasing their share in the royalty revenue. We reveal that most patents are introduced into the pool after the launch of the licensing program. Only a minority of these late-comers are patents owned by outsiders, i.e. by companies that have not been pool members before. The quality of the patents introduced by pool members significantly decreases over time. At any given age of the pool, insiders and powerful R & D companies are able to introduce patents of lower quality than outsiders and firms with small patent portfolios. This advantage is probably due to two complementary factors: insiders know the patent pool better, which allows them to better adjust their patent files; and insiders and powerful R & D firms are strong bargainers.
We think that these facts need to be borne in mind while assessing the welfare effects of specific patent pool projects. The very objective of a patent pool is to reduce transaction costs associated with the patent thicket. In order to fulfill their function, patent pools need to provide incentives that encourage innovation, but discourage rent-seeking strategic patent files. The rules on revenue sharing and on the evaluation of patent essentiality are crucial to that respect, and deserve more attention from policy makers concerned with the competitive effects of patent pool programs.
REFERENCES
• Aoki, R., Nagaoka, S. (2004), “The Consortium Standard and Patent Pools”, The Economic Review, 55(4)
• Carlson, Steven (1999) : Patent Pools and the Antitrust Dilemma, Yale Journal of Regulation,
• Clarkson, Gavin (2004) : Objective Identification of Patent Thickets : A Network Analytical
Approach for Measuring the Density of Patent Space, Ph. D. Thesis Harvard University,
quoted from Lampe and Moser (2009)
• Cournot A.A. (1838), Recherches sur les principes mathématiques de la théorie des richesses
• Delcamp, Henry (2009): Is there are a link between essentiality and patent quality?, Cerna Working Paper
• Dequiedt, V., Versaevel, B. (2007): Patent Pools and the Dynamic Incentives to R&D, Working Paper
• Hall Bronwyn H., Jaffe A., Trajtenberg M. (2005), Market value and patent citations, RAND Journal of Economics, Vol. 36, pp. 16-38
• Harhoff D., Narin F., Scherer F.M., Vopel K. (1999), Citation frequency and the value of
patented inventions, The Review of Economics and Statistics, Vol. 81, pp. 511-515
• Lampe, R., Moser, P. (2009): Do Patent Pools Encourage Innovation? Evidence from the
19th-Century Sewing Machine Industry, Working Paper
• Layne-Farrar, A., Lerner, J. (2008) : To Join or Not to Join : Examining Patent Pool
• Mehta A., Rysman M., Simcoe T. (2009), Identifying the age profile of patent citations:
New estimates of knowledge diffusion, Journal of Applied Econometrics, forthcoming
• Rysman M., Simcoe T. (2008), Patents and the Performance of Voluntary Standard Setting
Organizations, Management Science, Vol. 54, N 11, pp. 1920-1934
• Shapiro, C. (2001), Navigating the Patent Thicket: Cross Licenses, Patent Pools, and
Standard-Setting, Innovation Policy and the Economy (Vol. I), pp. 119–150, MIT Press
• Lerner J., Tirole J. (2004), Efficient Patent Pools, American Economic Review, Vol. 94, pp. 691-711
• Willard K. Tom, Licensing and Antitrust: Common Goals and Uncommon Problems, Address before the American Conference Institute, October 12, 1998
Annex 1 : Summary statistics
Variable Description Mean Std.
Deviation
Min Max
Variables regarding patent
Appyear Year patent applied for 1998.226 3.959 1981 2006
Gyear Year patent granted 2000.418 4.021 1983 2006
Nclass U.S. patent technology class (3 digit)
394.358 82.491 84 725
Allnscites Total cites flow (truncation corrected) from other companies
17.916 29.404 0 251.334 Genindex Generality of the patent (NBER U.S.
database)
0.33062 0.366 0 1
Claims Number of claims for the patent 4.939 9.606 1 99
Family_size Family size for the patent calculated from espacenet
30.371 83.237 1 700
External_cites Cites received from patent not in the pool
20.5383 30.02179 0 270.467
Internal_cites Cites received from patent not in the pool
2.567 6.579 0 88 Year_
disclosure_SSO
Disclosure year of the patent in the SSO
1998.821 3.601 1993 2007
Variables regarding the timing Age_input Age of the input calculated from the
pool creation date (in months)
40.261 29.522 0 139
Age_at_input Patent age at the input date (in years)
5.441 2.919 0.199 19.25
Number_input Chronological number of input into this pool
2.690 2.268 0 11 Age_at_creatio
n
Age of the patent at the pool creation date (in years)
4.431 3.696 - 3.90 20.5
Late Age_input * Age_at_input (Late
introduction of patent that previously exist)
214.254 229.972 0 2318.98
6 New_late Late * dummy_new_entrant (patent
introduced late by company that were not previously member of the pool)
43.940 146.864 0 1550.39
Old_late Late * dummy_old_entrant (patent introduced late by company that were reviously member of the pool)
Variables regarding firms Ppprior Number of patents previously in the
pool held by the firm
(Number of patents previously held by the firm in the pool / Number of patents previously in the pool)
0.136 0.141 0 0.7
Corpsize Size of the company (based on ranking in Fortune 500 and Global2000 index)
0.001 0.002 0.001 .042
Patent_portfolio Size of the company patent portfolio (2009 U.S. patent application * number of patents espacenet)
10637.84 13956.52 0 50932
Variables regarding the patent essentiality Sections Number of standard sections for
which the patent is cited
4.236 2.913 1 24
Subsections Number of standard subsections for which the patent is cited
13.884 10.839 1 88
Sections corrected
Number of standard sections for which the patent is cited / median number of standard sections
1.411 0.945 .25 8.73333
4 Subsections
corrected
Number of standard subsections for which the patent is cited / median number of standard subsections
1.411 0.945 .25 8.73333
4 Focus_standard Number of claims / Number of
sections corrected 3.523 3.140 .02127 66 24
Distribution of focus_standard
0 50 100 150 200 250 300 350 0 0,3 0,6 0,9 1,2 1,5 1,8 2,1 2,4 2,7 3 3,3 3,6 3,9Decimal interval of the value of the variable