HAL Id: hal-01339003
https://hal.sorbonne-universite.fr/hal-01339003
Submitted on 29 Jun 2016
HAL is a multi-disciplinary open access
archive for the deposit and dissemination of
sci-entific research documents, whether they are
pub-lished or not. The documents may come from
teaching and research institutions in France or
abroad, or from public or private research centers.
L’archive ouverte pluridisciplinaire HAL, est
destinée au dépôt et à la diffusion de documents
scientifiques de niveau recherche, publiés ou non,
émanant des établissements d’enseignement et de
recherche français ou étrangers, des laboratoires
publics ou privés.
Europe in April 2011: a model intercomparison
N Huneeus, S Basart, S Fiedler, J.-J Morcrette, A Benedetti, J Mulcahy, E
Terradellas, C. Pérez Garcia-Pando, G. Pejanovic, S. Nickovic, et al.
To cite this version:
N Huneeus, S Basart, S Fiedler, J.-J Morcrette, A Benedetti, et al.. Forecasting the northern African
dust outbreak towards Europe in April 2011: a model intercomparison. Atmospheric Chemistry and
Physics, European Geosciences Union, 2016, 16 (8), pp.4967-4986. �10.5194/acp-16-4967-2016�.
�hal-01339003�
www.atmos-chem-phys.net/16/4967/2016/ doi:10.5194/acp-16-4967-2016
© Author(s) 2016. CC Attribution 3.0 License.
Forecasting the northern African dust outbreak towards Europe in
April 2011: a model intercomparison
N. Huneeus1,2, S. Basart3, S. Fiedler4,5,a, J.-J. Morcrette6, A. Benedetti6, J. Mulcahy7, E. Terradellas8, C. Pérez García-Pando9,10, G. Pejanovic11, S. Nickovic11,12, P. Arsenovic11,13, M. Schulz14, E. Cuevas15, J. M. Baldasano3,16, J. Pey12,17, S. Remy6,b, and B. Cvetkovic11
1Laboratoire de Météorologie Dynamique, IPSL, CNRS/UPMC, Paris, France
2Department of Geophysics and Center for Climate and Resilience Research, University of Chile, Santiago, Chile 3Earth Sciences Department, Barcelona Supercomputing Center, BSC-CNS, Barcelona, Spain
4School of Earth and Environment, University of Leeds, Leeds, UK
5Institute of Meteorology and Climate Research, Karlsruhe Institute of Technology, Karlsruhe, Germany 6European Centre for Medium-Range Weather Forecasts, Reading, UK
7Met Office, FitzRoy Road, Exeter, EX1 3PB, UK
8Meteorological State Agency of Spain (AEMET), Barcelona, Spain 9NASA Goddard Institute for Space Studies, New York, USA
10Department of Applied Physics and Applied Math, Columbia University, New York, USA 11National Hydrometeorological Service, Belgrade, Serbia
12Institute of Environmental Assessment and Water Research, Spanish Research Council, Barcelona, Spain 13Institute for Atmospheric and Climate Science, ETH, Zürich, Switzerland
14Norwegian Meteorological Institute, Oslo, Norway
15Izaña Atmospheric Research Center, State Meteorological Agency of Spain (AEMET), Santa Cruz de Tenerife, Spain 16Environmental Modelling Laboratory, Technical University of Catalonia, Barcelona, Spain
17Geological Survey of Spain (IGME), Zaragoza, Spain
anow at: Max Planck Institute for Meteorology, Hamburg, Germany
bnow at: Laboratoire de Météorologie Dynamique, IPSL, CNRS/UPMC, Paris, France
Correspondence to: N. Huneeus ([email protected])
Received: 4 August 2015 – Published in Atmos. Chem. Phys. Discuss.: 1 October 2015 Revised: 11 March 2016 – Accepted: 11 March 2016 – Published: 21 April 2016
Abstract. In the framework of the World Meteorological Or-ganisation’s Sand and Dust Storm Warning Advisory and Assessment System, we evaluated the predictions of five state-of-the-art dust forecast models during an intense Saha-ran dust outbreak affecting western and northern Europe in April 2011. We assessed the capacity of the models to pre-dict the evolution of the dust cloud with lead times of up to 72 h using observations of aerosol optical depth (AOD) from the AErosol RObotic NETwork (AERONET) and the Moderate Resolution Imaging Spectroradiometer (MODIS) and dust surface concentrations from a ground-based mea-surement network. In addition, the predicted vertical dust distribution was evaluated with vertical extinction profiles
from the Cloud and Aerosol Lidar with Orthogonal Polar-ization (CALIOP). To assess the diversity in forecast capa-bility among the models, the analysis was extended to wind field (both surface and profile), synoptic conditions, emis-sions and deposition fluxes. Models predict the onset and evolution of the AOD for all analysed lead times. On aver-age, differences among the models are larger than differences among lead times for each individual model. In spite of large differences in emission and deposition, the models present comparable skill for AOD. In general, models are better in predicting AOD than near-surface dust concentration over the Iberian Peninsula. Models tend to underestimate the long-range transport towards northern Europe. Our analysis
sug-gests that this is partly due to difficulties in simulating the vertical distribution dust and horizontal wind. Differences in the size distribution and wet scavenging efficiency may also account for model diversity in long-range transport.
1 Introduction
Desert dust, the largest contributor to the global aerosol bur-den after sea salt (Textor et al., 2006; Huneeus et al., 2013), plays an important role in the climate system, the chemi-cal composition of the atmosphere (see, e.g., Sokolik et al., 2001; Tegen, 2003; Balkanski et al., 2007; Bauer and Koch, 2005) and the ocean biogeochemical cycles (Jickells et al., 2005; Aumont et al., 2008, Mahowald et al., 2009; Schulz et al., 2012; Gallisai et al., 2014). Besides their climate effect, dust aerosols degrade air quality over large regions of the globe (see, e.g., Kim et al., 2001; Ozer et al., 2007; Querol et al., 2009; Pey et al., 2013) and often disproportionately reduce visibility close to source regions, impacting trans-portation (road vehicles and airports), military operations and photovoltaic energy production (see, e.g., Schroedter-Homscheidt et al., 2013). Some evidence exists for increased mortality when dust aerosols are present in particulate mat-ter with a radius smaller than 10 µm (PM10) (Jiménez et al.,
2010; Karanasiou et al., 2012), and dust storms have been as-sociated with epidemics of meningococcal meningitis in the African Sahel (Agier et al., 2013; Pérez García-Pando et al., 2014a, b).
The wide variety of impacts along with the importance of dust for weather forecasting (Pérez et al., 2006a) have mo-tivated the development of operational forecasting capabil-ities to predict the occurrence of dust storms (Benedetti et al., 2014). Moreover, the European Union directives establish that model results can be used to determine whether PM10
exceedances are caused by advection of dust or by local pol-lution. Considering the financial implications of this, there is motivation for atmospheric composition forecast models to improve their performance related to dust. At present, a num-ber of global and regional dust forecast systems are available (e.g. Woodward, 2001; Morcrette et al., 2008, 2009; Pérez et al., 2011; Basart et al., 2012; Zhou et al., 2008; Vogel et al., 2009). An important limitation for the advancement of operational dust storm forecasts is the lack of standardized evaluation processes, suitable observations and a poorly de-veloped verification system compared to numerical weather prediction (NWP). While NWP benefits from advanced near-real-time observations systems and well-established proto-cols for the evaluation of forecast products, similar proce-dures for aerosol forecasting are at their beginning (Reid et al., 2011).
Recently two international programs for model intercom-parison and observation of dust storms emerged: the Sand and Dust Storm Warning Advisory and Assessment
Sys-tem (SDS-WAS) led by the World Meteorological Orga-nization (WMO, http://www.wmo.int/sdswas) and the In-ternational Cooperative for Aerosol Prediction (ICAP) ini-tiative (http://icap.atmos.und.edu/). The SDS-WAS seeks to achieve a comprehensive, coordinated and sustained observa-tions and modelling capacity for sand and dust storms (Ter-radellas et al., 2013). The overall aims are to monitor these events, increase the understanding of the dust processes and enhance the dust prediction capabilities. SDS-WAS is or-ganized around two regional nodes, managed by Regional Centres (RCs), namely the northern Africa–Middle East– Europe Regional Centre (NAMEE) hosted by Spain (http: //sds-was.aemet.es/) and the Asian Regional Centre hosted by China (http://www.sds.cma.gov.cn/). Each one of these nodes focuses on sand and dust storms within their region of action. More recently the ICAP (http://icap.atmos.und.edu/) was started. This international forum involves multiple cen-tres delivering global aerosol forecast products and seeks to respond to specific needs related to global aerosol forecast evaluation (Benedetti et al., 2011). In contrast to SDS-WAS, this cooperative does not focus exclusively on dust but in-vestigates forecast capabilities of all aerosol species on the global scale. Dust prediction is, however, an important com-ponent of the aerosol prediction activities.
Multiple studies have evaluated the model performance in simulating a given dust event (e.g. Pérez et al., 2006b; Heinold et al., 2007; Guerrero-Rascado et al., 2009; Kalen-derski et al., 2013), yet only a few have analysed in detail the model capabilities to predict them up to a few days ahead. Alpert et al. (2002) use the aerosol index (AI) of the Total Ozone Mapping Spectrometer (TOMS) to initialize a dust prediction system over Israel developed in the framework of the Mediterranean–Israeli Dust Experiment (MEIDEX). Zhou et al. (2008) evaluate an operational sand and dust storm forecasting system (CUACE/Dust – Chinese Unified Atmospheric Chemistry Environment – Dust) for east Asia, while Shao et al. (2003) present a real-time prediction system of dust storms in northeast Asia. These forecasts successfully predict the temporal and spatial evolution of the dust plume, but little effort has been made to systematically examine the predictability of dust transport from northern Africa to Eu-rope.
The present work is done within the framework of the SDS-WAS NAMEE node. This RC gathers and coordinates the exchange of forecasts produced by different dust models and conducts regular model intercomparison and evaluation within its geographical scope. We examine the performance of five state-of-the-art dust forecast models in predicting the intense Saharan dust outbreak transporting dust over western Europe to Scandinavia between 5 and 11 April 2011. Study-ing a sStudy-ingle dust event allows us to investigate the model skill in predicting the approach of a dust event with a high tempo-ral resolution of a few hours. Each model is compared to a set of observations, namely dust surface concentration, extinc-tion profiles, aerosol optical depth (AOD) at 550 nm, wind at
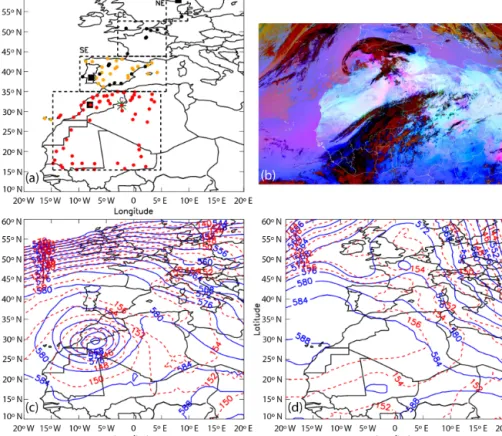
Figure 1. Panel (a): AERONET (orange), surface concentration (black), surface wind (green) and radio sounding (brown) stations used in this study are presented. Southern, central and northern European (SE, CE and NE, respectively, as the dashed black squares) regions used in the statistical analysis are illustrated, as well as the region used to produce the emission time series in Fig. 5. Panel (b): the MSG/RGB (Meteosat Second Generation/Red Green Blue) dust product of the Spinning Enhanced Visible and Infrared Imager (SEVIRI) shows the cloud band of the cyclone (red) and dust aerosol (pink) of the dust event over northwest Africa on 5 April 2011 at 12:00 UTC. Panel (c): geopotential height at 500 hPa (blue lines); panel (d): geopotential height at 850 hPa (red lines) for 5 and 10 April 2011 and wind field at 850 hPa.
10 m above ground level (a.g.l.) and profiles of the horizontal wind. This comprehensive intercomparison of the models re-veals strengths and weaknesses of individual dust forecasting systems and provides an assessment of uncertainties in simu-lating the atmospheric dust cycle at high temporal resolution. The paper is structured as follows. In Sect. 2 the observa-tional data used for the evaluation and the models considered in this work are introduced. In Sect. 3 we describe the in-tense dust event selected for this study. Results are shown in Sect. 4, and their discussion is provided in Sect. 5. Our con-clusions are given in Sect. 6.
2 Data and models
The model evaluation focuses on the days of the event, i.e. from 5 to 11 April, and uses data over the northern African source region and Europe. Figure 1 shows the region of study along with the locations of the observation stations used. The models are evaluated against aerosol optical depth (AOD), vertical profiles of aerosol backscatter and extinction
coef-ficient (Sect. 2.1), dust surface concentrations (Sect. 2.2), wind speed, and other meteorological variables relevant for the event (Sect. 2.3). We conduct a statistical analysis, based on 3-hourly data whenever possible and daily data otherwise, and we analyse the models’ performance in predicting the event with lead times of 24, 48 and 72 h. A brief description of each of these data sets follows, together with a general description of the models used in this work (Sect. 2.4). 2.1 Aerosol remote sensing
We used AOD observations at 550 nm from 21 Sun pho-tometers operating within the AErosol RObotic NETwork (AERONET; Holben et al., 1998); AERONET locations are depicted in Fig. 1. We use quality-assured direct-sun data (Level 2.0) between 440 and 870 nm, which contain an un-certainty on the order of 0.01 for AOD under cloud-free con-ditions.
Quantitative evaluations of the modelled dust AOD are conducted for dust-dominated conditions, i.e when the Angström exponent (AE) is less or equal to 0.75 (Basart
et al., 2009). All data with AE larger than 1.2 are associ-ated with fine anthropogenic aerosols and are considered free of dust. Values of AE between 0.75 and 1.2 are associated with mixed aerosols and are not included in the analysis. The AOD at 550 nm is derived from data between 440 and 870 nm, following Ångström’s law. Because AERONET data are acquired at 15 min intervals on average, all measurements within ±90 min of the models’ outputs are used for the 3-hourly evaluation.
In addition to ground-based observation, we qualitatively compare the modelled dust AOD to satellite-retrieved aerosol distribution from the Moderate Resolution Imaging Spectro-radiometer (MODIS) on board the Aqua satellite. We use daily data from the MODIS Level 3 aerosol products from collection 5.1 at 1◦×1◦horizontal resolution. The MODIS algorithm over land produces data only for low ground re-flectance (i.e. over dark surfaces) leaving dust aerosol over bright deserts undetected (Remer et al., 2005). To evalu-ate the models over deserts, we combine the data with the MODIS Aqua Deep Blue product, which provides informa-tion over arid and semi-arid areas by employing radiances from the blue channels to enhance the spectral contrast be-tween surface and dust (Hsu et al., 2004, 2006).
In order to examine the predicted vertical profile of dust aerosol, data from the Cloud and Aerosol Lidar with Or-thogonal Polarization (CALIOP) sensor on board the Cloud-Aerosol Lidar and Infrared Pathfinder Satellite Observa-tions (CALIPSO) satellite is used. CALIOP is a standard dual-wavelength (532 and 106 nm) backscatter lidar operat-ing at a polarization channel of 532 nm. It measures high-resolution (1/3 km in the horizontal direction and 30 m in the vertical direction) profiles of the attenuated backscat-ter of aerosols and clouds at 532 and 1064 nm along with polarized backscatter in the visible channel (Winker et al., 2009). We use here the version 3.01 of the Level 2 aerosol backscatter and extinction product at 532 nm (i.e. CAL_LID_L2_05kmAPro-Prov-V3-30). This product has a horizontal resolution of 5 km and a vertical resolution of 60 m in the tropospheric region up to 20 km and a resolution of 180 m above that. We focus on 5 and 7 April. The model profiles are derived applying a bilinear interpolation to the four closest model grid points to the CALIOP overpass. We also applied a linear temporal interpolation between the two closest 3-hourly outputs to the time of the CALIOP observa-tion.
2.2 Dust surface concentration
We also compare the forecasts to daily surface African dust concentration of PM10for a number of southern European
re-gional background (RB) environments. Pey et al. (2013) cre-ated a database with daily desert dust PM10 concentrations
from 2001 to 2011. We use here 24 stations of this data set (Fig. 1). Daily contributions of African dust to PM10 were
obtained by subtracting the daily RB level from the PM10
concentration of the day of the event (Escudero et al., 2007). The RB concentration is derived from the application of the monthly moving 40th percentile to the PM10time series after
a prior extraction of the days with African dust. 2.3 Wind data
National Meteorological Services operate networks of manned and automated weather stations that regularly re-port atmospheric conditions following WMO standards. In particular, surface stations report synoptic observations ev-ery 3 or 6 h through the WMO’s Global Telecommunications System. These observations, in combination with upper-air soundings, satellites and other remote-sensing products, are the basis for deriving the initialization fields for NWP mod-els. We use wind speed and direction at 10 m above ground from 60 stations within the study region and the vertical pro-files of horizontal wind from radiosondes launched daily at 12:00 UTC at Béchar (2.25◦W, 31.5◦N) in Algeria (Fig. 1). 2.4 Models
The present study uses three regional and two global mod-els that are run in operational forecasting mode at differ-ent cdiffer-entres for weather prediction in Europe. The three re-gional models are BSC-DREAM8b (Dust Rere-gional Atmo-spheric Modelling) and NMMB (Non-hydrostatic Multiscale Model B-grid)/BSC-Dust from the Earth Sciences Depart-ment at the Barcelona Supercomputing Center (ES-BSC) and the DREAM8-NMME (Non-hydrostatic Multiscale Model E-grid) from the Southeast European Virtual Climate Change Center (SEEVCC) hosted by the Republic Hydrometeoro-logical Service of Serbia. The global models are MetUMTM developed by the UK Met Office and ECMWF/MACC (Monitoring Atmospheric Composition & Climate) from the European Centre for Medium-Range Weather Forecasts (ECMWF). We evaluated forecasts initialized at 00:00 UTC with forecast lead times of 24, 48 and 72 h using model 3-hourly output fields. The research teams at the modelling centres configured their model experiments independently and did not necessarily follow the setup of their respective daily operational forecast. We clarify that although the mod-elling systems of SEEVCC and ECMWF include the assim-ilation of AOD, the simulations conducted by these centres for this study did not include this feature. The spatial resolu-tion, domain size, and initial and boundary conditions differ, in addition to the different physical parameterizations imple-mented in the models. Details on the individual dust forecast-ing systems and the model configurations evaluated here are summarized in Table 1. All models provide 3-hourly instan-taneous emission fluxes.
In addition to these five models, we use the Modern-Era Retrospective Analysis for Research and Application (MERRA) from the National Aeronautics and Space Ad-ministration (NASA; Rienecker et al., 2011) to evaluate the
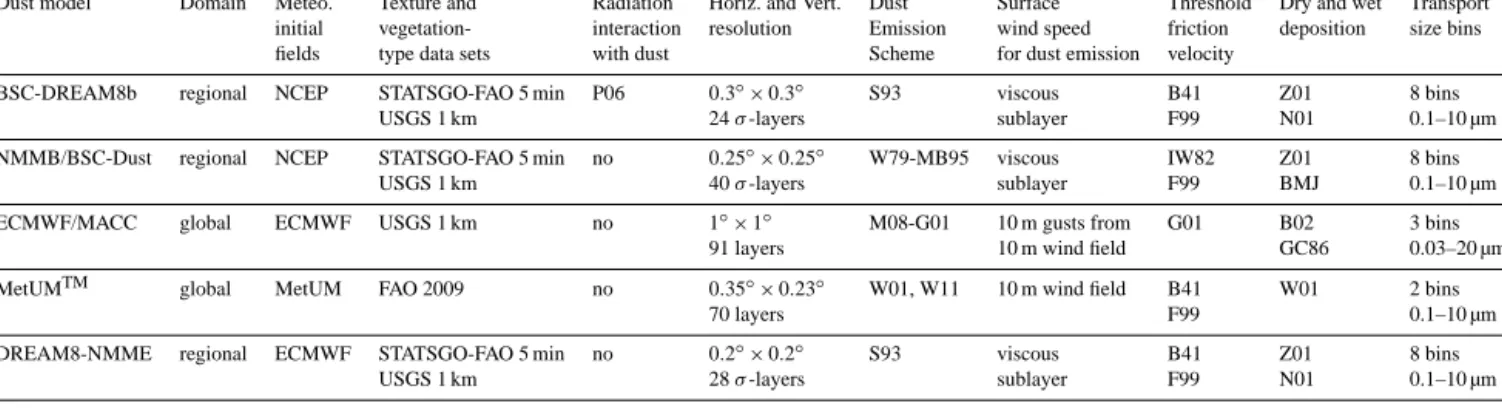
Table 1. Summary of the main features of each model included in the present contribution.
Dust model Domain Meteo. Texture and Radiation Horiz. and Vert. Dust Surface Threshold Dry and wet Transport initial vegetation- interaction resolution Emission wind speed friction deposition size bins fields type data sets with dust Scheme for dust emission velocity
BSC-DREAM8b regional NCEP STATSGO-FAO 5 min P06 0.3◦×0.3◦ S93 viscous B41 Z01 8 bins USGS 1 km 24 σ -layers sublayer F99 N01 0.1–10 µm NMMB/BSC-Dust regional NCEP STATSGO-FAO 5 min no 0.25◦×0.25◦ W79-MB95 viscous IW82 Z01 8 bins
USGS 1 km 40 σ -layers sublayer F99 BMJ 0.1–10 µm ECMWF/MACC global ECMWF USGS 1 km no 1◦×1◦ M08-G01 10 m gusts from G01 B02 3 bins
91 layers 10 m wind field GC86 0.03–20 µm MetUMTM global MetUM FAO 2009 no 0.35◦×0.23◦ W01, W11 10 m wind field B41 W01 2 bins
70 layers F99 0.1–10 µm
DREAM8-NMME regional ECMWF STATSGO-FAO 5 min no 0.2◦×0.2◦ S93 viscous B41 Z01 8 bins USGS 1 km 28 σ -layers sublayer F99 N01 0.1–10 µm
STATSGO: State Soil Geographic database. The codes denote the following references. B02: Boucher et al. (2002); BMJ: Betts (1986), Betts and Miller (1986) and Janjic (1994); B41: Bagnold (1941); F99: Fécan et al. (1999); G01: Ginoux et al. (2001); GC86: Giorgi and Chameides (1986); IW82: Iversen and White (1982); M08: Morcrette et al. (2008); MB95: Marticorena and Bergametti (1995); S93: adapted Shao et al. (1993), P06: Pérez et al. (2006a); W79: White (1979); Z01: Zhang et al. (2001); N01: Nickovic et al. (2001); W01: Woodward (2001); W11: Woodward (2011).
model performance in reproducing the synoptic-scale con-ditions of the event. Near-surface winds from MERRA are shown for completeness. A discussion of the limitations of winds from reanalysis can be found elsewhere (e.g. in Menut, 2008; Fiedler et al., 2013, 2015; Largeron et al., 2015).
3 Dust event
The African dust outbreak affected Europe between 5 and 11 April 2011. On 4 April, an upper level trough approached northwest Africa from the west. Advection of positive vor-ticity and the flow interaction with the Atlas Mountains favoured cyclogenesis in the mountain lee (not shown). On 5 April, the cyclone had deepened over the southern Moroccan–Algerian border, causing strong winds of more than 20 m s−1at 850 hPa. The associated near-surface winds produced dust mobilization over Algeria (Fig. 1).
The emitted dust aerosol was subsequently transported northwards and reached the Iberian Peninsula following the cyclonic flow (not shown). On 6 and 7 April, a ridge of high pressure over France and a cyclone west of the Azores Islands caused southeasterly winds of up to 17 m s−1 at 850 hPa to the west of the Iberian Peninsula, which ad-vected the dust plume towards the Atlantic Ocean. High pressure built and strengthened over the Iberian Peninsula and northwest Africa between the 8 and 9 April. The result-ing southerly winds over the Atlantic transported the dust-laden air towards Great Britain. A ridge over western Europe with strong southwesterly winds over Great Britain, which advected the more diffused dust cloud towards Scandinavia (Fig. 1b), characterized 10 and 11 April.
4 Results
4.1 Dust transport: AOD and PM10
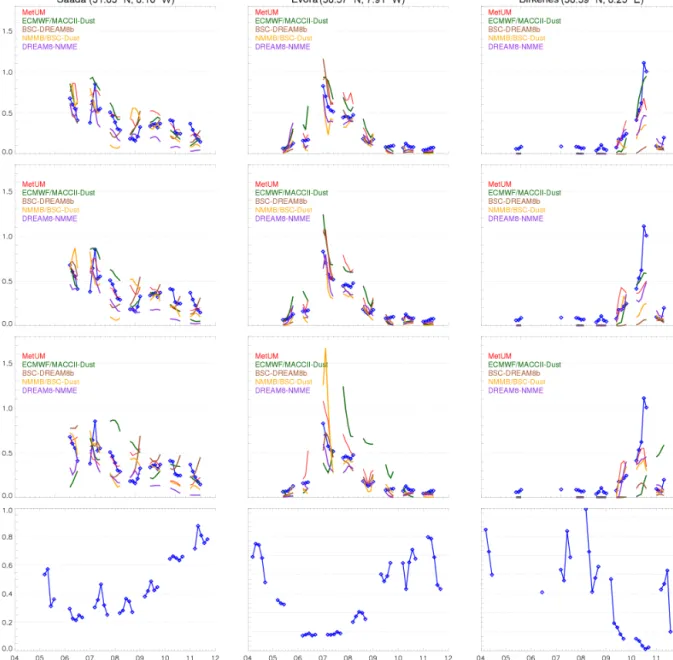
The northward transport of dust was examined by compar-ing model AOD forecasts with AERONET measurements at three stations located along the path of the dust cloud (Fig. 2) and daily AOD maps from MODIS (Figs. 3 and S01–S03 in the Supplement). The three AERONET stations are Saada (31.63◦N, 8.16◦W) in Morocco close to the dust source, Evora (38.57◦N, 7.91◦W) in Portugal and Birkenes (58.39◦N, 8.25◦E) in Norway (Fig. 1, black squares). The AOD in Saada peaked on 6 April, and a second and smaller maximum was observed on 9–10 April (Fig. 2). The lat-ter peak corresponds to a dust plume that did not affect the Iberian Peninsula and is therefore omitted from our discus-sion. The time series in Evora and Birkenes feature sharp AOD increases during the passage of the dust cloud (Fig. 2). In Evora, the AOD increased from nearly 0.2 on 5 April to about 0.8 on the next day. In Birkenes, the AOD rose from approximately 0.3 on 9 April to roughly 1.1 on 10 April (the AOD actually doubled on 10 April between the early morn-ing and the late evenmorn-ing). The dominance of the dust in the AOD is evidenced by the strong decrease in AE to values below 0.6.
The 24 h forecasts produced by MetUM, ECMWF/MACC and NMMB/BSC-Dust overestimate the AOD on the 5 April in Saada, and, except for that by ECMWF/MACC, they underestimate the peak on 6 April. While MetUM repro-duces the peak on 6 April, NMMB/BSC-Dust predicts it 6 h earlier, and BSC-DREAM8b and ECMWF/MACC re-produce it 3 h earlier. DREAM8-NMME rere-produces the AERONET AOD on 5 April but underestimates it on the following day, whereas ECMWF/MACC mostly overesti-mates the AOD on both days. At Evora, most models overestimate the AOD on 6 April with the exception of NMMB/BSC-Dust and DREAM8-NMME. On 7 April Me-tUM and ECMWF/MACC mostly overestimate the AOD,
Figure 2. Total AOD at 550 nm at three selected sites from the AERONET network (blue line) and 24 (first row), 48 (second row) and 72 h (third row) forecasts of the models MetUM (red), ECMWF/MACC (green), BSC-DREAM8b (brown), NMMB/BSC-Dust (orange) and DREAM8-NMME (purple) are illustrated. The Angström exponent (dark blue dots) from the AERONET network at the three selected sites is included in the forth row. Angström exponents < 0.75 indicate the dominance of desert dust.
while the rest of the models tend to underestimate it. The AOD forecast differs significantly for lead times of 48 and 72 h. For example, while the 24 h ECMWF/MACC forecast overestimates the AOD in Saada on 5 and 6 April, the 72 h forecast mostly underestimates it. Similarly, at Evora, the 24 h forecast of NMMB/BSC-Dust slightly underestimates the AOD on 6 April, whereas the 72 h forecast markedly overestimates it during the same day. At Birkenes, all mod-els underestimate the AOD on the 10 April regardless of the forecast lead time, which reflects the models’ difficul-ties to transport dust in high concentrations northwards.
ECMWF/MACC presents a large spread between the differ-ent forecast times. While it features the best performance for the 24 h forecast, the model skill markedly decreased for the 72 h forecast.
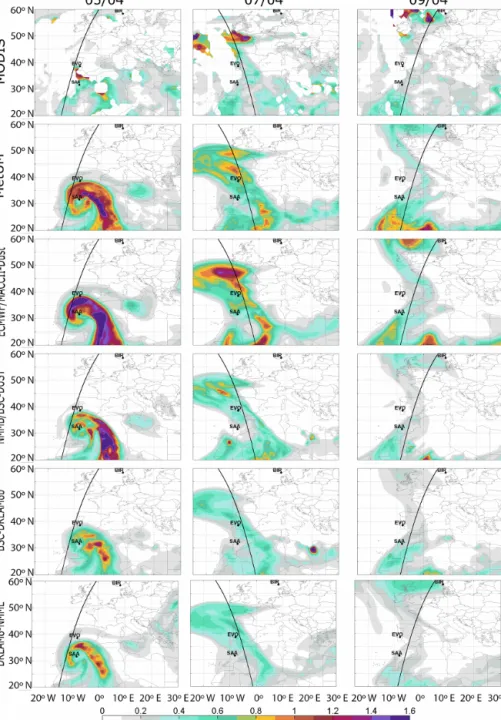
The maps of daily MODIS AOD (Figs. 3 and S01–S03) illustrate the progression of the dust cloud in agreement with the AERONET observations presented above. Note that in order to minimize the potential bias due to tem-poral sampling associated with the satellite passage, the modelled AOD is computed as the average of the fields at 12:00 and 15:00 UTC. The models reproduce the main
trans-Figure 3. Maps of daily total AOD at 550 nm from MODIS (first row) and corresponding 24 h forecasts of models MetUM (second row), ECMWF/MACC (third row), NMMB/BSC-DUST (fourth row), BSC-DREAM8b (fifth row) and DREAM8-NMME (sixth row) for 5 April (first column), 7 April (second column) and 9 April (third column) 2011. Corresponding maps for all days between 4 and 11 April are given in Fig. S01, and 48 and 72 h forecast maps are provided in Figs. S02 and S03. The three AERONET sites shown in Fig. 2 (black dots) and the CALIPSO orbits (black lines) are also shown. The simulated AOD is computed as the average of the fields at 12:00 and 15:00 UTC.
port features but differ in the magnitude of the simulated AOD. While MetUM, ECMWF/MACC and NMMB/BSC-Dust overestimate the magnitude of the AOD suggested by the observations for the first day, the BSC-DREAM8b and DREAM8-NMME underestimate them roughly by a factor of 3 throughout the entire period. For all models the differ-ence in AOD compared to MODIS increases daily. While
MODIS attributes AODs above 1 to the dust cloud un-til 9 April, the models generally simulate AODs below 1 from the 6 April onwards. BSC-DREAM8b and DREAM8-NMME forecast lower AODs than observed in northern Eu-rope from the 9 April onward. Similar results are found for each model regardless of the forecast lead times, both in
terms of spatial features and magnitude of simulated AOD (Figs. S02 and S03).
We used the root mean square error (RMSE), mean bias and Pearson correlation coefficient (R) to assess the skill of each model to predict the AERONET AOD and PM10
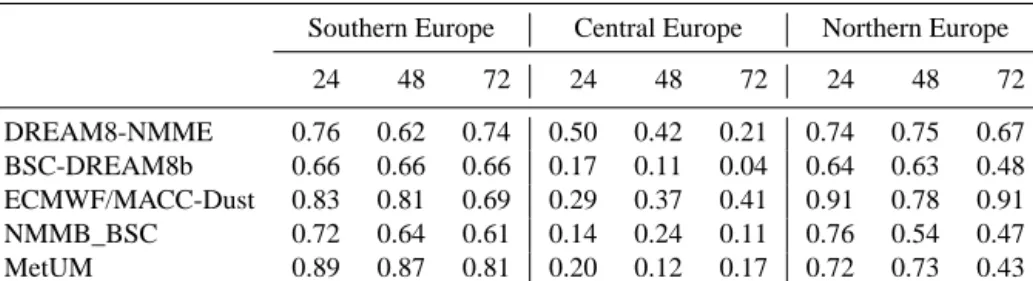
(Ta-bles 2–6). To explore the performance along the path of the dust cloud, the different AERONET stations were grouped into southern, central and northern Europe (SE, CE and NE, respectively) as indicated in Fig. 1. The models present a similar performance between the different lead times for all regions and all skill scores (Tables 2–4). Overall, the largest differences in scores among the models are obtained in NE, underlining the growing model spread away from dust sources. However, the scores do not necessarily deteriorate with increasing distance from the source. Although in most cases the models present better statistics in SE, some have better statistics in NE (e.g ECMWF/MACC). In addition, the models present the best RMSE and mean bias in CE. Al-though MetUM has the best AOD performance in SE in terms of all three statistics, there is no model that outperforms the other ones in all regions and for all forecast lead times.
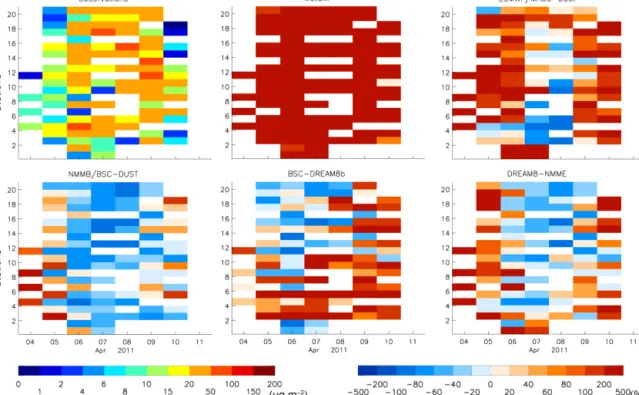
We now examine the model performance in reproducing near-surface dust concentrations. Most stations in the Iberian Peninsula recorded elevated surface dust concentrations from 6 to 9 April with values between 10 and 100 µg m−3(Figs. 4 and S04). MetUM strongly overestimates the observations of near-surface concentration for all days and all stations. ECMWF/MACC overestimates the surface concentrations but captures the variability between 6 and 9 April better, in-dicating a more realistic development of the dust cloud over Europe. BSC-DREAM8b overestimates the concentrations at southern stations for all days, while an underestimation is found at northern sites during the first half of the event. Finally, NMMB/BSC-Dust and DREAM8-NMME generally tend to underestimate the observed concentrations between 6 and 9 April. The 48 and 72 h forecasts, although different from the 24 h forecast, show equivalent features to the 24 h forecast in reproducing the observed surface concentration as described above (Figs. S05 and S06).
The near-surface concentration over the Iberian Peninsula is a critical measure for the dust outbreak and is summa-rized in Table 5. Overall, the models show a similar perfor-mance in near-surface concentration of dust aerosols regard-less of the forecast lead times. MetUM presents the largest RMSE and mean bias among the models for all lead times while DREAM8-NMME presents the smallest bias but also the smallest correlation and NMMB/BSC-Dust features the largest correlation.
4.2 Dust emissions
The atmospheric transport of dust aerosol depends, among other factors, on the amount, time and place of dust emis-sion. In order to provide possible reasons of model differ-ences identified in the previous sections, the spatial and
tem-poral variability of dust emissions from each model at differ-ent forecast lead times between 4 and 7 April is compared here.
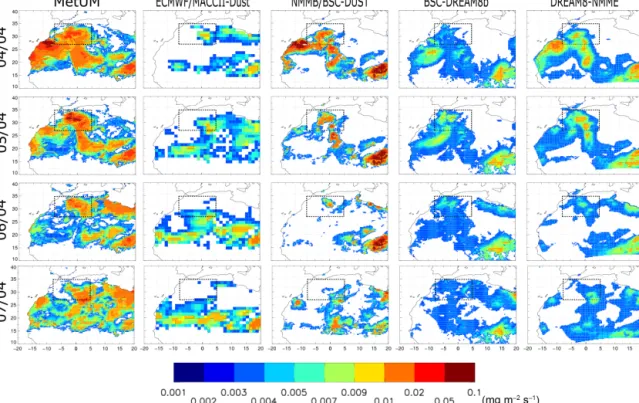
The models present large diversity in both magnitude and spatial distribution of the daily dust emissions within the ac-tive source regions (Fig. 5). Except for NMMB/BSC-Dust, with maximum emissions on 4 April, the emissions peak within the region of interest on 5 April and decrease there-after. The overall largest emissions on 5 April are forecasted by MetUM and the smallest ones by ECMWF/MACC. The large emissions from the former are consistent with the over-estimated AOD at Saada on 5 April shown in Fig. 2. MetUM is the only model to present similar results for the different forecast lead times (Figs. S07 and S08). The remaining mod-els forecast mostly increasing emissions with increasing lead time for 6 and 7 April. Models ECMWF/MACC and BSC-DREAM8b both present larger emissions for the 72 h fore-cast than for the 24 and 48 h forefore-casts on 4 April and vice versa for the following day.
The difference between the largest (MetUM) and the smallest emission (ECMWF/MACC) is of the order of a fac-tor of 10 (Fig. 6). This facfac-tor is larger than the uncertainty in the annual mean emission from AEROCOM (http://aerocom. met.no, Huneeus et al., 2011) suggesting that emission un-certainty in single events is particularly large. Most models present maximum emissions on 5 April, except NNMB/BSC-Dust on 4 April. ECMWF/MACC and DREAM8-NMME have emission maxima at 15:00 UTC, whereas MetUM and NNMB/BSC-Dust have the peak in emissions at noon and BSC-DREAM8b at 09:00 UTC. ECMWF/MACC is the only model with a temporal lag with changing forecast lead times, namely 3 h earlier emissions on 4 April and 3 h later ones on 6 April in the 72 h forecast. Furthermore, ECMWF/MACC and BSC-DREAM8b have the largest differences between the lead times; contrary to the 24 and 48 h forecasts, the 72 h forecast presents the peak in emissions on 4 April and decreasing emissions thereafter. Although the other mod-els also present differences between the forecast lead times, these are mostly in terms of magnitude and are smaller com-pared to emission differences in ECMWF/MACC.
4.3 Vertical dust profiles
The CALIOP observations for the 5 April show a shallow layer concentrating most of the aerosols below 1 km a.g.l. and extending up to 40◦N and a second deeper layer between
2 to 9 km a.g.l. and between 25 and 40◦N (Fig. 7). This
lat-ter area, between 25 and 40◦N, coincides with the dust cloud from MODIS as well as the aerosol characterization from the CALIOP product (Fig. S09). This higher plume can be linked to a preceding dust intrusion that began at the end of March and is not further analysed here. For the 7 April, a deep layer of aerosols extends up to 4 km a.g.l. with most aerosols below 2 km south of 25◦N and mostly above 2 km between 35 and
Table 2. Root mean square error (RMSE) quantifying the performance in reproducing AERONET total AOD for each model. The statistics are computed for stations in southern, central and northern Europe (Fig. 1), considering the period between 5 and 11 April. Note that for all models the dust AOD was used.
Southern Europe Central Europe Northern Europe 24 48 72 24 48 72 24 48 72 DREAM8-NMME 0.18 0.21 0.18 0.13 0.14 0.15 0.19 0.19 0.20 BSC-DREAM8b 0.20 0.20 0.19 0.17 0.17 0.16 0.32 0.33 0.31 ECMWF/MACC-Dust 0.18 0.17 0.24 0.15 0.14 0.14 0.12 0.18 0.12 NMMB_BSC 0.19 0.21 0.23 0.17 0.16 0.17 0.23 0.26 0.25 MetUM 0.12 0.14 0.14 0.15 0.16 0.15 0.18 0.18 0.24
Table 3. Same as Table 2 but for mean bias (MB).
Southern Europe Central Europe Northern Europe 24 48 72 24 48 72 24 48 72 DREAM8-NMME −0.10 −0.10 −0.09 −0.06 −0.06 −0.06 −0.06 −0.07 −0.06 BSC-DREAM8b −0.09 −0.10 −0.08 −0.10 −0.10 −0.08 −0.22 −0.22 −0.20 ECMWF/MACC-Dust 0.09 0.07 0.08 −0.07 −0.07 −0.06 −0.06 −0.07 −0.05 NMMB_BSC −0.11 −0.11 −0.08 −0.10 −0.10 −0.10 −0.13 −0.15 −0.11 MetUM 0.04 0.06 0.02 −0.06 −0.06 −0.04 −0.03 −0.04 −0.03
Table 4. Same as Table 2 but for Pearson correlation coefficient (R).
Southern Europe Central Europe Northern Europe 24 48 72 24 48 72 24 48 72 DREAM8-NMME 0.76 0.62 0.74 0.50 0.42 0.21 0.74 0.75 0.67 BSC-DREAM8b 0.66 0.66 0.66 0.17 0.11 0.04 0.64 0.63 0.48 ECMWF/MACC-Dust 0.83 0.81 0.69 0.29 0.37 0.41 0.91 0.78 0.91 NMMB_BSC 0.72 0.64 0.61 0.14 0.24 0.11 0.76 0.54 0.47 MetUM 0.89 0.87 0.81 0.20 0.12 0.17 0.72 0.73 0.43
40◦N. The latter layer is a consequence of the uplift forced by the Atlas Mountains (Fig. S09).
The models show a large diversity in the 24 h forecast of extinction coefficient profiles, in particular for the 5 April when the satellite passes over the western margins of the con-tinent and the adjacent Atlantic Ocean. On this day all mod-els simulate a shallow near-surface dust layer over the conti-nent south of 25◦N but fail to reproduce the observed
north-ward extension, except the ECMWF model. It shows a dust layer around 1 km a.g.l. but underestimates the intensity. The aerosol layer above 2 km is not simulated by NMMB/BSC-Dust but is visible, with an underestimated depth and height, in the other models. MetUM and ECMWF/MACC limit the vertical extent of the layer to 4 km and show the largest sig-nal centred at 2 km as opposed to 3 km in the observations. Similarly, BSC-DREAM8b and DREAM8-NMME simulate this layer but with even smaller magnitudes.
On the 7 April the models mostly agree on the vertical dis-tribution of the aerosol layer. Except for BSC-DREAM8b,
all models represent the aerosol layer mostly confined within the first 2 km up to 40◦N, and the depth of the uplift north of 40◦N is underestimated. BSC-DREAM8b, however, repro-duces the depth of the observed layer extending up to 40◦N, but the depth of the uplift is overestimated and extended to 6 km. Finally, NMMB/BSC-Dust, BSC-DREAM8b and DREAM8-NMME underestimate the observed magnitude of the extinction coefficient, ECMWF/MACC overestimates it, and MetUM simulates values more in agreement with the ob-servations.
4.4 Intercomparison of synoptic conditions
The synoptic conditions are important for the origin and evolution of the dust cloud. We investigate the model per-formance in predicting the synoptic conditions at midday compared to MERRA. Our analysis focuses on the day of dust emission (5 April) and of transport towards the Atlantic (7 April) and towards Great Britain and northern Europe (9 April). The intercomparison of the geopotential height and
Figure 4. Daily measured surface concentration (µg m−3) and normalized bias of corresponding 24 h forecast surface concentration (%) at stations illustrated in Fig. 1. Each row corresponds to one of the stations. Stations are ordered from south to north, and white colour corresponds to days without measurements. Corresponding 24 h forecast model surface concentrations are illustrated in Fig. S04, and the 48 and 72 h of normalized bias of forecasted surface concentration are provided in Figs. S05 and S06.
Table 5. Root mean square error (RMSE), mean bias and correlation quantifying the performance in reproducing dust surface concentration in the Iberian Peninsula. Figure 1 illustrates the location of the stations used in the computation of the statistics. Note that for the models, the total dust surface concentration was used.
RMSE Mean bias Correlation 24 48 72 24 48 72 24 48 72 DREAM8-NMME 15.9 17.1 16.6 −0.4 −2.1 −1.8 0.22 0.13 0.15 BSC-DREAM8b 28.6 27.3 28.8 12.0 11.7 12.7 0.38 0.41 0.35 ECMWF/MACC-Dust 28.1 28.9 28.6 20.2 20.7 20.1 0.36 0.34 0.47 NMMB_BSC 16.8 16.0 15.2 −9.9 −9.6 −7.6 0.46 0.55 0.53 MetUM 147.1 126.5 125.1 110.7 99.0 100.4 0.29 0.35 0.38
wind speed analysis at 850 and 500 hPa is shown for each model for the 24 h forecast in Figs. 8 and 9, respectively. The corresponding results for the 48 and 72 h forecasts are pro-vided in the Supplement (Figs. S12–S15).
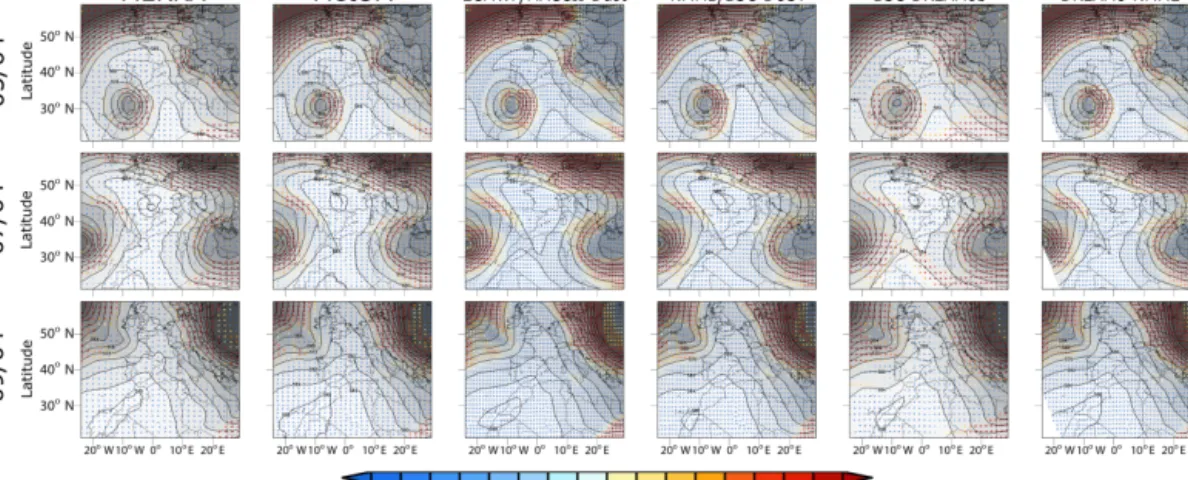
On 5 April, the situation is characterized by a cyclone over the Atlas Mountains in Morocco at 850 and 500 hPa and strong winds around 26 m s−1occurring to the northeast of the cyclone centre at 850 hPa and to the east at 500 hPa (Figs. 8 and 9, respectively). On 7 April the cyclone moved westward while the centre of an anticyclone was located over the Celtic Sea at 850 hPa and near the Pyrenees at 500 hPa. The associated ridge stretches towards northern Africa, caus-ing southerlies over the Iberian Peninsula and the Atlantic
Ocean. The anticyclone at 850 hPa weakened on 9 April and was located over the North Sea. Similarly the ridge at 500 hPa, although persistent, also weakened and extended from the North Sea to western Europe.
The 24 h forecasts reproduced the synoptic development. However, they slightly underestimated the strength of the an-ticyclone on 7 April at 500 hPa and on 9 April at 850 hPa. ECMWF/MACC, NMMB/BSC-Dust and BSC-DREAM8b also tended to underestimate the anticyclone strength on 7 April at 850 hPa. In addition, BSC-DREAM8b shows larger wind speeds than suggested by MERRA to the west of the cyclone centre in all forecasts, a feature not produced by any other model.
Figure 5. Forecasted daily average emission with 24 h lead time for the models MetUM (first column), ECMWF/MACC (second column), NMMB/BSC-DUST (third row), BSC-DREAM8b (forth column) and DREAM8-NMME (fifth row). Dashed box illustrates region used in the time series emissions illustrated in Fig. 6.
Figure 6. Time series of 3-hourly emissions from models MetUMTM, ECMWF/MACC, NMMB/BSC-Dust, BSC-DREAM8b and DREAM8-NMME with 24, 48 and 72 h lead time (blue, red and black, respectively).
The 48 and 72 h forecasts do not show major differences compared to the 24 h forecasts. Some small differences are identified, including an additional weakening of the anticy-clone at 850 hPa with increasing lead time on 5 April in NMMB/BSC-Dust and on 7 April in MetUM. Similarly, the ECMWF/MACC and NMMB/BSC-Dust show a weakening of the ridge at 500 hPa with increasing lead time. On 7 April, MetUM, NMMB/BSC-Dust and DREAM8-NMME weaken the high pressure at 500 hPa with increasing lead time, while ECMWF/MACC and BSC-DREAM8b strengthen it. These differences in the strength of the ridge illustrate the model uncertainty in synoptic conditions during the north-ward transport of the dust cloud. This meteorological uncer-tainty likely affects the model performance in AOD and sur-face concentrations. More detailed analysis is needed to
re-veal the mechanisms causing these differences, which is left for future work.
4.5 Wind analysis
We evaluated the forecasted surface winds, a key driver for dust emission and thereby a potential source for emission dif-ferences amongst the models. We used spatial averages of 3-hourly surface wind observations (red dots in Fig. 1) be-tween 4 and 7 April 2011 (Fig. 10). We followed the same procedure with the models and the MERRA reanalysis by averaging the nearest grid cells to the wind observation sites. An in-depth evaluation of winds for dust emission would re-quire an analysis of the wind distributions, which is outside the scope of the present work.
The strongest winds occurred on 4 April, reaching a spa-tial mean of 5 m s−1 at 03:00 UTC and a southwesterly
di-Figure 7. Profiles of measured total extinction coefficient at 532 nm from the CALIOP instrument onboard the CALIPSO satellite and 24 h forecasted dust extinction coefficient profiles at 532 nm from models MetUM, ECMWF/MACC, NMMB/BSC-DUST, BSC-DREAM8b and DREAM8-NMME. Conditions are presented for 5 April (upper row) and 7 April (lower row). Overpass of the satellite in each case is illustrated in Fig. 3. Corresponding forecasted model profiles for 48 and 72 h lead times are illustrated in Figs. S10 and S11, respectively).
Figure 8. The geopotential height (grey shaded with contour labels in gpdm (geopotential decametre)) and wind speed stream lines at 850 hPa on 5 April (first row), 7 April (second row) and 9 April (third row) 2011 at 12:00 UTC from MERRA reanalysis and the 24 h forecasts from MetUM, ECMWF/MACC, NMMB/BSC-DUST, BSC-DREAM8b and DREAM8-NMME (from left to right).
rection (Figs. 10 and S16). Peak values in this region were associated with the cyclone in the lee of the Atlas Mountains (Sect. 2) that caused dust emission. At 06:00 UTC the wind speed suffered a sharp decrease to 2 m s−1and the wind be-came easterly. The winds are mostly easterly thereafter with a southerly component in the afternoons of 5 and 6 April. The magnitude remains mostly similar from 09:00 UTC on the 4th until 09:00 UTC on 5 April, after which winds in-creased their speed until 21:00 UTC followed by calms con-ditions until 12:00 UTC next day. Calm concon-ditions were also observed during the night of 6 April.
The models initialized 24 h ahead of the dust event cap-tured the general development of the 10 m wind (Fig. 10), increase in winds on the afternoon of 5 April and decrease on the night of the same day as well as the calm condi-tions on the night of 6 April. However, except for
BSC-DREAM8b, the models mostly overestimate the wind speed throughout the period. Furthermore, the mostly easterly con-dition of the winds is also captured by all models, but most of them present a stronger meridional (southerly) wind com-ponent than the observations, in particular on 5 April and most of the next day (Figs. S16 and S17). All models present northeasterly winds at 03:00 and 06:00 UTC on 4 April, but BSC-DREAM8b and DREAM8-NMME are the sole models to present northerly wind components from 18:00 UTC on 4 April until 06:00 UTC on the next day. Although observa-tions show northeasterly wind, this is only the case at 06:00 and 21:00 UTC on 4 April. Furthermore, no model repro-duces the strong winds at 03:00 UTC on 4 April, neither in terms of magnitude nor in direction. Interestingly, MERRA reanalysis shows similar difficulties in reproducing the obser-vations as the forecasts. Largeron et al. (2015) attributed the
Figure 9. Same as Fig. 8 but for 500 hPa.
Figure 10. Time series of near-surface wind speeds in dust source region. Three-hourly values of the 10 m wind speed from observations and reanalysis (MERRA) and global models and regional models for the period 4–7 April 2011 with (a) 24 h, (b) 48 h and (c) 72 h lead times. Observations are averaged over the region illustrated in Fig. 1. The 10 m winds from the models are averaged over the grid boxes enclosing the observation station.
overestimation of night-time surface winds in different re-analyses (MERRA being one of them) to an overestimation of the turbulent diffusion of the nocturnal dry stable surface layer. This is a common problem of state-of-the-art reanaly-sis products (Sandu et al., 2013) and can affect dust emission (Fiedler et al., 2013).
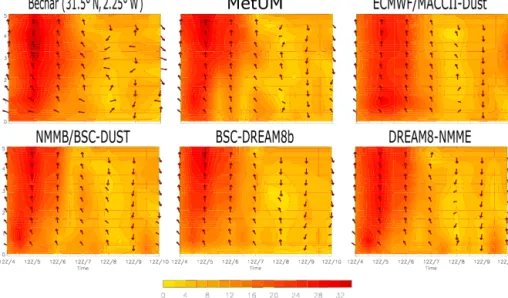
We now examine the model performance in forecasting the vertical profile of horizontal winds measured by two daily ra-diosondes (noon and midnight) at Béchar (31.5◦N, 2.25◦W) in Algeria (Fig. 11), close to the dust source of this event (Fig. 1). The closest model grid box to the station is con-sidered in this analysis. Two different regimes can be iden-tified from the observed profiles. The dust-emitting regime until 7 April is characterized by almost constant southerlies above 1 km a.g.l. and easterlies near the surface in agreement with the cyclone (Sect. 4.4). The wind speeds generally in-crease until 5 April and dein-crease thereafter. Maxima in wind speed around 30 m s−1on 5 April are reached in two layers
centred approximately around 1.5 and 4 km. The subsequent, relatively calm regime is characterized by weaker winds and stronger variability in wind direction with height and time. The following analysis will focus on the first regime, given its role in the emission and northward transport of dust dur-ing the event.
All models simulate the dominant southerlies at elevated levels but they do not reproduce the easterlies close to the sur-face (Fig. 11). Furthermore, most models represent the two maxima in wind speed, yet the maximum around 4 km a.g.l. is weaker and found at higher levels than in the observations. The observed wind maximum between 1 and 2 km a.g.l. is poorly forecasted. Except in ECMWF/MACC, this maxi-mum is forecasted 12 h prior to the observations. In addi-tion, the performance in reproducing the depth of the layer with strong winds and its duration varies amongst mod-els. The onset is well reproduced by all models and the strong southerlies agree with observations above 3 km, but below this height, most models terminate the strong winds 1 day earlier compared to the observations. Lead times of 48 h show no large impact for the other models (Fig. S19), whereas for lead times of 72 h, MetUM and BSC-DREAM8b forecast the maximum around 4 km a.g.l., delayed with re-spect to the observations (Fig. S20).
Figure 11. Profiles of measured wind speed (m s−1, filled contours) and direction (vectors, first column) between 4 and 10 April from radio sounding at Béchar (31.5◦N, 2.25◦W; first row) and the corresponding 24 h forecasts of models MetUM, ECMWF/MACC, NMMB/BSC-DUST, BSC-DREAM8b and DREAM8-NMME.
5 Discussion
The capacity of five models to predict an intense dust event with a lead time of up to 72 h was examined. Each model was compared to a set of observations characterizing the dust outbreak from northwest Africa towards Europe between 5 and 11 April 2011. The focus was to assess the capabilities to predict the evolution of AOD and dust surface concen-tration along the path of the dust cloud. For the former we compared model outputs to both satellite daily products and ground-based 3-hourly observations from the AERONET network, whereas for the latter we compared forecasted daily near-surface dust concentration to daily-inferred surface con-centration observations. The analysis was extended to wind (both surface and profile), synoptic conditions, aerosol ver-tical distribution, emissions and deposition fluxes as an at-tempt to explain the diversity in forecast capability among the models.
Comparison with MODIS AOD revealed that all mod-els reproduce the main features of the daily AOD horizon-tal distribution throughout the analysed period. However, MetUM, ECMWF/MACC and NMMB/BSC-Dust overesti-mate the AOD on the first days of the event when the dust cloud is over northern Africa and southern Spain, while BSC-DREAM8b and DREAM8-NMME underestimate it. How-ever, analysis of the results compared to AERONET data at Saada, in northern Africa, show that the AOD is mostly un-derestimated on the days of maximum AOD. We highlight that, according to the simulations, this station is located on the borders of the dust cloud and therefore the bias of each model with respect to the observations is sensitive to both the
magnitude of the emitted dust amount and the position of the dust cloud.
Note that while the observed AOD, from both AERONET and MODIS, corresponds to the total AOD and is therefore sensitive to all aerosol species, the simulated one corresponds to the optical depth due to dust particles only. The model bias thus could be partly due to excluded aerosol species. However, the low observed AE (< 0.3) on days of maximum AOD (Fig. 2) indicates that the particles in the atmospheric column are dominated by large particles. This is particularly evident at sites remote from dust sources. Furthermore, this allows attributing the model performance to its capacity, at least on days with low AE, to simulate the dust event.
All models agree in underestimating the AOD at Birkenes with respect to both AERONET and MODIS. The underes-timation of AOD at Birkenes by models BSC-DREAM8b and DREAM8-NMME is consistent with the underestima-tion of AOD in northern Africa. However, underestimaunderestima-tions by models overestimating the AOD in northern Africa (Me-tUM, ECMWF/MACC and NMMB/BSC-Dust) suggest that not enough dust is transported northward. This could be as-sociated either with the representation of synoptic conditions affecting the horizontal transport or removal processes in the models.
A difference in emission of the order of a factor of 10 is observed between the models (Fig. 6). The individual reasons for the model differences are unknown, but poten-tial sources for differences are discussed in the following. One potential reason for different emission is the model-dependent emission parameterizations with different parti-cle size distributions. ECMWF/MACC has a size distribution with particles of up to 20 mm in diameter, whereas the other
Figure 12. Total accumulated forecasted daily deposition with 24 h lead time for the models MetUM, ECMWF/MACCII-Dust, NMMB/BSC-DUST, BSC-DREAM8b and DREAM8-NMME (from left to right).
four models have maximum sizes of 10 mm (Table 1). How-ever, ECMWF/MACC has the smallest emission. Even for the three models with the same number of bins and the same size distribution (NNMB/BSC-Dust, BSC-DREAM8b and DREAM8-NMME), large emission differences exist, point-ing to the importance of other aspects. Furthermore, previous studies have shown that dust-emitting winds differ amongst models and can be attributed to the representation of atmo-spheric processes (e.g. Fiedler et al., 2015). Future studies should examine the detailed differences in winds and size distribution of the emissions, including aspects of model res-olution that are crucial for representing different atmospheric processes. Deposition (and its size distribution) should also be examined further in future studies given its importance in model performance in simulating dust concentration and AOD.
Analysis of the total accumulated daily dust deposition suggests that most of the removal occurs in northern Africa close to the source and little is removed over the Atlantic and Europe (Figs. 12, S21 and S22). The absence of observed deposition data prevents assessing this aspect of the models’ performance. The limited deposition away from the source, indicating too short a dust aerosol lifetime in the models, is in agreement with the underestimated dust layer height and AOD away from northern Africa. However, observations taken during the Fennec project (Washington et al., 2013) suggest the presence of large particles in higher levels (Allen et al., 2013; Ryder et al., 2013). This could indicate potential dust deposition further away from the source as illustrated by the models and highlights the role of large particles in re-moval processes as a potential source of errors. It is interest-ing that the models with the largest emission are not
neces-sarily the ones with the strongest removal, for instance for the first days of the event, NMMB/BSC-Dust, BSC-DREAM8b and DREAM8-NMME present stronger total emissions than ECMWF/MACC but lower deposition fluxes.
Comparison of synoptic maps at 850 and 500 hPa of each model with MERRA reanalysis shows that models reproduce the main circulation patterns at both levels. Larger differ-ences are observed in the representation of the vertical struc-ture of horizontal wind, in particular the onset and duration of the southerly winds and the height of layers with maximum speed. In addition to this, analysis of the vertical structure of the dust cloud reveals that the models generally underesti-mate the depth and magnitude of the dust layer as suggested by CALIOP observations. Note, however, that CALIOP may overestimate the aerosol extinction coefficient in layers with a significant mixture of mineral dust and marine aerosols due to an overestimation of the lidar ratio (Cuevas et al., 2015). Nevertheless, both of the aforementioned factors (ver-tical structure of horizontal wind and ver(ver-tical dust propaga-tion) combined could contribute to the reduced northward dust transport to Birkenes in the models; dust particles do not reach layers of strong winds responsible for the north-ward transport.
The models show, all in all, a similar performance in fore-casting AERONET AOD. In general no model outperforms the other in all statistics and for both variables (AOD and surface concentration), and the inter-model spread is larger than the change in forecast skill with lead time. While for the near-surface concentration of dust the NMMB/BSC-Dust presents the best performance in term of all statistics, for AOD the best-performing model depends on the region and forecast lead time. We remind the reader that for analysis
Table 6. Mean normalized gross error quantifying the performance in reproducing AERONET total AOD in southern Europe and sur-face concentration (sfc. conc.) for each model and each lead time forecast. Note that for the models, the dust AOD and dust total sur-face concentrations were used.
AOD Sfc. conc. 24 48 72 24 48 72 DREAM8-NMME 0.35 0.37 0.34 1.06 0.99 0.98 BSC-DREAM8b 0.41 0.44 0.43 1.91 1.86 1.88 ECMWF/MACC-Dust 0.50 0.50 0.62 2.28 2.36 1.96 NMMB_BSC 0.45 0.48 0.48 0.75 0.67 0.71 MetUM 0.34 0.39 0.38 9.75 8.70 8.78
with AERONET data, stations were grouped into southern (SE), central (CE) and northern Europe (NE), whereas for surface concentration stations were not grouped but consid-ered as part of southern Europe. Furthermore, most models present better RMSE and mean bias in CE. This suggests that errors are large both close to dust sources and in long-distance transport. In addition, NE presented better statistics than SE in some cases. The reason for this has not been ex-amined in detail but could be a consequence of the low AOD in NE including non-dust situations, i.e. the models success-fully reproduce the dust-free days in northern Europe. For near-surface dust concentration, the different forecast lead times also show a similar performance for each model. As for AOD, overall the difference between models is larger than the differences between lead times. Note, however, that these results correspond to only one event and the number of stations used in this statistical analysis is small (21 stations for AOD and 24 for dust surface concentration), with only a few days considered. Therefore, the statistical significance of these results needs to be explored by considering multiple events before drawing generalized conclusions.
We use the mean normalized gross errors (MNGE) to as-sess the difference between the performance in reproducing AOD and near-surface concentration. This statistic measures the relative difference to the observations and allows compar-ing two variables with different magnitudes. Consistent with the difficulties of models in reproducing, the vertical dust dis-tribution, quantitative assessment of the model performance in AOD and near-surface dust concentration show that mod-els have a better forecast skill for the former, independent of the forecasting lead times and station; all show smaller MNGE for the AOD (Table 6). Furthermore, the model di-versity to forecast near-surface dust concentration, indicated by the range of MNGE between the models, is much larger than the corresponding range in AOD forecast skill.
In spite of the large model diversity in magnitude and spatial distribution of the emissions and deposition, mod-els present comparable performance when simulating AOD over northern Africa and Europe. Although this feature can be likely attributed to the practice in model development to
use AOD values to tune dust simulations, other reasons can-not be excluded. The AOD depends on both burden and size distribution of dust particles. Therefore, biases in AOD, in particular in the source region, can be associated with biases in the net fluxes and/or to misrepresentation of the size dis-tribution (Huneeus et al., 2011). In addition, the definition of optical parameters is also relevant to determine the scat-tering efficiency of dust particles in a model and thus AOD. The present study has focused on the forecast skill of the dust life cycle (i.e. emission, transport and deposition) of a given event from different models but has not examined the role of size distribution nor the definition of optical parameters in the forecast performance.
6 Conclusions
As part of the WMO SDS-WAS, five state-of-the-art dust forecast models were examined in their performance in pre-dicting an intense Saharan dust outbreak towards western Europe and Scandinavia between 5 and 11 April 2011. The models are successful in predicting the onset and evolution of the dust cloud in terms of AOD for all three analysed lead times, namely 24, 48 and 72 h. However, all models underes-timate the northward transport of dust, in particular by those models overestimating the AOD in the source region. Weaker horizontal winds, layers with maximum wind at higher alti-tudes than observed and too shallow dust layers simulated by the models might explain why not enough dust is transported northward. Quantitative forecast-skill analysis revealed that in general no model outperforms the other in all statistics. Nevertheless, the choice of model has a larger impact on the forecast skill than the lead time. Furthermore, and in agree-ment with the difficulties in reproducing the vertical distri-bution of dust, the models perform better in forecasting the AOD in the Iberian Peninsula than the near-surface dust con-centrations.
Large diversity exists among the models in their emissions and deposition, both in terms of magnitude and spatial distri-bution. The difference in these fluxes is on the order of a factor 10, exceeding the uncertainty amongst models in the annual mean emission (Huneeus et al., 2011). This result un-derlines the particularly large model uncertainty for an in-dividual dust storm. In light of the perception that cyclones are reasonably well forecasted, e.g. compared to dust storms due to cold pool outflows from tropical convection (see, e.g., Heinold et al., 2013), this result is even more striking. The models also present large diversity in the timing of the emis-sions, varying between afternoon, noon and morning. In spite of these large differences, the models have comparable skills to forecast AOD, likely due to the use of AOD values to tune dust models.
The results highlight the need of future studies assessing the performance of dust models in examining individual pro-cesses in more detail, particularly the vertical mixing, 3-D
wind fields, emission and deposition, and vertical distribution of dust. These need to be better understood for more robust dust storm forecasting. Emission and deposition need to be further investigated not only in terms of their magnitude but also in terms of spatial distribution. In addition and in spite of the, all in all, successful representation of the synoptic condi-tions by the different models, the vertical distribution of the horizontal wind and vertical mixing of dust needs to be as-sessed more extensively. However, we also stress that more observations are needed; the absence of emission and depo-sition measurements precludes evaluation of the net model fluxes and the current scarcity or lack of routine observations of dust surface concentration and lidar and wind profiles pre-vents a more detailed assessment of model performance and identifying current sources of bias. Finally, this work has ex-amined the models in their performance for a single event and should be replicated for other events and in other dust source regions before drawing definitive conclusions.
This study has focused on the dust aerosol life cycle of the event (i.e. emission, transport and deposition) to exam-ine the forecast skill of each model and the differences in skill among them. We have highlighted the importance of the size distribution in drawing conclusions on emissions biases due to biases in AOD. However, the impact of the scatter-ing efficiency on the forecast skill has not been addressed. The AOD depends on burden and size distribution, but the definition of optical parameters is also relevant to determine the scattering efficiency of dust particles in a model. We sug-gest that future intercomparison studies examining the model performance in reproducing the dust life cycle explicitly in-clude the size distribution in their analysis and comparisons with observations, allowing conclusions on the performance in reproducing it (e.g. Angström exponent). In addition, the comparison of the definition of optical parameters between the different models should also be incorporated.
The Supplement related to this article is available online at doi:10.5194/acp-16-4967-2016-supplement.
Acknowledgements. The authors acknowledge AERONET (http://aeronet.gsfc.nasa.gov) and thank the PIs of the AERONET stations used in this paper for maintaining the observation program and the AERONET-Europe TNA (EU-ACTRIS grant no. 262254) for contributing to calibration efforts. We also acknowledge the MERRA, CALIPSO and MODIS mission scientists and associated NASA personnel for the production of the data used in this research effort. MODIS data used in this paper were produced with the Giovanni online data system, developed and maintained by the NASA GES DISC. S. Basart acknowledges the Catalan Government (BE-DGR-2012) as well as the CICYT project (CGL2010-19652 and CGL2013-46736) and Severo Ochoa (SEV-2011-00067) programme of the Spanish Government. The NMMB/BSC-Dust and BSC-DREAM8b simulations were
performed on the MareNostrum supercomputer hosted by BSC. Stephanie Fiedler acknowledges the funding of the European Research Council through the starting grant of Peter Knippertz (no. 257543). Nicolas Huneeus acknowledges FONDAP 15110009 and FONDECYT 1150873. The database on dust concentrations at ground level was produced in the framework of the Grant Agreement LIFE10 ENV/IT/327 from the LIFE Programme of the European Commission. J. Pey has been partially funded by a Ramon y Cajal Grant (RYC-2013-14159) from the Spanish Min-istry of Economy and Competitiveness. Carlos Pérez García-Pando acknowledges the Department of Energy (DE-SC0006713) and the NASA Modeling, Analysis and Prediction Program. The work was partly funded within MACC-II by the European Commis-sion under the EU Seventh Research Framework Programme, contract number 283576 and MACC-III by the European Commu-nity’s Horizon 2020 Programme under grant agreement no. 633080. Edited by: M. Tesche
References
Agier, L., Deroubaix, A., Martiny, N., Yaka, P., Djibo, A., and Broutin H.: Seasonality of meningitis in Africa and climate forcing: aerosols stand out, J. R. Soc. Interface, 10, 20120814, doi:10.1098/rsif.2012.0814, 2013.
Allen, C. J. T., Washington, R., and Engelstaedter, S.: Dust emission and transport mechanisms in the central Sa-hara: Fennec ground-based observations from Bordj Badji Mokhtar, June 2011, J. Geophys. Res.-Atmos., 118, 6212–6232, doi:10.1002/jgrd.50534, 2013.
Alpert, P., Krichak, S. O., Tsidulko, M., Shafir, H., and Joseph, J. H.: A dust prediction system with TOMS initializa-tion, Mon. Weather Rev., 130, 2335–2345, doi:10.1175/1520-0493(2002)130<2335:adpswt>2.0.co;2, 2002.
Aumont, O., Bopp, L., and Schulz, M.: What does temporal vari-ability in aeolian dust deposition contribute to sea-surface iron and chlorophyll distributions?, Geophys. Res. Lett., 35, L07607, doi:10.1029/2007GL031131, 2008.
Bagnold, R. A.: The Physics of Blown Sand and Desert Dunes, Methuen, London, 1941.
Balkanski, Y., Schulz, M., Claquin, T., and Guibert, S.: Reevalua-tion of Mineral aerosol radiative forcings suggests a better agree-ment with satellite and AERONET data, Atmos. Chem. Phys., 7, 81–95, doi:10.5194/acp-7-81-2007, 2007.
Basart, S., Perez, C., Nickovic, S., Cuevas, E., and Bal-dasano, J. M.: Development and evaluation of the BSC-DREAM8b dust regional model over Northern Africa, the Mediterranean and the Middle East, Tellus B, 64, 18539, doi:10.3402/Tellusb.V64i0.18539, 2012.
Basart, S., Pérez, C., Cuevas, E., Baldasano, J. M., and Gobbi, G. P.: Aerosol characterization in Northern Africa, Northeastern Atlantic, Mediterranean Basin and Middle East from direct-sun AERONET observations, Atmos. Chem. Phys., 9, 8265–8282, doi:10.5194/acp-9-8265-2009, 2009.
Bauer, S. E. and Koch, D.: Impact of heterogeneous sulfate for-mation at mineral dust surfaces on aerosol loads and radia-tive forcing in the Goddard Institute for Space Studies
gen-eral circulation model, J. Geophys. Res.-Atmos., 110, D17202, doi:10.1029/2005JD005870, 2005.
Benedetti, A., Reid, J. S., and Colarco, P. R.: International coopera-tive for aerosol prediction workshop on aerosol forecast verifica-tion, B. Am. Meteorol. Soc., 92, ES48–ES53, doi:10.1175/bams-d-11-00105.1, 2011.
Benedetti, A., Baldasano, J. M., Basart, S., Benincasa, F., Boucher, O., Brooks, M., Chen, J.-P., Colarco, P. R., Gong, S., Huneeus, N., Jones, L., Lu, S., Menut, L., Morcrette, J.-J., Mulcahy, J., Nickovic, S., Pérez, C., Reid, J. S., Sekiyama, T. T., Tanaka, T. Y., Terradellas, E., Westphal, D. L., Zhang, X.-Y., and Zhou, C.-H.: Numerical prediction of dust, in: Mineral Dust – a Key Player in the Earth System, edited by: Knippertz, P. and Stuut, J.-B., Springer, Dordrecht, 230–240, 2014.
Betts, A. K.: A new convective adjustment scheme – Part 1: Ob-servational and theoretical basis, Q. J. Roy. Meteor. Soc., 112, 677–691, doi:10.1002/qj.49711247307, 1986.
Betts, A. K. and Miller, M. J.: A new convective adjustment scheme – Part 2: Single column tests using GATE wave, BOMEX, ATEX and arctic air-mass data sets, Q. J. Roy. Meteor. Soc., 112, 693– 709, doi:10.1002/qj.49711247308, 1986.
Cuevas, E., Camino, C., Benedetti, A., Basart, S., Terradel-las, E., Baldasano, J. M., Morcrette, J. J., Marticorena, B., Goloub, P., Mortier, A., Berjón, A., Hernández, Y., Gil-Ojeda, M., and Schulz, M.: The MACC-II 2007–2008 reanaly-sis: atmospheric dust evaluation and characterization over north-ern Africa and the Middle East, Atmos. Chem. Phys., 15, 3991– 4024, doi:10.5194/acp-15-3991-2015, 2015.
Escudero, M., Querol, X., Pey, J., Alastuey, A., Pérez, N., Fer-reira, F., Alonso, S., Rodríguez, S., and Cuevas, E.: A method-ology for the quantification of the net African dust load in air quality monitoring networks, Atmos. Environ., 41, 5516–5524, doi:10.1016/j.atmosenv.2007.04.047, 2007.
Fécan, F., Marticorena, B., and Bergametti, G.: Parametrization of the increase of the aeolian erosion threshold wind friction veloc-ity due to soil moisture for arid and semi-arid areas, Ann. Geo-phys., 17, 149–157, doi:10.1007/s00585-999-0149-7, 1999. Fiedler, S., Schepanski, K., Heinold, B., Knippertz, P., and Tegen,
I.: Climatology of nocturnal low-level jets over North Africa and implications for modeling mineral dust emission, J. Geophys. Res.-Atmos., 118, 6100–6121, doi:10.1002/jgrd.50394, 2013. Fiedler, S., Knippertz, P., Woodward, S., Martin, G., Bellouin, N.,
Ross, A., Heinold, B.,Schepanski, K., Birch, C., and Tegen, I.: A process-based evaluation of dust-emitting winds in the CMIP5 simulation of HadGEM2-ES, Clim. Dynam., 46, 1107–1130, doi:10.1007/s00382-015-2635-9, 2015.
Gallisai, R., Peters, F., Volpe, G., Basart, S., Baldasano, J. M.: Saharan dust deposition may affect phytoplankton growth in the Mediterranean Sea at ecological time scales, PloS One, 9, e110762, doi:10.1371/journal.pone.0110762, 2014.
Ginoux, P., Chin, M., Tegen, I., Prospero, J. M., Holben, B., Dubovik, O., and Lin, S. J.: Sources and distributions of dust aerosols simulated with the GOCART model, J. Geophys. Res.-Atmos., 106, 20255–20273, 2001.
Guerrero-Rascado, J. L., Olmo, F. J., Avilés-Rodríguez, I., Navas-Guzmán, F., Pérez-Ramírez, D., Lyamani, H., and Alados Ar-boledas, L.: Extreme Saharan dust event over the southern Iberian Peninsula in september 2007: active and passive remote
sensing from surface and satellite, Atmos. Chem. Phys., 9, 8453– 8469, doi:10.5194/acp-9-8453-2009, 2009.
Heinold, B., Helmert, J., Hellmuth, O., Wolke, R., Ansmann, A., Marticorena, B., Laurent, B., and Tegen, I.: Regional model-ing of Saharan dust events usmodel-ing LM-MUSCAT: model descrip-tion and case studies, J. Geophys. Res.-Atmos., 112, D11204, doi:10.1029/2006JD007443, 2007.
Heinold, B., Knippertz, P., Marsham, J. H., Fiedler, S., Dixon, N. S., Schepanski, K., Laurent, B., and Tegen, I.: The role of deep convection and nocturnal low-level jets for dust emis-sion in summertime West Africa: estimates from convection-permitting simulations, J. Geophys. Res.-Atmos., 118, 4385– 4400, doi:10.1002/jgrd.50402, 2013.
Holben, B. N., Eck, T. F., Slutsker, I., Tanre, D., Buis, J. P., Set-zer, A., Vermote, E., Reagan, J. A., Kaufman, Y. J., Nakajima, T., Lavenu, F., Jankowiak, I., and Smirnov, A.: AERONET – a fed-erated instrument network and data archive for aerosol character-ization, Remote Sens. Environ., 66, 1–16, 1998.
Hsu, N. C., Tsay, S. C., King, M. D., and Herman, J. R.: Aerosol properties over bright-reflecting source regions, IEEE T. Geosci. Remote, 42, 557–569, doi:10.1109/TGRS.2004.824067, 2004. Hsu, N. C., Tsay, S. C., King, M. D., and Herman, J. R.:
Deep Blue retrievals of Asian aerosol properties dur-ing ACE-Asia, IEEE T. Geosci. Remote, 44, 3180–3195, doi:10.1109/TGRS.2006.879540, 2006.
Huneeus, N., Schulz, M., Balkanski, Y., Griesfeller, J., Prospero, J., Kinne, S., Bauer, S., Boucher, O., Chin, M., Dentener, F., Diehl, T., Easter, R., Fillmore, D., Ghan, S., Ginoux, P., Grini, A., Horowitz, L., Koch, D., Krol, M. C., Landing, W., Liu, X., Ma-howald, N., Miller, R., Morcrette, J.-J., Myhre, G., Penner, J., Perlwitz, J., Stier, P., Takemura, T., and Zender, C. S.: Global dust model intercomparison in AeroCom phase I, Atmos. Chem. Phys., 11, 7781–7816, doi:10.5194/acp-11-7781-2011, 2011. Huneeus, N., Boucher, O., and Chevallier, F.: Atmospheric
inver-sion of SO2 and primary aerosol emissions for the year 2010, Atmos. Chem. Phys., 13, 6555–6573, doi:10.5194/acp-13-6555-2013, 2013.
Iversen, J. D. and White, B. R.: Saltation threshold on Earth, Mars and Venus, Sedimentology, 29, 111–119, 1982.
Janjic, Z. I.: The step-mountain eta coordinate model: further developments of the convection, viscous sublayer, and tur-bulence closure schemes, Mon. Weather Rev., 122, 927–945, doi:10.1175/1520-0493(1994)122<0927:TSMECM>2.0.CO;2, 1994.
Jickells, T. D., An, Z. S., Andersen, K. K., Baker, A. R., Berga-metti, G., Brooks, N., Cao, J. J., Boyd, P. W., Duce, R. A., Hunter, K. A., Kawahata, H., Kubilay, N., laRoche, J., Liss, P. S., Mahowald, N., Prospero, J. M., Ridgwell, A. J., Tegen, I., and Torres, R.: Global iron connections between desert dust, ocean biogeochemistry, and climate, Science, 308, 67–71, 2005. Jiménez, E., Linares, C., Martínez, D., and Díaz, J.: Role of Saharan
dust in the relationship between particulate matter and short-term daily mortality among the elderly in Madrid (Spain), Sci. Total Environ., 408, 5729–5736, doi:10.1016/j.scitotenv.2010.08.049, 2010.
Kalenderski, S., Stenchikov, G., and Zhao, C.: Modeling a typical winter-time dust event over the Arabian Peninsula and the Red Sea, Atmos. Chem. Phys., 13, 1999–2014, doi:10.5194/acp-13-1999-2013, 2013.