Discriminatory attitudes between ridesharing passengers
The MIT Faculty has made this article openly available. Please sharehow this access benefits you. Your story matters.
Citation Middleton, Scott and Jinhua Zhao. "Discriminatory attitudes between ridesharing passengers." Transportation (June 2019): dx.doi.org/10.1007/s11116-019-10020-y © 2019 Springer Science +Business Media, LLC
As Published http://dx.doi.org/10.1007/s11116-019-10020-y Publisher Springer Science and Business Media LLC Version Author's final manuscript
Citable link https://hdl.handle.net/1721.1/127180
Terms of Use Creative Commons Attribution-Noncommercial-Share Alike Detailed Terms http://creativecommons.org/licenses/by-nc-sa/4.0/
Discriminatory Attitudes Between Ridesharing Passengers
Scott Middleton, Jinhua Zhao∗ Massachusetts Institute of Technology 77 Massachusetts Avenue, Cambridge, MA 02139
Abstract
Prior studies have provided evidence of discrimination between drivers and passengers in the context of ridehailing. This paper extends prior research by investigating passenger-to-passenger discriminatory attitudes in the context of ridesharing. We conducted a survey of 1,110 Uber and Lyft users in the US using Mechanical Turk, 76.5% of whom have used uberPOOL or Lyft Shared rides, and estimated two structural equation models. The first model examines the influence of one’s demographic, social and economic characteristics on discriminatory attitudes toward fellow passengers in ridesharing, and how such influence varies by the targets of discrimination (i.e., race and class). The second model examines the influence of one’s generic social dominance orientation on discriminatory attitudes in the ridesharing context. We find that discriminatory attitudes toward fellow passengers of differing class and race in the shared ride are positively correlated with respondents that are male or are women with children. A respondent’s race does not have a significant effect on discriminatory attitudes, but white respondents that live in majority white counties are more likely to hold discriminatory attitudes with regard to race (no effect is observed regarding class preferences). The same is true of respondents that live in counties in which a larger share of the electorate voted for the Republican candidate in the 2016 presidential election. Conversely, higher-income respondents appear more likely to hold discriminatory attitudes regarding class, but no effect is observed regarding racial preferences. We also find that one’s generic social dominance orientation strongly influences his/her discriminatory attitudes in ridesharing, supporting the claim that behavior in shared mobility platforms reflects long-standing social dominance attitudes. Further research is required to identify policy interventions that mitigate such attitudes in the context of ridesharing.
Keywords: ridesharing, discrimination, social dominance, Transportation Network
Companies (TNCs), class, race
∗
Corresponding author
1. Introduction 1
Prior studies have provided evidence for driver-to-passenger discrimination in the con-2
text of ridehailing services provided by transportation network companies (TNCs) like 3
Lyft and Uber. Seminal research by Ge et al. (2016), for example, provided experimen-4
tal evidence that the design of Uber and Lyft’s platforms allows for discrimination from 5
individual drivers to riders (Ge et al., 2016). Recent research from UCLA, however, has 6
argued that TNC services have nearly eliminated racial and ethnic differences in service 7
quality, relative to the taxicab industry (Brown, 2018). 8
Though lacking the experimental approach of Ge et al. and of Brown, other recent 9
studies have highlighted the theoretical case for rider-to-driver discrimination in TNCs. 10
Rosenblat et al. (2017) used a review of consumer behavior in online marketplaces and 11
performance evaluations in managerial settings to argue that racial and gender bias is likely 12
to influence TNC driver evaluations (Rosenblat et al., 2017). If real, discriminatory ratings 13
would be problematic because bias in ratings could lead to discriminatory termination 14
practices by Uber. This is because the company’s "star rating" system determines whether 15
a driver can maintain access to the platform; Uber terminates drivers whose overall star 16
rating scores fall below a certain cutoff for their market (roughly 4.6). In fact, one 17
Uber driver has already filed a U.S. Equal Employment Opportunity Council complaint 18
on the grounds that discriminatory reviews cost him access to Uber’s platform (Adams, 19
2016). Additionally, one recent legal paper even proposed a rule that would obligate large 20
companies in the sharing economy to reduce or eliminate harm arising from customer 21
bias against their employees, as an extension of these companies’ legal obligation not to 22
discriminate themselves (Bartlett and Gulati, 2016). Together, these studies and legal cases 23
highlight the possibility of discrimination between drivers and riders in the context of 24
ridehailing. 25
At the same time, many rides provided by TNCs involve not just one driver and one 26
rider, but also a second or third rider sharing the same ride through the ridesharing 27
products uberPOOL and Lyft Shared rides (formerly known as Lyft Line). These products, 28
introduced in 2014, are a special category of traditional ridehailing services (e.g., Lyft 29
Classic, uberX, uberBLACK) in which multiple riders (or rider parties) are paired with a 30
single driver to reduce the cost of providing the rides. While the terms "ridehailing" and 31
"ridesharing" are often used interchangeably, this paper holds that these two terms have 32
distinct meanings and uses them accordingly. 33
With uberPOOL and Lyft’s Shared rides, rider-rider discrimination is also plausible. 34
However, no studies to date have provided evidence of rider-rider discriminatory attitudes 35
in the context of dynamic ridesharing. Additionally, no studies have yet considered the 36
variation of discriminatory attitudes in accordance with ridesharing user characteristics. 1
To address these gaps in the literature, this paper provides an empirical assessment of the 2
discriminatory attitudes among various social groups in cities with access to the dynamic 3
ridesharing services uberPOOL and Lyft Shared. 4
To answer these questions, this paper examines class- and race-related discriminatory 5
attitudes between fellow passengers in shared rides. We conducted a survey of 1,110 TNC 6
users in the US using Mechanical Turk, 76.5% of whom have used uberPOOL or Lyft 7
Shared, and estimated two structural equation models to examine 1) the influence of one’s 8
demographic, social and economic characteristics on discriminatory attitudes toward fellow 9
passengers in ridesharing, and how such influence varies by the targets of discrimination 10
(i.e., race and class); and 2) the influence of one’s generic social dominance orientation 11
(SDO) on discriminatory attitudes in the ridesharing context. The term "social dominance 12
orientation" refers to an individual’s preferences for group-based discrimination, social 13
hierarchy, and domination over lower-status groups, measured according to well-established 14
scales long used in social psychology literature (Ho et al., 2015). This measure is included 15
in this paper in order to estimate the direct and indirect effects of social dominance 16
preferences on discriminatory attitudes in the setting of a shared ride. The inclusion of 17
social dominance orientation helps determine the extent to which discriminatory attitudes 18
in ridesharing present a new phenomenon enabled by this new form of travel, or conversely 19
the extent to which the old phenomenon of prejudice is absent from ridesharing, even 20
among those with strong social dominance orientations. The results of these inquiries may 21
help inform decisions by TNCs and policymakers as they seek to foster positive social 22
interactions between riders and limit the ability of passengers to avoid or discriminate 23
against one another on the basis of race and class. 24
Section 2 of this paper provides background on discrimination and shared mobility. 25
Sections 2.1 and 2.2 summarize the literature on discrimination in ridehailing and the rise 26
of dynamic ridesharing respectively. Section 3 explains the data collected for this study 27
and presents two structural equation models created to analyze discriminatory attitudes in 28
ridesharing. The paper then presents seven key findings from these models and Section 29
4 summarizes the behavior and policy implications of these findings. Finally, Section 5 30
summarizes the research and elaborates on practical steps that TNCs and cities may take 31
to prevent users from acting on discriminatory attitudes in the various contexts in which 32
Lyft and Uber operate. 33
2. Discrimination and Shared Mobility 34
Before exploring the possibility of discrimination in ridesharing, it is necessary to 35
briefly consider discrimination in the context of ridehailing more broadly. To that end, 36
the following section summarizes the existing evidence of discrimination in the ridehailing 1
industry. The subsequent subsection provides a brief introduction to dynamic ridesharing. 2
2.1. Evidence of Discrimination in Ridehailing
3
Empirical studies and theoretical discussions have suggested the possibility for discrim-4
ination in the context of shared mobility. Arguably, such discrimination is a continuation 5
of the related phenomenon of discrimination in the taxicab industry, both from driver to 6
rider and vice versa. In a famous 1989 study, Ridley et al. demonstrated experimentally 7
that black passengers seeking to hail a taxi from the street were seven times more likely 8
to be passed than white passengers in Washington, D.C. This finding has been replicated 9
and verified in many other studies (Ridley et al., 1989, Siegelman, 1998, Ambinder, 1995). 10
These claims are in keeping with the popular perception of discriminatory cab drivers. A 11
2000 poll, for example, found that 43 percent of African-Americans surveyed believe taxi 12
drivers avoid picking up black passengers and 18 percent reported that they themselves have 13
been refused a ride (Ayres et al., 2004, p. 1633). In the taxicab industry, rider-to-driver 14
discrimination is also plausible; Ayres surveyed taxi driver receipts and provided evidence 15
that black cab drivers receive approximately 1/3 less in tips than white drivers (Ayres et al., 16
2011). 17
In addition to the history of discrimination in the industry that TNCs are currently 18
disrupting, studies showing discrimination in other online platforms provide another cause 19
for concern. The anonymity of online marketplaces, for example, has not eliminated 20
discrimination from platforms like eBay, Craigslist, online lending platforms, or job boards 21
(Ayres et al., 2011, Doleac and Stein, 2013, Pope and Sydnor, 2011, Hanson et al., 2016, 22
Nunley et al., 2014). Furthermore, the growing importance of the sharing economy has 23
led researchers to begin applying experimental studies of discrimination in this space, 24
including the short-term housing rental service AirBnB. Edelman & Luca demonstrated 25
that requests from AirBnB guests with distinctively African-American names are less likely 26
to be accepted than identical guests with distinctively white names, closely paralleling the 27
phenomenon of Uber driver cancellations identified by Ge et al. (Edelman and Luca, 28
2016). Similarly, Hannak et al. conducted a review of worker profiles in the freelance 29
labor platforms TaskRabbit and Fiverr that identified correlations between gender/race 30
and worker ratings, position in searches, and customer reviews (Hannak et al., 2017). 31
Finally, Thebault conducted a survey of TaskRabbit workers in the Chicago metropolitan 32
area and found that workers were less likely to accept requests from customers in the 33
city’s socioeconomically disadvantaged South Side (Thebault-Spieker et al., 2015, p. 272). 34
Together such studies provide evidence from related industries and platforms that justifies 35
careful consideration of discrimination in TNCs. 36
Nontheless, the TNCs themselves argue that they offer a solution to such discrimination. 37
Uber in particular has claimed that it reduces discrimination relative to taxicabs, arguing 1
that 50 percent of Uber trips in Chicago begin or end in underserved neighborhoods 2
(measured in terms of median neighborhood income) (Kalanick, 2016). The company also 3
boasts that it offers considerably more service to New York City’s outer boroughs than 4
traditional taxis (MacDonald, 2014). Naturally claims defending a private company’s own 5
practices must be taken with a grain of salt. Nonetheless, ridehailing could, in theory, solve 6
the problem that people of color often face in hailing taxicabs by adding anonymity to the 7
hailing process, by allowing riders to poorly rate rude drivers, and by assuring drivers of 8
prompt payment from the riders’ credit cards. Indeed, a 2016 survey by the Pew Research 9
Center revealed that a majority of ridehailing users believe that TNCs serve neighborhoods 10
that taxis do not (Smith, 2016, p. 30). Furthermore, a rising tide may lift all boats; Rayle 11
and Cervero offered evidence that riders in San Francisco experience significantly shorter 12
wait times for shared rides than taxi services, regardless of their personal characteristics 13
(Rayle et al., 2014). 14
On a similar note, Li and Zhao used a series of interviews with stakeholders in the 15
taxicab industry to suggest that taxi-hailing (e-hail) apps have the potential to improve 16
rider-driver relationships by enhancing accountability and safety (Li and Zhao, 2015). 17
This paper also argued that these apps humanize these relationships by directly connecting 18
passengers and drivers one pair at a time, thereby emphasizing the fact that there is a person 19
at the other end of the app (relative to traditional means of taxi dispatch). The availability 20
of names, ratings, and photos further humanizes this experience. While this paper focused 21
on e-hailing apps rather than TNCs, many of these humanizing features also characterize 22
ridehailing services. 23
Despite these possible improvements over the conventional taxi industry, it is certainly 24
possible that the forms of discrimination prevalent in the traditional economy also affect 25
the shared mobility economy. TNC riders, for example, are vulnerable to discrimination 26
because drivers can reject or avoid them without offering any explanation (Wortham, 27
2014). However, demonstrating such discrimination is difficult. Uber may rightly claim, 28
for example, that drivers cannot access riders’ photographs or full names until they accept 29
a ride, and thus cannot truly discriminate (although Uber drivers do see this information 30
after accepting a ride, and Lyft drivers have access to this information before accepting, 31
as of this writing). Testing such theories through statistical analysis is difficult because 32
user data are not typically available for research. Furthermore, relatively little case law has 33
examined the problem of discrimination or civil rights violations in the platform economy 34
to date. 35
However, scholars are beginning to investigate discrimination in ridehailing. Thebault-36
Spieker et al., for example, used anecdotal evidence to suggest that TNC drivers may 37
avoid low-income areas through a type of ridesharing "redlining" that leads to less service 38
and higher prices in these neighborhoods (Thebault-Spieker et al., 2015). More recently, 1
Hughes and MacKenzie provided initial evidence that this is not the case; ridesharing 2
wait times may even be lower in low-income and minority neighborhoods (Hughes and 3
MacKenzie, 2016). 4
At a higher level, TNCs have also faced criticism that their official coverage areas 5
are discriminatory1, but in recent years the scale of their coverage areas has increased 6
dramatically enough to nullify that argument. In August 2017, Lyft, for example, expanded 7
its coverage to the entirety of 40 U.S. states and 94 percent of the U.S. population (Lyft, 8
2017b). Uber’s coverage is smaller, but still substantial. Furthermore, within a specific 9
coverage zone, service is comprehensive: Brown found that Lyft alone serves areas home 10
to 99.8 percent of Los Angeles County (Brown, 2018, p. 3). 11
Although geographic discrimination may be minimal, the previously mentioned re-12
search from Ge et al. (2016) used two field experiments in Seattle and Boston to demon-13
strate significant difference in wait times and cancellations for otherwise identical riders 14
with African American-sounding and white-sounding names, irrespective of the charac-15
teristics of the driver. The study also demonstrated that Uber and Lyft drivers take female 16
riders for longer and more expensive rides than male riders. More recent research from 17
Brown used an audit study of ridehailing and taxi services to assess how wait times and 18
cancellation rates vary by rider race, ethnicity, or gender in Los Angeles County. The 19
study found significant evidence of discrimination against black riders by taxi drivers, but 20
dramatically lower racial and ethnic service gaps in ridehailing (Brown, 2018, p. 123-132). 21
These studies represent the most significant analysis of discrimination in TNCs to date. 22
Given the findings of these studies, there is good cause to broaden our analysis of 23
discriminatory practices in the context of ridehailing. As demonstrated above, existing 24
research has largely focused on the effect of discrimination from drivers to riders, in part due 25
to the long history of such discrimination in transportation and other sectors. Additionally, 26
much research on the sharing economy concentrates primarily on racial discrimination 27
from whites to blacks. While these forms of discrimination certainly warrant scholarly 28
attention, it is important to consider the many other forms of discrimination that may exist 29
in shared mobility. To that end, this paper seeks to fill existing research gaps through a 30
more inclusive approach to understanding discrimination that includes a broader range of 31
sociodemographic characteristics (i.e., race, class, gender, age, education, etc.) and new 32
directions of discrimination, particularly between riders in dynamic ridesharing services 33
like uberPOOL and Lyft Shared. 34
1In 2014 Uber faced criticism that its coverage area in the Dallas-Forth Worth metro area included wealthy
2.2. Dynamic Ridesharing
1
Ridesharing, in the form of carpooling or vanpooling, has existed for decades. Infor-2
mal forms of ridesharing, such as Morocco’s grands taxis and other forms of shared rides, 3
have long been common across the world. Although it has always promised door-to-door 4
service, lower per-passenger travel costs, and congestion reduction, traditional carpooling 5
has been at best marginally successful in the United States. Several studies have argued 6
that carpooling has failed to gain traction since the 1970s due to high household vehicle 7
availability, falling real fuel costs, and continued suburbanization (Ferguson, 1997, Oppen-8
heim, 1979, Pisarski, 1987). Nonetheless many studies have analyzed traditional carpool 9
programs in order to inform policies that might increase carpooling. To that end, a seminal 10
1977 study of employers carpooling programs argued that the most important barriers to 11
ridesharing were 1) the habit of private driving and 2) the resistance to initiating contact 12
and starting a carpool (Dueker et al., 1977, p. 688). 13
The arrival of the dynamic ridesharing products uberPOOL and Lyft Line in 2014 14
challenged these two barriers to carpooling: reluctance to give up individual driving and 15
resistance to initiating contact with strangers. Regarding the former, the critical importance 16
of individual car use seems to be eroding in light of TNCs, car-sharing services, and 17
broader cultural shifts. Studies have, for example, presented evidence that Americans 18
(particularly "Millenials," born in the 1980s and 1990s) are less likely to own cars than 19
previous generations (Klein and Smart, 2017). While many studies have argued that this 20
trend may reverse as Millenials age, the fact remains that travel behavior has changed 21
(Newbold and Scott, 2017, Delbosc, 2017). Regarding the second barrier to carpooling, 22
new rider-rider matching algorithms have made it easier for riders to initiate contact with 23
one another through efficient and convenient platforms. While conventional carpooling 24
matching programs focused largely on the daily commute, ridesharing algorithms now offer 25
appealing on-the-fly and round-the-clock connections. Relative to traditional carpooling, 26
dynamic ridesharing technology also offers greater accountability and convenience, as well 27
as the possibility for wider social connections. 28
As a result of these evolutions, TNC rides now often involve one driver and multiple 29
riders sharing the same ride. The services uberPOOL and Lyft Shared rides operate much 30
like these companies’ more traditional ridehailing products, such as uberX. Riders input 31
their locations and destinations and their app then displays the price for a solo ride, as well 32
as a discounted price for a pooled ride. In the case of Uber and Lyft apps, the uberPOOL 33
and Lyft Shared options are the default choice for users as of this writing. Riders choosing 34
the pool option may ultimately be the only rider to use the service, or they may encounter 35
second or third pick-ups, although they pay the same price regardless of whether the ride is 36
shared. Once a shared ride is underway, the driver may receive a notification that there is 37
another passenger nearby with a geographically similar location. While drivers can decline 38
this pickup, doing so can lower their ratings, and so each request is likely to be accepted. 1
The exact share of TNC rides taken through uberPOOL or Lyft Shared is not known,2but 2
it is clear that these services constitute a major portion of all ridehailing trips. 3
Of course, additional passengers increase the overall trip time for riders, creating the 4
potential for frustration on the part of passengers. Due to the potential of delaying other 5
riders, Uber and Lyft both ask that their riders be considerate toward one another. Uber’s 6
website asks POOL users to be ready to go before their driver arrives (Uber, 2017b). 7
Lyft’s website goes one step further, encouraging Shared users to be considerate with their 8
baggage and to be mindful of language and conduct (Lyft, 2017a). However, as of this 9
writing, neither Lyft nor Uber offer the option for riders to rate the conduct of other riders. 10
In response to these major developments in ridesharing, recent research at MIT inves-11
tigated ridesharing users’ perceptions, positive and negative, of sharing time and space 12
with strangers in the backseat of a car (Sarriera et al., 2016). The paper To Share or 13
Not to Share: Investigating the Social Aspects of Dynamic Ridesharingused a survey of
14
TNC users across the United States to explore how people experience the social aspects 15
of ridesharing. This survey data provides the foundation of this paper, and is described in 16
greater detail in Section 3.1. 17
Among other preliminary findings, the research from Sarriera et al. indicated that many 18
riders harbor discriminatory attitudes towards passengers of different social class and race. 19
What’s more, these passengers seem to prefer additional early information about these 20
future passengers, thus supporting earlier research arguing that a lack of information about 21
potential passengers was a barrier to acceptance of ridesharing (Kearney and De Young, 22
1995). Given the findings of this paper, it is conceivable that rider-rider discrimination 23
could emerge as a critical issue in the future. While drivers, as a third party, may currently 24
moderate the rider-rider relationship, these interactions will become more prominent as 25
driverless, autonomous ridesharing platforms become more ubiquitous.3 Without a driver, 26
passengers will need to establish trust and accountability among one another, necessitating 27
interventions to improve rider-rider interactions. This relationship can evolve in one of 28
two ways: ridesharing users may avoid passengers they don’t like or TNCs may mitigate 29
2While the popularity of Lyft Shared or uberPOOL relative to these company’s other products is not
known, Lyft claimed, for example, that Lyft Shared rides account for 40 percent of the company’s total rides in cities where it was available in 2016 (Hawkins, 2016a). Brown’s research on Lyft trip-level data revealed that Lyft Shared accounts for nearly 30 percent of all Lyft trips in Los Angeles County (Brown, 2018, p. 46).Uber, meanwhile, has claimed that it is as high as 90 percent in high-traffic areas during commuting hours (Uber, 2017a).
3While the arrival of fully autonomous ridesharing services is uncertain, there is great interest on the part
of TNCs in this possibility. Uber piloted self-driving fleets in Pittsburgh from 2016 to 2018 and Lyft has announced its intention to offer the majority of its rides in self-driving cars by 2021 (Hawkins, 2016b).
discrimination and encourage positive social interactions between riders. However, efforts 1
to build passenger-to-passenger rapport and ensure accountability, trust, and positive con-2
nections are still a new domain for research. By evaluating discriminatory attitudes in the 3
shared ride, the current paper represents a first step in this effort. 4
Additionally, several studies have investigated attitudes such as drivers’ willingness 5
to interact with strangers and their desire for autonomy and convenience, but few have 6
considered the potentially discriminatory aspects of carpooling and dynamic ridesharing. 7
Chaube et al., for example, determined that lack of trust deters riders from offering or 8
accepting shared rides (Chaube et al., 2010). Deloach and Tiemann investigated the 9
effect of personality type (i.e., introvert, extrovert), marital status, and other factors on 10
willingness to carpool and found that the desire for socialization can affect ridesharing. 11
This paper also found a significant relationship between personal characteristics like gender 12
and the perceived need for autonomy and flexibility in ridesharing (DeLoach and Tiemann, 13
2012, p. 533-535). By extension, additional research could determine whether there is a 14
relationship between personal characteristics and discriminatory attitudes in the ridesharing 15
context. The current paper intends to fill that research gap. 16
3. Modeling Discriminatory Attitudes in Ridesharing 17
In light of the discussion above, the following section reviews and analyzes the results 18
of Sarriera et al.’s national survey of Uber and Lyft users. Section 3.1 describes the dataset 19
in greater detail. Sections 3.2 and 3.3 then describe and model users’ attitudes toward 20
potential fellow passengers and discuss their discriminatory attitudes in the context of 21
ridesharing. 22
3.1. Data
23
Sarriera et al. conducted the survey in June and July 2016. The researchers built 24
the survey with the online survey development service Qualtrics, which allowed them to 25
present multiple question types in a user-friendly interface for survey-takers. 26
The researchers distributed the survey through Amazon Mechanical Turk, a crowd-27
sourcing service that allows researchers to compensate human workers to perform specific 28
tasks, including completing survey questions. Mechanical Turk was chosen for this task 29
because it offered a cost-effective means of recruiting survey takers with the desired 30
characteristics (i.e., use of Lyft and Uber, access to uberPOOL and Lyft Shared, broad 31
sociodemographics). 32
One limitation of the use of Mechanical Turk for this task was the possibility that the 33
survey takers may be incentivized to complete surveys quickly and without thought. As 34
such, the researchers screened such behavior through two basic attention check questions 35
(e.g., "Please select ’Agree’ for this question"). For this research, we also applied five further 1
tests of attention and logical consistency to the completed responses (e.g., a respondent 2
should not strongly agree with one preference and also with the opposite preference). 3
Responses that failed two or more of the five additional tests were omitted from analysis, 4
as were any respondents that reported zero Uber or Lyft trips in the past month. Of 1,222 5
qualified respondents who completed the survey, 112 failed the attention tests.4 The final 6
sample size of the analysis was 1,110 respondents, 841 of whom had previously used 7
dynamic ridesharing. 8
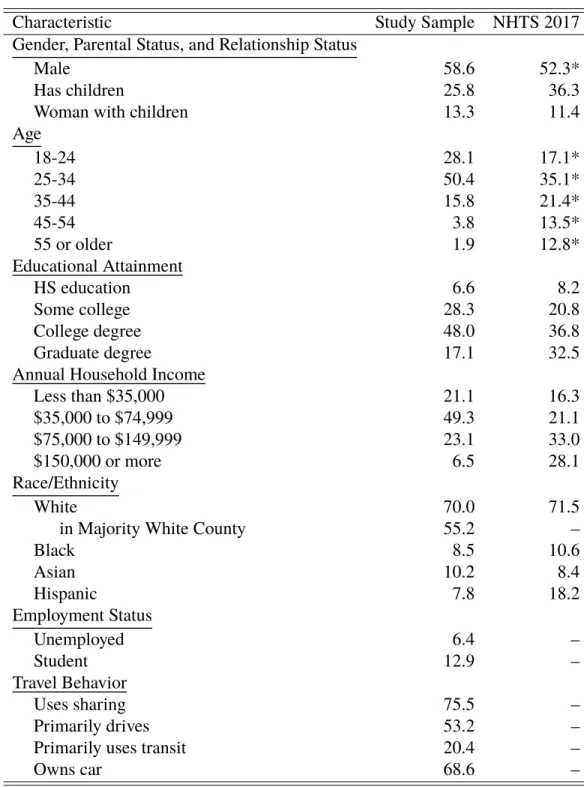
Table 1 presents an overview of respondent demographics.5 As shown in Table 1, the 9
survey respondents were relatively young, male, white, and educated in comparison to 10
the American population. These characteristics largely coincide with the characteristics 11
of Mechanical Turk users more broadly (Ipeirotis, 2010). Compared to the population of 12
TNC users, the respondents were fairly representative with regard to gender and race. For 13
comparison, of respondents to the 2017 National Household Travel Survey (NHTS) who 14
used ridehailing at least once in the past month, 52.3 percent were male and 71.5 percent 15
were white, compared with 58.6 percent and 70.0 percent in the study sample (FHWA, 16
2018). The sample was less representative with regard to age (with an overrepresentation 17
of those in the 25 to 34 year old age band), education (with an underrepresentation 18
of graduate degrees), and income (with an overrepresentation of those in the $35,000 19
to $74,999 income band). For other characteristics of respondents (e.g., employment 20
status, car ownership), information on rideshare users was not available from NHTS. 21
Geographically, most respondents were in the metropolitan areas of Los Angeles, New 22
York City, Chicago, San Francisco, Boston, Philadelphia, Washington, D.C., Atlanta, and 23
Miami, which accurately represents the markets in which dynamic ridesharing technology 24
first arrived and still sees heavy use. 25
4This translates to a failure rate of roughly 8.4 percent. For comparison, a 2015 study of research
participant attentiveness found that found that participants from Mechanical Turk passed an instructional manipulation check (a measure of attentiveness to instructions) at a rate of 94 percent (Hauser and Schwarz, 2015). The authors found this rate to be significantly higher than supervised undergraduates at the majority of college test sites.
5Explanation of demographics: Male = whether the respondent is male; Has children = whether the
respondent lives with 1 or more children; Woman with children = interaction term indicating whether a respondent is a woman living with a child; HS Education/Some College/College Degree/Graduate degree = a respondent’s highest level of education; White/Black/Asian/Hispanic = a respondent’s reported race or ethnicity (respondents were allowed to choose only one race or ethnicity, other survey options are not reported here, including "more than one race"); Unemployed = whether a respondent is unemployed, Students = whether a respondent is currently a student; Primarily drives/uses transit = the respondent’s primary model of travel; Owns car = whether a respondent owns a car
Table 1: Demographics of respondents (n=1110), compared with 2017 NHTS respondents over 18 who have used Uber or Lyft at least once in the past month
Characteristic Study Sample NHTS 2017
Gender, Parental Status, and Relationship Status
Male 58.6 52.3*
Has children 25.8 36.3
Woman with children 13.3 11.4
Age 18-24 28.1 17.1* 25-34 50.4 35.1* 35-44 15.8 21.4* 45-54 3.8 13.5* 55 or older 1.9 12.8* Educational Attainment HS education 6.6 8.2 Some college 28.3 20.8 College degree 48.0 36.8 Graduate degree 17.1 32.5
Annual Household Income
Less than $35,000 21.1 16.3 $35,000 to $74,999 49.3 21.1 $75,000 to $149,999 23.1 33.0 $150,000 or more 6.5 28.1 Race/Ethnicity White 70.0 71.5
in Majority White County 55.2 –
Black 8.5 10.6 Asian 10.2 8.4 Hispanic 7.8 18.2 Employment Status Unemployed 6.4 – Student 12.9 – Travel Behavior Uses sharing 75.5 – Primarily drives 53.2 –
Primarily uses transit 20.4 –
Owns car 68.6 –
3.2. Descriptive Statistics
1
In addition to basic demographics, the survey posed questions in the following cat-2
egories: general travel behavior; opinion on and experience with uberPOOL and Lyft 3
Shared; generic attitude toward social dominance (referenced in Section 3.3); and specific 4
preferences with respect to being paired with people of different backgrounds in shared 5
rides. Six attitudinal questions within this last category are of special interest to this paper 6
because they assess the existence of and potential for discrimination in ridesharing services 7
through stated preferences.6 These six questions are: 8
9
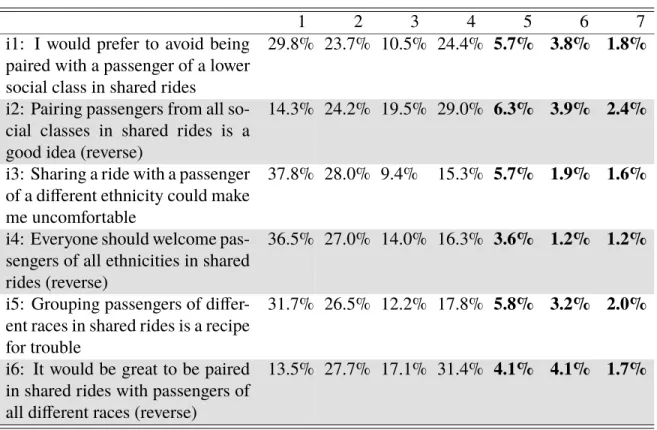
Class 10
• i1: I would prefer to avoid being paired with a passenger of a lower social class in 11
shared rides 12
• i2: Pairing passengers from all social classes in shared rides is a good idea (a 13
"reverse" preference, i.e., more agreement indicates a less discriminatory attitude) 14
Race7 15
• i3: Sharing a ride with a passenger of a different ethnicity could make me uncom-16
fortable 17
• i4: Everyone should welcome passengers of all ethnicities in shared rides (reverse) 18
• i5: Grouping passengers of different races in shared rides is a recipe for trouble 19
• i6: It would be great to be paired in shared rides with passengers of all different races 20
(reverse) 21
6The survey asked users three Likert-scale questions related to the gender of fellow passengers in a shared
ride ("Grouping men and women in shared rides is a recipe for trouble"; "Shared rides are as safe for women as they are for men"; and "Women should avoid sharing rides with strangers"). While roughly parallel to questions i1 through i6, these questions are excluded from further analysis. This paper does not define gender-based preferences as "discriminatory attitudes" because gender preferences may reflect legitimate safety concerns on the part of females regarding ridesharing with male strangers in a confined, private space. As such, we make no judgment on the desirability of such attitudes, and for that reason we did not include such attitudes in the factors we create for race- or class-based discriminatory attitudes, which we consider strictly undesirable.
7While each of these four questions focuses either on race or ethnicity, in practice it is difficult to
differentiate the two phenomenon in measurement and modeling, so they are combined for the purposes of this paper and referred to as racial or race preferences.
The survey asked respondents to indicate their agreement to these and other preferences 1
according to a seven-step Likert scale (i.e., opinion statements from "strongly disagree" 2
to "strongly agree"). Table 2 provides an overview of responses to discriminatory prefer-3
ence questions. Table 2 reveals that, in general, a small but significant minority explicitly 4
expressed discriminatory attitudes (i.e., 6.0 to 12.6 percent, depending on the attitude and 5
the characteristics of the respondents). These stated preferences offer powerful insight, but 6
are likely to under represent the prevalence of discriminatory attitudes due to social desir-7
ability bias (Pager, 2008). However, despite the limitations of measuring discriminatory 8
attitudes through such stated preference surveys, these descriptive statistics suggest that 9
such attitudes do indeed exist within the population of Lyft and Uber users. 10
Table 2: Preferences of respondents, from "Strongly Disagree" (1) to "Strongly Agree" (7). Di-rectionality reversed so that higher numbers indicate more discriminatory attitudes, with discriminatory preferences presented in bold. n=1110
1 2 3 4 5 6 7
i1: I would prefer to avoid being paired with a passenger of a lower social class in shared rides
29.8% 23.7% 10.5% 24.4% 5.7% 3.8% 1.8%
i2: Pairing passengers from all so-cial classes in shared rides is a good idea (reverse)
14.3% 24.2% 19.5% 29.0% 6.3% 3.9% 2.4%
i3: Sharing a ride with a passenger of a different ethnicity could make me uncomfortable
37.8% 28.0% 9.4% 15.3% 5.7% 1.9% 1.6%
i4: Everyone should welcome pas-sengers of all ethnicities in shared rides (reverse)
36.5% 27.0% 14.0% 16.3% 3.6% 1.2% 1.2%
i5: Grouping passengers of differ-ent races in shared rides is a recipe for trouble
31.7% 26.5% 12.2% 17.8% 5.8% 3.2% 2.0%
i6: It would be great to be paired in shared rides with passengers of all different races (reverse)
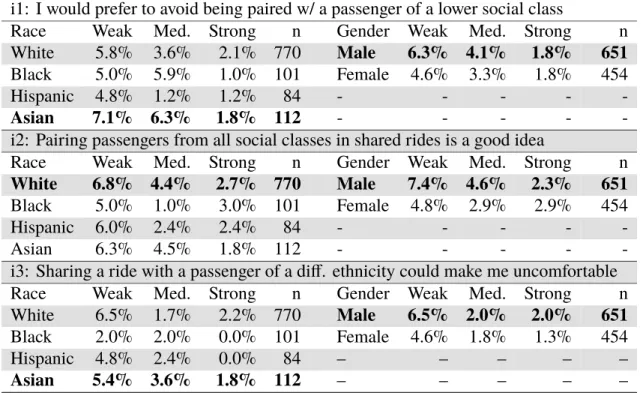
Table 3 presents a series of bivariate cross-tabulations between demographics (partic-1
ularly race and gender) and responses to the six survey questions related to discrimination 2
and ridesharing (omitting anti-discriminatory or neutral attitudes). This table suggests sev-3
eral simple correlations. Notably, a greater share of white or Asian respondents agree with 4
discriminatory statements such as "Sharing a ride with a passenger of a different ethnicity 5
could make me unconformable," relative to black or Hispanic respondents. Furthermore, 6
the relative responses of men and women suggest that more men in our sample agree with 7
the discriminatory statements. 8
Furthermore, a Mann-Whitney-Wilcoxon test revealed that different groups of riders 9
have significantly different answers to these questions. In particular men and women are 10
nonidentical populations (at the .01 significance level) for all preferences. White and 11
nonwhite respondents are nonidentical populations for preferences i3 and i4; black and 12
non-black respondents for preferences i2, i3, i4, and i6. Given these findings, the structural 13
equation models presented in the following section examine the variations of discriminatory 14
attitudes and the relationship between such attitudes and one’s social dominance orientation. 15
Table 3: Cross-tabulations: Discriminatory preferences by gender/race. For each preference, the gender/race with the greatest agreement with discriminatory preferences is shown in bold.
i1: I would prefer to avoid being paired w/ a passenger of a lower social class
Race Weak Med. Strong n Gender Weak Med. Strong n
White 5.8% 3.6% 2.1% 770 Male 6.3% 4.1% 1.8% 651
Black 5.0% 5.9% 1.0% 101 Female 4.6% 3.3% 1.8% 454
Hispanic 4.8% 1.2% 1.2% 84 - - - -
-Asian 7.1% 6.3% 1.8% 112 - - - -
-i2: Pairing passengers from all social classes in shared rides is a good idea
Race Weak Med. Strong n Gender Weak Med. Strong n
White 6.8% 4.4% 2.7% 770 Male 7.4% 4.6% 2.3% 651
Black 5.0% 1.0% 3.0% 101 Female 4.8% 2.9% 2.9% 454
Hispanic 6.0% 2.4% 2.4% 84 - - - -
-Asian 6.3% 4.5% 1.8% 112 - - - -
-i3: Sharing a ride with a passenger of a diff. ethnicity could make me uncomfortable
Race Weak Med. Strong n Gender Weak Med. Strong n
White 6.5% 1.7% 2.2% 770 Male 6.5% 2.0% 2.0% 651
Black 2.0% 2.0% 0.0% 101 Female 4.6% 1.8% 1.3% 454
Hispanic 4.8% 2.4% 0.0% 84 – – – – –
Asian 5.4% 3.6% 1.8% 112 – – – – –
Legend: Weak: Somewhat (dis)agree with (anti-)discriminatory (i.e., responses of 3 or 5)
i4: Everyone should welcome passengers of all ethnicities in shared rides
Race Weak Med. Strong n Gender Weak Med. Strong n
White 3.9% 0.6% 1.4% 770 Male 4.8% 1.7% 1.8% 651
Black 1.0% 2.0% 2.0% 101 Female 2.0% 0.4% 0.4% 454
Hispanic 6.0% 3.6% 0.0% 84 - - - -
-Asian 3.6% 2.7% 0.9% 112 - - - -
-i5: Grouping passengers of different races in shared rides is a recipe for trouble
Race Weak Med. Strong n Gender Weak Med. Strong n
White 5.8% 3.2% 2.5% 770 Male 6.3% 2.6% 2.3% 651
Black 5.9% 4.0% 1.0% 101 Female 5.1% 4.0% 1.5% 454
Hispanic 4.9% 0.0% 1.2% 84 - - - -
-Asian 7.1% 4.5% 0.9% 112 - - - -
-i6: It would be great to be paired in shared rides with pass. of all different races
Race Weak Med. Strong n Gender Weak Med. Strong n
White 4.0% 4.5% 1.6% 770 Male 4.8% 4.8% 2.2% 651
Black 3.0% 2.0% 1.0% 101 Female 3.3% 3.3% 1.1% 454
Hispanic 10.7% 2.4% 3.6% 84 - - - -
-Asian 1.8% 6.3% 2.7% 112 - - - -
-Legend: n: Number of Respondents; Weak: Somewhat (dis)agree with (anti-)discriminatory statement Medium: (Dis)agree; Strong: Strongly (dis)agree. Directionality of attitudes corrected.
3.3. Factor-Based Structural Equation Models
1
The following section presents conceptual models of self-reported discriminatory atti-2
tudes among various social groups. These factor-based structural equation models assess 3
the probability of a choice (i.e., the Likert-scale preferences described above) against ex-4
planatory variables (i.e., sociodemographic characteristics like age, gender, and income). 5
These models also include as explanatory variables additional information about re-6
spondents’ home counties: percentage of the population that is white and the percentage 7
of votes in a county for the GOP candidate in the 2016 presidential election.8 We included 8
these two environmental characteristics in our analysis to determine whether exposure to 9
diversity may reduce discriminatory attitudes (using the share of a population that is white 10
as a proxy for the overall diversity of an area) and whether discriminatory attitudes are 11
8Demographic information at the county level was collected from the U.S. Census Bureau’s 2015
Amer-ican Community Survey 5-year estimates, aggregated to the county level and paired with respondents based on their reported ZIP codes. County-level 2016 election results were collected from Townhall.com’s collated county-by-county election results, as scraped and formatted by data scientist Tony McGovern (McGovern, 2018).
more prevalent in certain geographies, particularly those with a more strongly Republican 1
population 2
This section presents two structural equation models (SEMs) that estimate latent factors 3
that combine observable covariate Likert-scale responses. The models then analyze the 4
relationships between the latent variables by combining measurement models and structural 5
models. In particular, these two models group indicators of discrimination into three 6
factors which we regress against the sociodemographic variables introduced above. The 7
three factors are: 8
• Race and Ethnicity Factor (F_Race): A simultaneous linear regression of the four 9
race-based preferences (i3, i4, i5, and i6), which have a Cronbach’s alpha of 0.842. 10
• Class Factor (F_Class): A simultaneous linear regression of the two class-based 11
preferences (i1 and i2), which have a Cronbach’s alpha of 0.682. 12
• Social Dominance Orientation Factor (F_SDO): A simultaneous linear regression 13
of eight additional Likert-scale questions measuring respondents’ preference for 14
social hierarchies and the domination of higher-status groups over lower-status groups 15
in general. These statements have a Cronbach’s alpha of 0.899. These statements 16
are: 17
– S1: Some groups of people must be kept in their place 18
– S2: Groups at the bottom are just as deserving as groups at the top ("reverse" 19
preference) 20
– S3: It’s probably a good thing that certain groups are at the top and other groups 21
are at the bottom 22
– S4: An ideal society requires some groups to be on top and others to be on the 23
bottom 24
– S5: Groups at the bottom should not have to stay in their place (reverse) 25
– S6: Some groups of people are simply inferior to other groups 26
– S7: No one group should dominate in society (reverse) 27
– S8: Group dominance is a poor principle (reverse) 28
Accounting for reverse-worded preferences and the number of items included in each 29
factor, each of these three factors has a reasonably strong Cronbach’s alpha measure. Addi-30
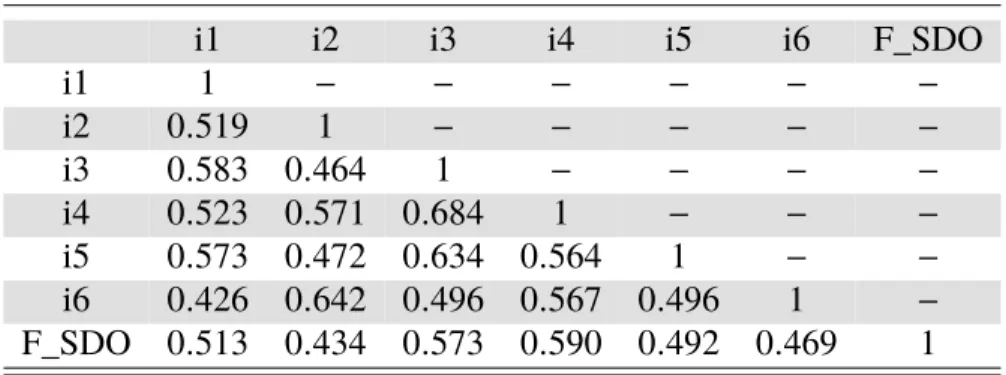
tionally, the correlations presented in Table 4 demonstrate consistent correlation among all 31
Likert-scale preferences, justifying various factor formulations. In keeping with the logical 32
similarity of the questions being grouped, it is reasonable to expect that these factors reveal 1
underlying latent variables manifested by the respective set of observed indicators. This 2
finding justifies the application of SEM and the creation of the continuous factor variables 3
listed above.9 4
Table 4: Table of Pearson correlation coefficients for SEM analysis. Preferences are corrected for positive or negative directionality. p<0.05 for all pairs
i1 i2 i3 i4 i5 i6 F_SDO i1 1 − − − − − − i2 0.519 1 − − − − − i3 0.583 0.464 1 − − − − i4 0.523 0.571 0.684 1 − − − i5 0.573 0.472 0.634 0.564 1 − − i6 0.426 0.642 0.496 0.567 0.496 1 − F_SDO 0.513 0.434 0.573 0.590 0.492 0.469 1
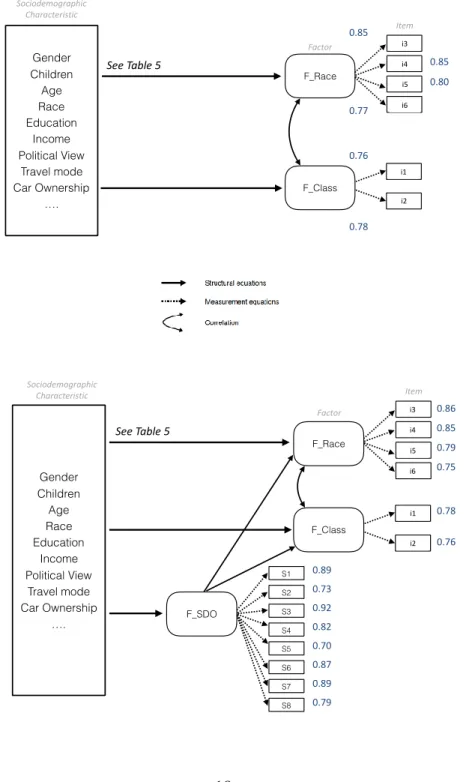
Figure 1 illustrates two structural equation models constructed in the software MPlus 5
Version 8. These models group observable discriminatory indicators (i.e., ridesharing 6
preference and social dominance orientation questions) into multiple latent factors (i.e., 7
F_Race, F_Class, and F_SDO). These factors are then regressed against sociodemographic 8
information about respondents. Rounded rectangles represent latent variables and square 9
rectangles represent measurement variables. 10
SEM Model 1 hypothesizes that sociodemographics can partly explain stated discrim-11
inatory preferences (as a stand-in for actual discriminatory behavior in ridesharing). The 12
hypothesis behind SEM Model 2 is that generic social dominance preferences influence 13
discriminatory preferences in the setting of a shared ride and that sociodemographics 14
correlate to both generic social dominance attitudes and ridesharing-specific attitudes. 15
9While researchers often perform SEM and confirmatory factor analysis using Likert-scale responses,
one limitation of such analysis is that it treats Likert-based scales as continuous data rather than continuous interval data. Nonetheless, this paper proceeds with the factors described above.
Figure 1: Hypothesized Structural Equation Models 1 (top) and 2 (bottom), with factor loadings presented next to the appropriate item in blue.
0.76 0.78 0.85 0.77 0.85 0.80 See Table 5 i1 i2 i3 i4 i5 i6 Sociodemographic Characteristic Item Factor 0.86 0.85 0.79 0.75 0.78 0.76 0.89 0.73 0.92 0.82 0.70 0.87 0.89 0.79 See Table 5 i1 i2 i3 i4 i5 i6 Sociodemographic Characteristic Item Factor
In addition to illustrating the overall configuration of SEM Models 1 and 2, Figure 1
1 also presents the estimates of the measurement equations in each model. These factor 2
loadings, presented next to the appropriate item, range from 0.75 to 0.86 for F_Class and 3
F_Race and from 0.70 to 0.92 for F_SDO. Each of these factor loadings has a p-value of 4
less than 0.01, and can be interpreted as indicating a strong association to the underlying 5
latent factors, with minimal variation among the items. 6
Both hypothesized models have reasonably strong indices of fit, as indicated in Table 7
5. Comparative fit indices (CFIs) of 0.97 and 0.963 respectively indicate that the models 8
exhibit good fit according to several general guidelines and recommendations (Bentler, 9
1990, MacCallum et al., 1996, Hu and Bentler, 1999). Similarly, the models also both 10
have high Tucker-Lewis indices (TLIs) of greater than 0.95. The 90 percent confidence 11
interval of the root mean square error of approximation, meanwhile, is 0.059-0.072 for 12
SEM Model 1 and 0.065-0.072 for SEM Model 2, indicating reasonable fit. As such, the 13
measures of fit are strong enough to obviate the need for post-hoc model modifications and 14
the hypothesized models appear to fit the data well enough to support the hypothesized 15
structure. 16
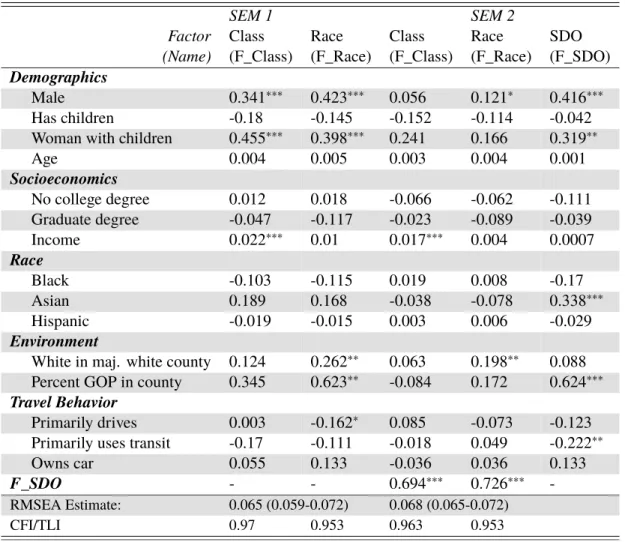
Table 5 also summarizes the standardized coefficients for the explanatory variables 17
included in the structural equations that support the two models (all coefficients are signifi-18
cant at the 0.99 confidence level). These variables include information about respondents’ 19
sociodemographic characteristics, environment, and travel behavior. The variables SDO, 20
Age, and Income are continuous, as is the percent GOP vote in the respondents’ county. 21
All other variables are binary. Each coefficient represents the respective variable’s effect 22
on the respective factor score. In SEM 1, for example, the coefficient of male respondents 23
on F_Class is 0.341, indicating that the model predicts a male respondent’s F_Class factor 24
score to be 0.341 standard deviations higher than a female respondent’s. The coefficient 25
of Percent GOP on F_Race is 0.623. Because Percent GOP is presented as a decimal 26
between 0 and 1, this means that an increase of 30 percentage points in Percent GOP 27
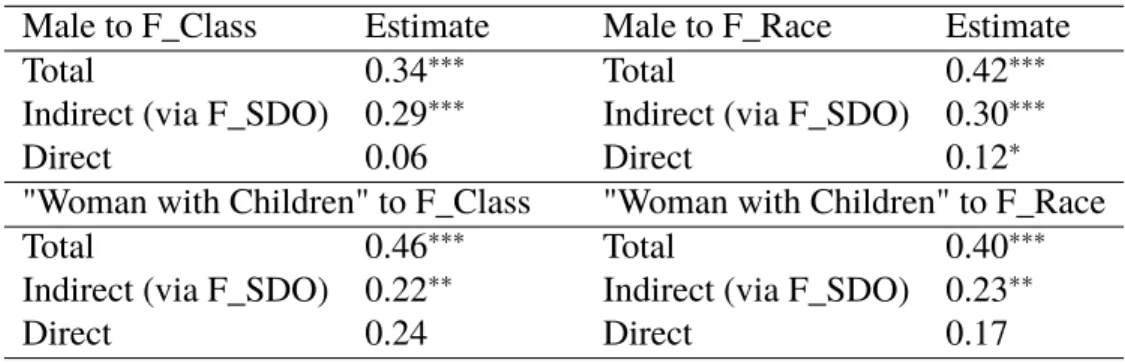
would increase a respondent’s predicted factor score by 0.19 standard deviations. Table 6, 28
meanwhile, shows how F_SDO works as an intermediary between sociodemographics and 29
discriminatory attitudes in the shared ride, and reports the direct, indirect and total effects 30
of two selected variables. 31
Table 5: Structural Equations Models 1 and 2: Standardized coefficients for explanatory variables, including sociodemographics, environment, and travel behavior
SEM 1 SEM 2
Factor Class Race Class Race SDO
(Name) (F_Class) (F_Race) (F_Class) (F_Race) (F_SDO)
Demographics
Male 0.341∗∗∗ 0.423∗∗∗ 0.056 0.121∗ 0.416∗∗∗ Has children -0.18 -0.145 -0.152 -0.114 -0.042 Woman with children 0.455∗∗∗ 0.398∗∗∗ 0.241 0.166 0.319∗∗ Age 0.004 0.005 0.003 0.004 0.001 Socioeconomics No college degree 0.012 0.018 -0.066 -0.062 -0.111 Graduate degree -0.047 -0.117 -0.023 -0.089 -0.039 Income 0.022∗∗∗ 0.01 0.017∗∗∗ 0.004 0.0007 Race Black -0.103 -0.115 0.019 0.008 -0.17 Asian 0.189 0.168 -0.038 -0.078 0.338∗∗∗ Hispanic -0.019 -0.015 0.003 0.006 -0.029 Environment
White in maj. white county 0.124 0.262∗∗ 0.063 0.198∗∗ 0.088 Percent GOP in county 0.345 0.623∗∗ -0.084 0.172 0.624∗∗∗
Travel Behavior
Primarily drives 0.003 -0.162∗ 0.085 -0.073 -0.123 Primarily uses transit -0.17 -0.111 -0.018 0.049 -0.222∗∗ Owns car 0.055 0.133 -0.036 0.036 0.133
F_SDO - - 0.694∗∗∗ 0.726∗∗∗
-RMSEA Estimate: 0.065 (0.059-0.072) 0.068 (0.065-0.072)
CFI/TLI 0.97 0.953 0.963 0.953
Table 6: SEM 2: Standardized direct, indirect, and total effects of selected variables
Male to F_Class Estimate Male to F_Race Estimate
Total 0.34∗∗∗ Total 0.42∗∗∗
Indirect (via F_SDO) 0.29∗∗∗ Indirect (via F_SDO) 0.30∗∗∗
Direct 0.06 Direct 0.12∗
"Woman with Children" to F_Class "Woman with Children" to F_Race
Total 0.46∗∗∗ Total 0.40∗∗∗
Indirect (via F_SDO) 0.22∗∗ Indirect (via F_SDO) 0.23∗∗
Direct 0.24 Direct 0.17
∗ p<0.1;∗∗ p<0.05;∗∗∗ p<0.01
The results presented in Figure 1 and Tables 5 and 6 confirm the hypotheses explained 1
above. In particular, the results of SEM Models 1 and 2 reveal significant direct and indirect 2
effects among the sociodemographic characteristic and latent variables under consideration. 3
According to Table 5, several characteristics have significant variables across multiple 4
models, as noted in the findings below. In general, the sign of these coefficients does 5
not vary between SEM 1 and 2, regardless of significance. Direct effects apparent in 6
the models represent the effect of an independent variable (e.g., gender) directly on the 7
dependent variable (e.g., discriminatory attitudes in the ridesharing context). Indirect 8
effects represent the effect of independent variables on dependent variables through a 9
mediating variable: the social dominance orientation factor. The total effect represents a 10
combination of direct and indirect effects (Schreiber et al., 2006). 11
It should be noted that the findings below do not indicate any causal relationships, but 12
rather only significant correlations between dependent and independent variables. Each of 13
the findings below presents a direct or indirect effect of sociodemographic characteristics 14
and social dominance orientation to discriminatory attitudes in ridesharing. Section 4 15
provides discussion of how a future study could be used to estimate causal relationships. 16
Findings supported by these models include the following: 17
18
Effect of Personal Characteristics on Discriminatory Attitude 19
20
Finding 1: Male respondents and women with children have significantly more dis-21
criminatory responses to both race and class preferences. Income has a significant direct 22
effect on class preferences, but no significant correlation with race preferences. Each of 23
these three characteristics has a significant positive effect on the discriminatory attitude or 24
attitudes tested in these models. Other characteristics, such as age and education, have no 25
significant effect on class or race preferences. 26
1
Finding 2: For respondents that live in counties in which a larger share of the electorate 2
voted for the Republican candidate in the 2016 presidential election, there is an effect on 3
race preferences but no effect on class preferences. 4
5
Finding 3: A respondent’s race per se does not have a significant effect on discrim-6
inatory attitudes, but the combination of race and environment does. Specifically, white 7
respondents that live in majority white counties are more likely to hold discriminatory 8
attitudes with regard to race (no effect is observed regarding class preferences). Taking the 9
share of a population that is white as a suitable proxy for the overall diversity of an area in 10
the United States, this finding indicates that white riders living in less diverse communities 11
may be more likely to harbor discriminatory attitudes. However, the measure of an area’s 12
whiteness (percent white population in a county) alone is not significant when included in 13
the models (not shown in the tables above). 14
15
Finding 4: Whether a respondent primarily uses transit as a travel mode has a signif-16
icant negative effect on a respondent’s social dominance orientation. However, no travel 17
behavior variables have a significant direct effect on discriminatory attitudes when included 18
in the model, suggesting that discrimination is specific more to the individual than to the 19
mode of choice. 20
21
Effect of Social Dominance Orientation on Discriminatory Attitude 22
23
Finding 5: Table 5 shows that F_SDO has the strongest effect on discriminatory 24
attitudes in ridesharing. This suggests that individuals who agree with social dominance 25
orientation questions are also more likely to hold discriminatory preferences in the context 26
of shared rides. Table 6 shows how F_SDO works as an intermediary between sociodemo-27
graphics and discriminatory attitudes in the shared ride, and reports the direct, indirect and 28
total effects of the selected variables. For example, being male has a total effect of 0.42 on 29
F_Race, including the indirect effect of 0.30 via F_SDO and the direct effect of 0.12. In 30
contrast, the effect of being male on F_Class is dominated by the indirect effect via F_SDO. 31
32
Finding 6: The factors F_Race and F_Class are highly correlated with one another. 33
The impact of F_SDO on F_Race and F_Class respectively is also similar (0.73 and 0.69 34
respectively). However, there are still important distinctions between the variables influ-35
encing F_Race and those influencing F_Class. In particular, whether a respondent is white 36
in a majority white county and the percent GOP vote in the respondents’ county have 37
significant total effects on F_Race, but not F_Class. The opposite is true of income, which 38
has a significant direct effect on F_Class, but not on F_Race. 1
2
Finding 7: Whether a respondent is Asian has a significant effect on F_SDO but 3
no direct effect on F_Race or F_Class. This finding suggests that this sociodemographic 4
characteristic may influence social dominance attitudes in general, but does not explain 5
discrimination in the shared ride context. 6
4. Discussion 7
In the 1970s urban scholar Richard Sennett described the city as "a human settlement 8
in which strangers are likely to meet." He elaborated, "For this definition to hold true, 9
the settlement has to have a large, heterogeneous population; the population has to be 10
packed together rather densely; market exchanges among the population must make this 11
dense, diverse mass interact (Sennett, 1977, p. 39)." Decades before the arrival of dynamic 12
ridesharing, Sennett’s definition of the city anticipated the experience of sharing rides with 13
strangers, in which Lyft Shared and uberPOOL—available only in the densest areas—serve 14
as market exchanges where a diverse mass interacts. In more recent work, Sennett has 15
described meeting (and tolerating) strangers as a civic duty. He has challenged planners 16
to take action to maximize chance encounters and encourage difference (Sennett, 2018, 17
p. 19). Planning scholar Leonie Sandercock, meanwhile, has argued that the 21st century 18
city will be defined by the struggle for multiculturalism and tolerance (Sandercock, 2003, 19
p. 320). In accomplishing these aims, ridesharing plays a role. Where UberBLACK offers 20
a service that is closed, controlled, and private, uberPOOL presents an open urban system 21
where citizens encounter difference in an intimate way. 22
But to unlock the societal benefits of sharing, TNC users must opt in. Where a user 23
fears encountering difference, he may be more likely to opt out. Such segregation is a 24
real concern; in her study of Lyft use in Los Angeles County, Brown found that riders 25
are less likely to share rides in racially or ethnically diverse neighborhoods (Brown, 2018, 26
p. 3). Indeed any TNC rider who is inclined to discriminate against fellow passengers 27
might avoid shared services altogether, a concerning possibility given sharing’s potential 28
to increase passenger occupancy, take vehicles off the road, relieve congestion, and improve 29
environmental outcomes. 30
Given the attitudinal findings of this paper, it is worth considering whether TNC plat-31
forms provide ridesharing users with mechanisms to discriminate against other rider. For 32
example, ridesharing services already provide riders with certain actionable information 33
about their fellow passengers. Lyft Shared users who are paired with an additional pas-34
senger can view the name of their fellow passengers when they are matched with a ride 35
already in progress. Through Lyft’s Facebook integration, it is also possible that Lyft 36
Shared passengers can gain further information about one another before entering the ride. 1
Because the app provides this information well before the ride arrives, the passenger is 2
able to cancel the ride if he deems the other passenger unsuitable. Other travel apps offer 3
similar precedents. In March 2018, the Waze carpool app (which connects commuters 4
with fellow amateur drivers) launched a new feature that allows riders to select drivers 5
based on ratings, mutual friends, gender, and other custom filters (Perez, 2018). Currently, 6
ridesharing matching algorithms are efficiency-oriented and ignore passengers’ personal 7
characteristics and preference for social interaction, but this may not always be the case. 8
Zhang and Zhao, for example, developed preference-based matching methods that go be-9
yond efficiency criteria to incorporate passenger preferences. But as the authors of this 10
paper point out, not all individual preferences are socially respectable and planners must 11
be cautious of the potential misuse of such preference-based matching algorithms (Zhang 12
and Zhao, 2018, p. 2). 13
Our results suggest that if Uber or Lyft were to allow riders to express preferences 14
about one another, some users may discriminate against others based on race and class. 15
While this feature is only a counterfactual today, it is conceivable that some TNCs might 16
one day implement features that incorporate preference matching or provide riders with 17
information about one another, given enough popular user support. Indeed in our survey, 18
many respondents indicated a preference for seeing fellow passenger’s profile photo (26.6 19
percent) or name, gender, and age (33.4 percent) before entering the ride. It is reasonable to 20
expect that some riders would also take advantage of a feature that allows them to indicate 21
potentially discriminatory preferences for fellow passengers. Before implementing any 22
type of preference matching, TNCs should consider this risk. 23
In addition to exercising caution about preference matching, TNCs should consider 24
active policies to limit possible discrimination and encourage positive interactions between 25
strangers. TNCs could, for example, implement in-app training programs that confront 26
common stereotypes, cultivate respectful behavior between passengers, and encourage 27
positive serendipitous encounters. In considering the issues raised by this paper, it is 28
critical that TNCs and their regulators draw what Zhang and Zhao call a "boundary between 29
acceptable and unacceptable articulations of preferences" (Zhang and Zhao, 2018). That is, 30
the shared mobility industry and society at large should think seriously about preference-31
based matching methods that could facilitate discrimination based on race or class. In 32
doing so, TNCs and policymakers should limit the ability of passengers to avoid difference 33
or discriminate against one another. Taking this notion one step further, society should 34
view ridesharing as an opportunity for riders to encounter, through chance and geography, 35
unknown citizens of the diverse city. 36
5. Conclusion 1
This paper explores the phenomenon of discriminatory attitudes in the shared ride 2
and demonstrates substantial variation across users. Our first attitudinal finding is that 3
discriminatory attitudes toward fellow passengers of differing class and race in the shared 4
ride are positively correlated with respondents that are male or are women with children. 5
Respondents’ race alone has no significant impact on discriminatory attitudes, but white 6
respondents in majority white counties are more likely to hold such attitudes. The second 7
finding is that one’s generic social dominance orientation strongly influences his/her dis-8
criminatory attitudes in ridesharing, supporting the claim that behavior in shared mobility 9
platforms can reflect long-standing social dominance attitudes. 10
This paper measured respondents’ stated attitude about discrimination in the context of 11
a shared ride. Further research could verify our findings using alternative methods, test for 12
causal relationships, and model the connection between these discriminatory attitudes and 13
realized discriminatory behavior. In particular, this paper suggests four avenues for further 14
research. 15
First, an implicit association test (IAT) could expand analysis of the discriminatory 16
attitudes discussed here. As noted earlier, one major limitation of our research is that stated 17
preferences are likely to under represent discriminatory attitudes due to social desirability 18
bias. IAT is a tool from social psychology research that offers a potential solution to this 19
problem. In particular, IAT associates words and photographs to specific response keys 20
on a keyboard and then measures differential response times to determine the strength of 21
respondents’ automatic preferences (Greenwald et al., 2003). IAT has been applied in other 22
transportation behavior research (such as predicting users’ primary commute mode choice) 23
and could be applied to testing automatic preferences for fellow passengers in a shared ride, 24
which could strengthen the stated preference analysis presented in this paper (Moody and 25
Zhao, 2018). However, any such research would need to contend with recent meta-analysis 26
finding that IATs performed no better than explicit measures of bias in measuring and 27
modeling discriminatory attitudes (Oswald et al., 2013). 28
Second, experimental methods could consider causality in ridesharing and discrimina-29
tion. As noted in Section 3.3 the relationships explored in this research do not indicate 30
causal relationships. It would be inappropriate, for example, to say that an Uber or Lyft 31
user has more discriminatory attitudes toward fellow passengers of a different social class 32
because he has a higher income. Instead, our findings indicate that users of Uber or Lyft 33
with higher income reported greater discriminatory attitudes in our survey. To estimate 34
causal relationships within a structural equation modeling framework, further research 35
could collect longitudinal/panel data or robust instrumental variables. Alternatively, a 36
further study could conduct a randomized controlled trial of Lyft and Uber users who have 37
not previously used ridesharing to test the influence of sharing behavior on discrimina-38
tory attitudes. That is, does the ridesharing context cause a change (i.e., exacerbation or 1
mitigation) in the discriminatory attitudes of passengers? 2
Third, additional surveys could ask respondents about how their attitudes affect other 3
behaviors in the TNC context, such as tipping and rating. These questions could be posed 4
either implicitly or explicitly. Even a blunt question such as "When deciding whether to tip, 5
do you consider the driver’s race?" would reveal a lower bound of discrimination, despite 6
the social desirability bias. 7
Finally, whether the discriminatory attitudes discussed in this paper truly manifest 8
themselves in discriminatory behavior is a topic for continued research and discussion. In 9
this vein, recent research (Moody et al., 2019) investigated associations between the rider-10
to-rider discriminatory attitudes discussed in this paper and four aspects of ridesharing 11
behavior: whether a TNC user uses the ridesharing option (i.e., Lyft Shared or uberPOOL), 12
how frequently a user selects the ridesharing option, an individual’s level of satisfaction 13
with the sharing option, and whether a non-user would consider using uberPOOL or Lyft 14
Shared in the future. This paper expands our research from attitude to behavior in the 15
context of rider-rider discrimination. 16