Distribution and Charge State of Iron Impurities in
Intentionally Contaminated Lead Halide Perovskites
The MIT Faculty has made this article openly available.
Please share
how this access benefits you. Your story matters.
Citation
Poindexter, Jeremy R., Mallory A. Jensen, Ashley E. Morishige,
Erin E. Looney, Amanda Youssef, Juan-Pablo Correa-Baena, Sarah
Wieghold, et al. “Distribution and Charge State of Iron Impurities in
Intentionally Contaminated Lead Halide Perovskites.” IEEE Journal
of Photovoltaics 8, no. 1 (January 2018): 156–161.
As Published
http://dx.doi.org/10.1109/JPHOTOV.2017.2775156
Publisher
Institute of Electrical and Electronics Engineers (IEEE)
Version
Author's final manuscript
Citable link
http://hdl.handle.net/1721.1/119189
Terms of Use
Article is made available in accordance with the publisher's
policy and may be subject to US copyright law. Please refer to the
publisher's site for terms of use.
Abstract—Impurity contamination in thin-film solar cells
remains an uncertain risk due to the little-known impact of impurities on recombination. Building upon previous work, in which we intentionally contaminated lead halide perovskite (LHP) solar cells with iron, we further examine the distribution and charge state of iron-induced defects in LHP films using synchrotron-based X-ray techniques. X-ray absorption measurements suggest that iron-rich regions, which form among iron feedstock concentrations that exceed 100 ppm, most closely resemble the chemistry of Fe2O3. Iron distributed within the bulk
may form a mix of Fe2+ and Fe3+, the latter of which is not expected
to be recombination active, potentially allowing LHPs to incorporate more iron than traditional semiconductors. X-ray beam induced current measurements show little correlation between the presence of iron-rich regions and charge collection, which further suggests low recombination activity at these sites. These results further elucidate the recombination behavior caused by iron incorporation in LHP films, revealing insight into how inhomogeneous incorporation of impurities may mitigate photovoltaic performance degradation.
Index Terms—impurities, methylammonium lead iodide,
extrinsic defects, transition metals, synchrotron, X-ray fluorescence, photovoltaics, solar energy
I. INTRODUCTION
As efficiencies of lead halide perovskite (LHP) solar cells approach those of single-junction silicon-based solar cells, the photovoltaics (PVs) community has begun exploring methods to establish baseline processes for manufacturing large-area LHP modules. As these processes develop, contamination due to unintentional impurity incorporation—which has thus far received little attention among academic researchers studying LHPs—will become an increasingly relevant concern. In addition to substances (e.g., water) that can reduce LHP stability [1], impurity atoms might impact electronic transport, as they sometimes do in other PV technologies [2], [3]. In the
Sample fabrication was funded by a research grant from TOTAL S.A. through the MIT Energy Initiative and performed in part at the Shared Experimental Facilities supported in part by the MRSEC Program of the National Science Foundation (NSF) under award number DMR-1419807. Synchrotron-based X-ray spectroscopy was performed at the Advanced Photon Source, a U.S. DOE Office of Science User Facility operated by Argonne National Laboratory under Contract No. DE-AC02-06CH11357. Electron microscopy was performed at the Harvard University Center for Nanoscale Systems (CNS), a member of the National Nanotechnology Coordinated Infrastructure Network (NNCI), which is supported by the NSF under NSF EECS Award No. 1541959.
J. R. Poindexter acknowledges support from the Martin Family Society of Fellows for Sustainability. M. A. Jensen and E. E. Looney acknowledge support
worst cases, such impurities can limit charge-carrier lifetimes even at concentrations as low as 1 ppm or below [2], [4]. This effect occurs primarily due to large carrier capture cross-sections and so-called “deep” defect energy levels (i.e., those which lie far from either band edge [5]), both of which increase the strength of Shockley-Read-Hall (SRH) recombination [6]. However, if impurity atoms form traps that are “shallow” or even resonant with the valence or conduction band, they often have little effect on SRH recombination. In LHPs, for example, theory suggests that alkali metals such as Na and K form shallow traps regardless of whether they incorporate as interstitials or substitutional impurities on the lead site [7]. Additionally, experiments suggest that some elements can be incorporated in LHPs for the purpose of doping without degrading performance, or at least charge-carrier lifetime [8]– [10].
While density-functional-theory (DFT) calculations can predict expected defect concentrations (from enthalpy of formation) and defect energy levels (and with sufficient effort, capture cross-sections [11], [12]), they rely on a thermodynamic understanding of defect formation, whereas kinetic processes may also affect impurity incorporation. The effect of kinetics on defect formation becomes especially relevant in materials like LHPs that are (1) intrinsically metastable [13] and (2) synthesized at low temperatures (~100 °C), providing little energy for atomic rearrangement to occur. Since the spatial distribution and chemistry of defects both impact SRH recombination, experimental assessment of these factors is necessary to contextualize theory-based calculations and ultimately assess the nature of a given impurity’s effect on PV performance [14]–[16].
In previous work [17], we investigated the impact of iron— an impurity common in PV manufacturing environments and a deep-level trap in many semiconductors [2], [18]—on LHP solar cell performance. We demonstrated that LHP solar cells can tolerate up to 100 times more iron in the feedstock
by the National Science Foundation Graduate Research Fellowship under Grant No. 1122374. A. E. Morishige acknowledges support from the NSF and the DOE under NSF CA No. EEC-1041895.
J. R. Poindexter, M. A. Jensen, E. E. Looney, A. Youssef, J.-P. Correa-Baena, S. Wieghold, and T. Buonassisi are at the Massachusetts Institute of Technology, Cambridge, MA 02139 USA.
A. E. Morishige was with the Massachusetts Institute of Technology, Cambridge, MA 02139 USA, and is now with 1366 Technologies Inc., Bedford, MA 01730 (e-mail: aemorishe@alum.mit.edu).
V. Rose is affiliated with the Center for Nanoscale Materials; B. Lai and Z. Cai both with the X-ray Science Division; all at the Advanced Photon Source, Argonne National Laboratory, 9700 Cass Avenue, Lemont, IL 60439.
Distribution and charge state of iron impurities in
intentionally contaminated lead halide perovskites
Jeremy R. Poindexter, Mallory A. Jensen, Ashley E. Morishige, Erin E. Looney, Amanda Youssef, Juan-Pablo
Correa-Baena, Sarah Wieghold, Volker Rose, Barry Lai, Zhonghou Cai, Tonio Buonassisi
compared to conventional p-type silicon devices [2] before suffering comparable losses in solar cell efficiency. We concluded that LHPs exhibit some degree of extrinsic defect tolerance (complementing the well-known intrinsic defect tolerance in LHPs [7], [19]), despite that our DFT calculations suggested that iron interstitials (Fei) are expected to form deep
traps. This apparent discrepancy might be explained by the presence of recombination-inactive iron (e.g., due to a benign charge state) and/or local agglomeration of iron, both of which would be expected to decrease overall recombination.
To investigate these possibilities, here we probe the spatial distribution and charge state of iron incorporated into LHP thin films using three synchrotron-based X-ray synchrotron techniques: an ray fluorescence nanoprobe (nano-XRF), X-ray absorption near edge structure (XANES), and X-X-ray beam induced current (XBIC). Our measurements indicate that iron tends to exhibit a lower oxidation state when it incorporates as a bulk impurity rather compared to in iron-rich regions. Furthermore, the presence of such regions, which begin forming among feedstock iron concentrations above 100 ppm, is weakly correlated with the XBIC signal, indicating little impact on recombination and thus charge-carrier collection. These results demonstrate heterogeneity in the structural incorporation of iron in LHPs, as well as how such heterogeneity may affect recombination activity. The observed distribution of iron incorporation helps explain the previously observed [17] high tolerance to iron in LHPs, which may guide scale-up efforts for developing LHPs and other emerging PV absorber materials.
II. EXPERIMENTAL METHODS
We fabricated and characterized ternary lead halide perovskite films intentionally contaminated with iron at feedstock impurity concentrations of 100, 1000, and 2000 ppm (on a molar basis). Thin films of methylammonium lead iodide (MAPbI3) were fabricated on glass/TiO2 substrates using FeI2
(dissolved uniformly in dimethyl formamide) as a bulk contamination source, similar to our previous work [17], with two slight alterations intended to decrease the presence of voids in our films. First, we increased the precursor concentrations by 16% (to 2.64 and 0.88 M for CH3NH3I and PbCl2, respectively,
following deQuilettes et al. [20]). Second, we altered the annealing time-temperature profile by ramping up the hot plate from room temperature to 100 °C at a rate of ~20 °C/min.
For XBIC measurements, a device with 2000 ppm feedstock iron concentration was fabricated using the FTO/TiO2/MAPbI3/spiro-OMeTAD/Au architecture, as
described in our previous work [17], but using the modified precursor concentrations and annealing time-temperature profile. A baseline sample that was not intentionally contaminated was also fabricated for comparison. Current– voltage (I–V) measurements were performed on both samples as described previously [17], except a scan speed of 0.01 V/s was used.
Scanning electron microscope (SEM) images were collected on a Zeiss Ultra Plus system at an excitation voltage
of 5 kV with a secondary electron (SE2) detector at a working distance of 5.5 mm.
Spatially resolved nano-XRF maps, along with XBIC data, were collected at beamline 26-ID-C at the Advanced Photon Source at Argonne National Laboratory [21], which allowed for image resolutions down to ~30 nm (the diameter of the focused beam). The beam energy was set to 9 keV to detect emission from Fe (K-line), Cl (K-line), I (L-line), and Pb (M-line). For nano-XRF, dwell times were 0.75 s (100 and 2000 ppm samples) and 1.0 s (1000 ppm sample); for XBIC, dwell time was 0.5 s. Step sizes were 25–30 nm for nano-XRF and 300 nm for XBIC; the larger step size for XBIC measurements was necessary to avoid the X-ray beam from causing changes in the electrical response in devices, as has been noted elsewhere [22]. The preamplifier setting for XBIC was set to 1 nA/V. XANES spectra at different locations on the same samples were collected just above 7 keV (near the Fe K 1s absorption edge) at beamline 2-ID-D with a 200 nm spot size [23].
For XANES, standard powders, encapsulated in polyimide tape, were measured under the same experimental conditions as the films during the same measurement session. All powders were purchased from Sigma-Aldrich: Fe metal (99.9%), FeO (99.8%), Fe2O3 (99%), and FeCl2 (98%).
To quantify the XRF data, reference standards (NIST SRM No. 1832 and 1833) were measured at 26-ID-C under the same configuration as the samples. Nano-XRF data was then quantified using the standard process at 26-ID-C with MAPS software as described in Ref. [24]. Because we did not correct for absorption or degradation in our XRF and XBIC maps as described in Ref. [25], [26], uncertainties may be expected in the specific elemental quantifications, though we expect self-absorption to be minimal due to the small thickness (~500 nm) of our films.
III. RESULTS
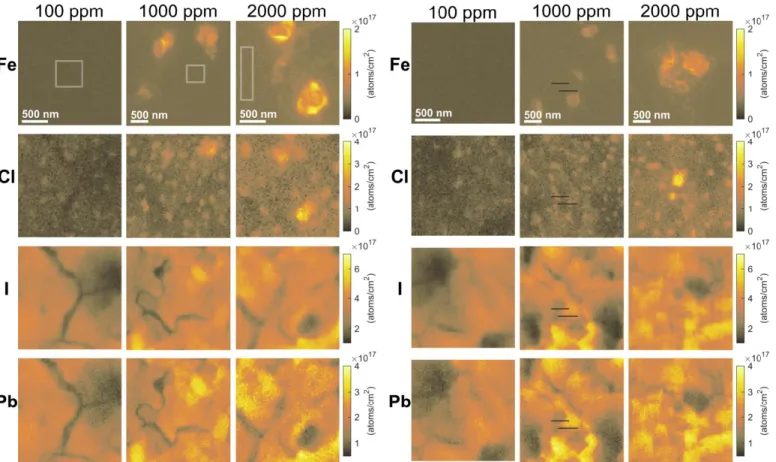
Fig. 1 shows clearly identifiable regions (two separate areas on each sample) of high iron content in the 1000 and 2000 ppm samples detectable via nano-XRF, along with elemental maps showing the distributions of chlorine, iodine, and lead at all three feedstock iron concentrations. These maps suggest that large iron-rich regions 300–500 nm in diameter begin to agglomerate among feedstock iron concentrations that exceed 100 ppm; no similar iron-rich regions were found in the 100 ppm sample after scanning an area over 600 μm2. Smaller
agglomerations of iron below 30 nm in diameter (the X-ray beam spot size) may begin forming at lower concentrations but remain below the nano-XRF detection limit. In all three samples, several areas with decreased I and Pb nano-XRF counts are evident, which we attribute to the presence of grain boundaries and voids seen via SEM in Fig. 2. Iron agglomerates preferentially, but not exclusively, near these features; more uniformly distributed iron is also observed throughout the bulk of the films (i.e., away from iron-rich regions) as evident from
the non-zero background signal, which is (2.2±0.1)×1016,
(3.3±0.4)×1016, and (5.7±3.6)×1016 atoms/cm2 for the 100,
1000, and 2000 ppm samples, respectively.
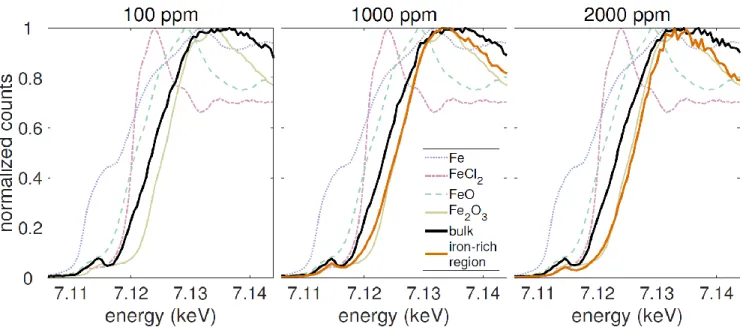
Some chlorine within the film clusters into areas (100–200 nm) that are more uniformly distributed than the iron-rich regions. Additionally, some chlorine is collocated with iron. Interestingly, no obvious iron-containing secondary phases were observed via SEM, shown in Fig. 2, which suggests these iron-rich areas may lie beneath the surface or otherwise are not in high enough concentration to cause changes in SEM contrast. We also collected XANES data at the locations of select iron-rich regions found on the 1000 and 2000 ppm samples (Fig. 3, orange lines) and compared these spectra to standards, which included Fe metal, FeO, Fe2O3, and FeCl2. Spectra
collected at the locations of these regions most closely resembled Fe2O3. We compared these data to XANES collected
in the “bulk” of the film, away from iron-rich regions in all three samples—i.e., in areas where little contrast in Fe concentration was seen via nano-XRF, but where a uniform iron signal was still detected. As shown in Fig. 3 (black lines), the onset of these absorption spectra were shifted 2–3 eV lower in energy, which may indicate a lower oxidation state. Additionally, the shape of the spectra above 7.135 eV differs from the Fe2O3 standard.
To relate the presence of iron to current collection in our samples, we also performed XBIC measurements on a 2000 ppm device (fabricated separately from the films), as shown in Fig. 4 alongside the I–V performance compared to a baseline. While the resolution of this measurement was limited because the X-ray beam degraded the electrical response in our samples at step sizes smaller than ~200–300 nm (with a dwell time of 0.5 s), we can still compare the XBIC response to larger iron-rich regions, which are visible in the iron signal. Qualitatively,
Fig. 2. Scanning electron microscope images of 100 ppm, 1000 ppm, and 2000 ppm samples showing grain boundaries, voids, and surface morphology. 2-μm and 10-μm scalebars apply to the top and bottom rows of images, respectively.
Fig. 1. Maps collected using nano-X-ray fluorescence showing elemental distribution for 100 (top row), 1000 (middle row), and 2000 ppm (bottom row) feedstock iron concentrations. Emission from Fe (K-line), Cl (K-line), I (L-line), and Pb (M-line) are shown from top to bottom for each map. The color scale for each element is the same for all three samples. Bulk incorporated Fe areal concentrations (mean ± std. dev.)
calculated from the areas within the white boxes (left map) are (2.2±0.1)×1016, (3.3±0.4)×1016, and (5.7±3.6)×1016 atoms/cm2 for the 100,
1000, and 2000 ppm samples, respectively. Black lines on the 1000 ppm sample (right map) are due to briefly losing the beam during the measurement.
we that high iron content weakly correlates with decreases in the XBIC signal (Fig. 4, blue and red boxes).
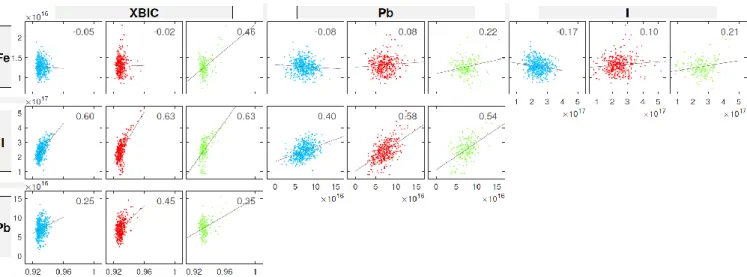
In Fig. 5, we quantify these correlations in three specific regions of the XBIC map, chosen to highlight features of interest (i.e., high Fe content), as indicated by the blue, red, and green boxes in Fig. 4. We perform six correlations, one for each pair of signals (XBIC, Fe, I, Pb). These correlations help distinguish the effect of Fe vs. Pb or I on the XBIC signal in these select regions. In the blue and red regions, iron is quite weakly negatively correlated with XBIC, whereas it is positively correlated with XBIC in the green region (where it is also more strongly correlated with Pb and I content). Pb and I remain strongly correlated in all three regions, which is reassuring since we do not expect large variations in the Pb/I ratio. Pb and I exhibit a moderate to strong positive correlation with the XBIC signal in all three regions, which may reflect changes in X-ray beam absorption (e.g., due to varying film thickness). Chlorine-rich particles were not detectable with the larger step size of this measurement, so the chlorine map was omitted from Fig. 4.
IV. DISCUSSION
Overall, the bulk iron concentration increases little (by ~50%) from 100 to 1000 ppm compared to the order-of-magnitude change in iron concentration in the feedstock itself. This suggests that iron present in the feedstock begins preferentially incorporating as iron-rich regions at a feedstock concentration between 100 and 1000 ppm. Structurally, iron-rich regions incorporate somewhat preferentially in the 1000 ppm and 2000 ppm samples near areas of low I and Pb counts (i.e., apparent grain boundaries and voids), behavior which has been seen in other materials such as silicon [27]–[29]. Interestingly, the shape of the iron-rich regions in the 1000 ppm sample was much rounder than the needle-like structures seen
previously [17], which may be related to the use of a higher wt.% concentration or the use of a temperature ramp-up to 100 °C, which may alter the growth kinetics of the formation of these iron-rich regions.
The nano-XRF maps also reveal insight into the chlorine distribution within the bulk, which has been studied using nano-XRF previously [30]. We see similar chlorine-rich regions, where chlorine clearly incorporates heterogeneously; in addition, this incorporation increases with feedstock iron concentration, as evident in Fig. 1. The presence of Fe2+ ions
within the precursor may affect the kinetics of chlorine incorporation, which itself is known to be sensitive to initial film growth conditions [31]. In comparison to iron, however, the presence of chlorine correlates less strongly with I and Pb, although some chlorine does collocate with iron. Because the XANES data does not resemble the FeCl2 standard measured,
however, this collocation may be incidental or caused by the same mechanism (e.g., lower energy of secondary-phase nucleation) rather than caused by the existence of compounds that contain both iron and chlorine. For example, it may be that PbCl2 or similar phases happen to form alongside Fe2O3
particles. XANES measurements of suspected compounds (e.g., FeI2, FeCl3, and/or PbCl2/PbCl3) and/or measurements of
extended X-ray absorption fine structure (EXAFS), which were not available at 2-ID-D, may elucidate the chemistry at these specific sites. (Unfortunately, the authors have not been able to locate such data within the literature.) It is also possible that phases not normally stable in isolation such as FeI3 may be
present here.
Fig. 3. XANES spectra for the 100 ppm (left), 1000 ppm (middle), and 2000 ppm (right) samples probing iron in the bulk as well as at iron-rich regions, along with four iron-containing standards, which consisted of powders encapsulated in polyimide tape. For the 100 ppm sample, no iron-rich regions were detected, so only the XANES spectrum from the bulk was included and compared with the standards.
Despite uncertainty about the specific chemistry of iron-rich regions, there remains a clear difference between the charge state in these areas, which XANES suggests comprise mostly of Fe3+, and that of iron in the bulk, which may exhibit
a mix of Fe2+ and Fe3+. The presence of mixed-valency iron in
the bulk of all three samples agrees with our previous XPS measurements, which were collected on a film containing considerably more iron (a feedstock iron concentration of 1 at.%) [17].
Our work raises further questions about the incorporation of Fe in MAPbI3, which several works have investigated via
replacement of substantial amounts (between 0.1–25 at.%) of Pb with Fe in precursor solutions [32]–[34]. The effect of incorporated Fe in degrading I–V performance in MAPbI3 films
in these studies agrees with our previous report [17], while
some questions remain about the mechanism of Fe incorporation within the lattice at the nanoscale. Our previous calculations suggest that Fei is the most likely form of
incorporated isolated iron compared to FePb, in agreement with
experimental XRD analysis completed by Williams et al. [34]. However, high levels of Fe incorporation seem not to affect film crystallinity [17], [34], suggesting iron-containing secondary-phase formation is suppressed. (Maps of specific elemental ratios—namely, Fe/Cl and Fe/I—using the data from Fig. 1 did not reveal any obvious secondary phases with plausible stoichiometries.) To reconcile this observation with our XANES data, which suggest that iron-rich regions differ in charge state compared to the bulk, we speculate that Fei might
be interacting with incorporated oxygen in some way. While the defect characteristics of potential Fe–O complexes have not been explored in LHPs, it is possible that oxygen might passivate Fei, especially given that neither OI nor Oi is expected
to be recombination active [7]. Oxygen in the films may have incorporated during growth from either TiO2 or N,N-dimethyl
formamide, or more likely after growth due to air exposure, approximately 1–2 hours of which was necessary to mount the samples inside the nano-XRF measurement chamber. We previously observed oxygen peaks via XPS in similar films as well (see Ref. [17], Supporting Information).
Because our earlier calculations [17] suggest that Fe3+ is
not recombination active due to the lack of a +3/+2 transition level within the band gap of MAPbI3, a significant portion of
iron present (e.g., any Fe3+ interstitials present) may not
contribute significantly to recombination—although this may be affected by exposure to air or oxygen-containing solvents. Still, this might suggest that Fe3+ present within iron-rich
regions does not contribute much to recombination (if it behaves similar to interstitials from a recombination point of view), as iron-rich regions does not appear to limit the XBIC signal; given the low I–V response of the contaminated device, however, this effect may simply be masked by overall recombination within the bulk. Some of the effect on current collection due to Fe may also be masked by effects from Pb and I, although the correlation analysis in the blue region from Fig. 4 suggests that large iron-rich regions can be present without significantly affecting current collection. The extent to which this remains true in general would benefit from correlating XBIC with iron concentration using greater statistics (i.e., observing a large number of iron-rich regions in regions of varying Pb and I content) and higher image resolution. Such an investigation may be enabled by efforts to avoid the degradation in electrical performance, which has been observed previously [22] but can be mitigated with careful choice of dwell time, spot size, and/or device orientation relative to the beam [26]. More generally, our XBIC results also provide an interesting contrast to significant negative correlations between XBIC and metal precipitates previously observed in Si [35], [36].
Regardless, iron clearly incorporates inhomogeneously in MAPbI3, which may cause much of the incorporated iron to
affect recombination much less than otherwise would be expected from its defect energy level. This heterogeneous incorporation may help explain its relatively high tolerance to iron, and it highlights the fact even if deep-level impurities are
Fig. 4. XBIC measurements alongside nano-XRF maps of Fe, I, and Pb on a device with 2000 ppm feedstock iron concentration. Blue, red, and green boxes on each plot are guides for the eye for regions of particular interest as discussed in the text. The I–V response (bottom panel) of the 2000 ppm device (solid brown line) is also displayed alongside an uncontaminated baseline (dotted black line).
present, they may be less harmful than expected if the number of recombination-active sites can be reduced via local agglomeration (which may exhibit different chemistry) or passivated by other means. If such an effect is easily accessible within conventional solar cell processing, it might help enable high performance even in materials for which intrinsic or extrinsic defect tolerance does not reach the level observed in LHPs.
V. CONCLUSIONS
In summary, nano-XRF measurements on MAPbI3 films
fabricated via solution synthesis suggest iron begins to agglomerate when it exceeds a concentration of 100 ppm in the feedstock solution. Iron-rich regions, while sometimes collocated with Cl, most closely match the X-ray absorption spectrum of Fe2O3, which suggests iron at these locations
consists mainly of Fe3+. A mixture of Fe2+ and Fe3+ charge states
throughout the bulk in each sample may be present, e.g., as interstitial point defects or nanoprecipitates below the detection limit of nano-XRF. Given that Fe3+ is not expected to be
recombination active, the impact of iron on recombination in LHPs may be limited due to a more benign mix of charge states and the tendency of iron to cluster amongst high feedstock iron concentrations. These factors help explain the apparent low risk of iron-induced efficiency losses in LHP solar cells despite the likely presence of iron impurities in typical fabrication setups, which may prove valuable for the industrial scale-up of LHPs and similar materials.
ACKNOWLEDGMENT
The authors are grateful to Martin Holt and Peter Fuesz for assistance with synchrotron measurements and data collection at beamline 26-ID-C.
REFERENCES
[1] G. Niu, X. Guo, and L. Wang, “Review of Recent Progress in Chemical Stability of Perovskite Solar
Cells,” J. Mater. Chem. A, p. Advance, Dec. 2015. [2] J. R. Davis, A. Rohatgi, R. H. Hopkins, P. D. Blais, P.
Rai-Choudhury, J. R. McCormick, and H. C. Mollenkopf, “Impurities in silicon solar cells,” IEEE
Trans. Electron Devices, vol. 27, no. 4, pp. 677–687,
Apr. 1980.
[3] A. D. Collord, H. Xin, and H. W. Hillhouse,
“Combinatorial Exploration of the Effects of Intrinsic and Extrinsic Defects in Cu2ZnSn(S,Se)4,” IEEE J.
Photovolt., vol. 5, no. 1, pp. 288–298, Jan. 2015.
[4] G. Coletti, “Sensitivity of state-of-the-art and high efficiency crystalline silicon solar cells to metal impurities,” Prog. Photovoltaics Res. Appl., vol. 21, no. 5, pp. 1163–1170, Mar. 2012.
[5] A. Alkauskas, M. D. McCluskey, and C. G. Van de Walle, “Tutorial: Defects in semiconductors— Combining experiment and theory,” J. Appl. Phys., vol. 119, no. 18, p. 181101, May 2016.
[6] W. Shockley and W. Read, “Statistics of the
Recombinations of Holes and Electrons,” Phys. Rev., vol. 87, no. 5, pp. 835–842, Sep. 1952.
[7] T. Shi, W.-J. Yin, and Y. Yan, “Predictions for p-Type CH3NH3PbI3 Perovskites,” J. Phys. Chem. C, vol. 118,
no. 44, pp. 25350–25354, Nov. 2014.
[8] D. Pérez-del-Rey, D. Forgács, E. M. Hutter, T. J. Savenije, D. Nordlund, P. Schulz, J. J. Berry, M. Sessolo, and H. J. Bolink, “Strontium Insertion in Methylammonium Lead Iodide: Long Charge Carrier Lifetime and High Fill-Factor Solar Cells,” Adv.
Mater., vol. 28, no. 44, pp. 9839–9845, Nov. 2016.
[9] J. T.-W. Wang, Z. Wang, S. Pathak, W. Zhang, D. W. DeQuilettes, F. Wisnivesky-Rocca-Rivarola, J. Huang, P. K. Nayak, J. B. Patel, H. A. Mohd Yusof, Y. Vaynzof, R. Zhu, I. Ramirez, J. Zhang, C. Ducati, C. Grovenor, M. B. Johnston, D. S. Ginger, R. J. Nicholas, and H. J. Snaith, “Efficient perovskite solar cells by metal ion doping,” Energy Environ. Sci., vol. 9, no. 9, pp. 2892–2901, Aug. 2016.
[10] W. A. Dunlap-Shohl, R. Younts, B. Gautam, K.
Fig. 5. Correlation plots of the blue, red, and green boxes from Fig. 4. As in Fig. 4, units for Fe, Pb, and I are atoms/cm2; units for XBIC are
Gundogdu, and D. B. Mitzi, “Effects of Cd Diffusion and Doping in High-Performance Perovskite Solar Cells Using CdS as Electron Transport Layer,” J.
Phys. Chem. C, vol. 120, no. 30, pp. 16437–16445,
Aug. 2016.
[11] D. Wickramaratne, J.-X. Shen, C. E. Dreyer, M. Engel, M. Marsman, G. Kresse, S. Marcinkevičius, A. Alkauskas, and C. G. Van de Walle, “Iron as a source of efficient Shockley-Read-Hall recombination in GaN,” Appl. Phys. Lett., vol. 109, no. 16, p. 162107, Oct. 2016.
[12] J.-X. Shen, D. Wickramaratne, C. E. Dreyer, A. Alkauskas, E. Young, J. S. Speck, and C. G. Van de Walle, “Calcium as a nonradiative recombination center in InGaN,” Appl. Phys. Express, vol. 10, no. 2, p. 21001, Feb. 2017.
[13] G. P. Nagabhushana, R. Shivaramaiah, and A. Navrotsky, “Direct calorimetric verification of thermodynamic instability of lead halide hybrid perovskites.,” Proc. Natl. Acad. Sci. USA, vol. 113, no. 28, pp. 7717–21, Jul. 2016.
[14] T. Buonassisi, A. A. Istratov, M. A. Marcus, B. Lai, Z. Cai, S. M. Heald, and E. R. Weber, “Engineering metal-impurity nanodefects for low-cost solar cells,”
Nat. Mater., vol. 4, no. 9, pp. 676–679, Sep. 2005.
[15] T. Buonassisi, A. A. Istratov, M. Heuer, M. A. Marcus, R. Jonczyk, J. Isenberg, B. Lai, Z. Cai, S. Heald, W. Warta, R. Schindler, G. Willeke, and E. R. Weber, “Synchrotron-based investigations of the nature and impact of iron contamination in
multicrystalline silicon solar cells,” J. Appl. Phys., vol. 97, no. 7, p. 74901, Apr. 2005.
[16] W. Kwapil, J. Schon, F. Schindler, W. Warta, and M. C. Schubert, “Impact of Iron Precipitates on Carrier Lifetime in As-Grown and Phosphorus-Gettered Multicrystalline Silicon Wafers in Model and Experiment,” IEEE J. Photovolt., vol. 4, no. 3, pp. 791–798, May 2014.
[17] J. R. Poindexter, R. L. Z. Hoye, L. Nienhaus, R. C. Kurchin, A. E. Morishige, E. E. Looney, A. Osherov, J.-P. Correa-Baena, B. Lai, V. Bulović, V. Stevanović, M. G. Bawendi, and T. Buonassisi, “High Tolerance to Iron Contamination in Lead Halide Perovskite Solar Cells,” ACS Nano, vol. 11, no. 7, pp. 7101–7109, Jul. 2017.
[18] A. A. Istratov, H. Hieslmair, and E. R. Weber, “Iron and its complexes in silicon,” Appl. Phys. A: Mater.
Sci. Process., vol. 69, no. 1, pp. 13–44, Jul. 1999.
[19] R. E. Brandt, V. Stevanović, D. S. Ginley, and T. Buonassisi, “Identifying defect-tolerant
semiconductors with high minority-carrier lifetimes: beyond hybrid lead halide perovskites,” MRS
Commun., vol. 5, no. 2, pp. 265–275, Jun. 2015.
[20] D. W. deQuilettes, S. M. Vorpahl, S. D. Stranks, H. Nagaoka, G. E. Eperon, M. E. Ziffer, H. J. Snaith, and D. S. Ginger, “Impact of microstructure on local carrier lifetime in perovskite solar cells,” Science, vol. 348, no. 6235, pp. 683–686, May 2015.
[21] R. P. Winarski, M. V. Holt, V. Rose, P. Fuesz, D. Carbaugh, C. Benson, D. Shu, D. Kline, G. B.
Stephenson, I. McNulty, and J. Maser, “A hard X-ray nanoprobe beamline for nanoscale microscopy,” J.
Synchrotron Radiat., vol. 19, no. 6, pp. 1056–1060,
Nov. 2012.
[22] M. Stuckelberger, T. Nietzold, G. N. Hall, B. West, J. Werner, B. Niesen, C. Ballif, V. Rose, D. P. Fenning, and M. I. Bertoni, “Charge Collection in Hybrid Perovskite Solar Cells: Relation to the Nanoscale Elemental Distribution,” IEEE J. Photovolt., pp. 1–8, 2016.
[23] Z. Cai, B. Lai, W. Yun, I. McNulty, A. Khounsary, J. Maser, P. Ilinsky, D. Legnini, E. Trakhtenberg, S. Xu, B. Tieman, G. Wiemerslage, and E. Gluskin,
“Performance of a high-resolution x-ray microprobe at the Advanced Photon Source,” in AIP Conference
Proceedings, 2000, vol. 521, pp. 31–34.
[24] S. Vogt, “MAPS : A set of software tools for analysis and visualization of 3D X-ray fluorescence data sets,”
J. Phys. IV, vol. 104, pp. 635–638, Mar. 2003.
[25] B. M. West, M. Stuckelberger, A. Jeffries, S. Gangam, B. Lai, B. Stripe, J. Maser, V. Rose, S. Vogt, M. I. Bertoni, and IUCr, “X-ray fluorescence at nanoscale resolution for multicomponent layered structures: a solar cell case study,” J. Synchrotron Radiat., vol. 24, no. 1, pp. 288–295, Jan. 2017.
[26] M. Stuckelberger, B. West, T. Nietzold, B. Lai, J. M. Maser, V. Rose, and M. I. Bertoni, “Engineering solar cells based on correlative X-ray microscopy,” J.
Mater. Res., pp. 1–30, May 2017.
[27] M. A. Jensen, J. Hofstetter, A. E. Morishige, G. Coletti, B. Lai, D. P. Fenning, and T. Buonassisi, “Synchrotron-based analysis of chromium
distributions in multicrystalline silicon for solar cells,”
Appl. Phys. Lett., vol. 106, no. 20, p. 202104, May
2015.
[28] A. E. Morishige, M. A. Jensen, J. Hofstetter, P. X. T. Yen, C. Wang, B. Lai, D. P. Fenning, and T.
Buonassisi, “Synchrotron-based investigation of transition-metal getterability in n -type
multicrystalline silicon,” Appl. Phys. Lett., vol. 108, no. 20, p. 202104, May 2016.
[29] D. P. Fenning, J. Hofstetter, M. I. Bertoni, G. Coletti, B. Lai, C. del Cañizo, and T. Buonassisi, “Precipitated iron: A limit on gettering efficacy in multicrystalline silicon,” J. Appl. Phys., vol. 113, no. 4, p. 44521, Jan. 2013.
[30] Y. Luo, S. Gamliel, S. Nijem, S. Aharon, M. Holt, B. Stripe, V. Rose, M. I. Bertoni, L. Etgar, and D. P. Fenning, “Spatially Heterogeneous Chlorine Incorporation in Organic–Inorganic Perovskite Solar Cells,” Chem. Mater., vol. 28, no. 18, pp. 6536–6543, Sep. 2016.
[31] E. L. Unger, A. R. Bowring, C. J. Tassone, V. L. Pool, A. Gold-Parker, R. Cheacharoen, K. H. Stone, E. T. Hoke, M. F. Toney, and M. D. McGehee, “Chloride in Lead Chloride-Derived Organo-Metal Halides for Perovskite-Absorber Solar Cells,” Chem. Mater., vol. 26, no. 24, pp. 7158–7165, Dec. 2014.
[32] M. T. Klug, A. Osherov, A. A. Haghighirad, S. D. Stranks, P. R. Brown, S. Bai, J. T.-W. Wang, X. Dang,
V. Bulović, H. J. Snaith, and A. M. Belcher, “Tailoring metal halide perovskites through metal substitution: influence on photovoltaic and material properties,” Energy Environ. Sci., vol. 10, no. 1, pp. 236–246, 2017.
[33] L. A. Frolova, D. V. Anokhin, K. L. Gerasimov, N. N. Dremova, and P. A. Troshin, “Exploring the Effects of the Pb2+ Substitution in MAPbI
3 on the Photovoltaic
Performance of the Hybrid Perovskite Solar Cells,” J.
Phys. Chem. Lett., vol. 7, no. 21, pp. 4353–4357, Nov.
2016.
[34] S. T. Williams, A. Rajagopal, S. B. Jo, C.-C. Chueh, T. F. L. Tang, A. Kraeger, and A. K.-Y. Jen, “Realizing a new class of hybrid organic–inorganic multifunctional perovskite,” J. Mater. Chem. A, vol. 5, no. 21, pp. 10640–10650, May 2017.
[35] T. Buonassisi, A. A. Istratov, M. D. Pickett, M. A. Marcus, G. Hahn, S. Riepe, J. Isenberg, W. Warta, G. Willeke, T. F. Ciszek, and E. R. Weber, “Quantifying the effect of metal-rich precipitates on minority carrier diffusion length in multicrystalline silicon using synchrotron-based spectrally resolved x-ray beam-induced current,” Appl. Phys. Lett., vol. 87, no. 4, p. 44101, Jul. 2005.
[36] O. F. Vyvenko, T. Buonassisi, A. A. Istratov, H. Hieslmair, A. C. Thompson, R. Schindler, and E. R. Weber, “X-ray beam induced current—a synchrotron radiation based technique for the in situ analysis of recombination properties and chemical nature of metal clusters in silicon,” J. Appl. Phys., vol. 91, no. 6, pp. 3614–3617, Mar. 2002.
View publication stats View publication stats