HAL Id: hal-02946475
https://hal.archives-ouvertes.fr/hal-02946475
Submitted on 23 Sep 2020HAL is a multi-disciplinary open access
archive for the deposit and dissemination of sci-entific research documents, whether they are pub-lished or not. The documents may come from teaching and research institutions in France or abroad, or from public or private research centers.
L’archive ouverte pluridisciplinaire HAL, est destinée au dépôt et à la diffusion de documents scientifiques de niveau recherche, publiés ou non, émanant des établissements d’enseignement et de recherche français ou étrangers, des laboratoires publics ou privés.
Improvement of Sensitivity of Surface Plasmon
Resonance Imaging for the Gas-Phase Detection of
Volatile Organic Compounds
Sophie Brenet, Jonathan S. Weerakoddy, Arnaud Buhot, Francois-Xavier
Gallat, Raphaël Mathey, Loïc Leroy, Thierry Livache, Cyril Herrier, Yanxia
Hou
To cite this version:
Sophie Brenet, Jonathan S. Weerakoddy, Arnaud Buhot, Francois-Xavier Gallat, Raphaël Mathey, et al.. Improvement of Sensitivity of Surface Plasmon Resonance Imaging for the Gas-Phase Detection of Volatile Organic Compounds. Talanta, Elsevier, 2020, 212, pp.120777. �10.1016/j.talanta.2020.120777�. �hal-02946475�
Improvement of Sensitivity of Surface Plasmon Resonance Imaging for the
Gas-Phase Detection of Volatile Organic Compounds
Sophie Brenet,a Jonathan S. Weerakoddy,a Arnaud Buhot,a François-Xavier Gallat,a Raphael Mathey,a Loïc
Leroy,a Thierry Livache,b Cyril Herrier, b Yanxia Hou a, *
a Univ. Grenoble Alpes, CEA, CNRS, IRIG, SyMMES, F-38000 Grenoble, France
b Aryballe Technologies, F-38000 Grenoble, France
*Corresponding author:
Dr. Yanxia Hou, Univ. Grenoble Alpes, CEA, CNRS, IRIG, SyMMES, CEA-Grenoble, 17 Rue des Martyrs, F-38000 Grenoble, France
Abstract
The analysis of volatile organic compounds (VOCs) is an important issue in various domains. For this, electronic noses (eN) are very promising as novel analytical tools that are portable, inexpensive, and efficient for reliable and rapid analyses. Recently, we have demonstrated that surface plasmon resonance imaging (SPRI) is especially interesting for the development of eNs dedicated for gas-phase analysis of VOCs. To further improve the performance of the eN based on SPRI, in this study, we investigated the influence of the LED wavelength on the sensitivity of the system. For this, a complete theoretical study together with a related experimental investigation for the validation were carried out. We have shown that the wavelength of the light source has an impact on the surface sensitivity of SPRI for the detection of VOCs. Indeed, in the studied wavelength range from 530 nm to 740 nm, both bulk sensitivity and surface sensitivity increase as the wavelength increases with good coherence between theoretical and experimental results. With the optimal LED wavelength, the detection limits of our eN reach low ppb range for VOC such as 1-butanol.
Keywords : Electronic nose, Surface plasmon resonance imaging, Volatile organic compound, Wavelength, Sensitivity
1. Introduction
Volatile organic compounds (VOCs) are ubiquitous. Some of them are harmful to the environment and sometimes dangerous to human health. Today, their detection in gas phase is an important issue in diverse domains [1]. In this context, electronic noses (eN) offer interesting strategies to analyze gaseous samples containing a multitude of VOCs. They are multisensor systems, consisting of an array of sensors presenting a cross-reactivity to different gaseous samples and using transduction techniques to obtain complex signatures, identifiable by advanced mathematical procedures such as pattern recognition techniques and/or multivariate statistics. Electronic noses are very promising for providing transportable, inexpensive, reliable, and rapid novel analysis tools [2, 3]. So far, developing eN, with a good capacity for the differentiation of VOCs and sufficient sensitivity to detect them at low concentrations, remains a great technological challenge.
In the last three decades, great efforts have been made for eN development by employing various transduction techniques, including conductive sensors, gas sensitive field effect transistors, surface acoustic wave, quartz crystal microbalance [2, 4]. Each system has its own advantages and
disadvantages for improving the performances of eN in terms of sensitivity, selectivity, response and recovery time, detection range, and operating limitations. Among these techniques, optical
transduction means present some special advantages, i.e. suitable for the elaboration of a large sensor array for simultaneously monitoring many binding events in real time and with a good sensitivity. One original example was reported by Walt and colleagues based on their bead-based optical fiber arrays for the analysis of VOCs [5, 6].
Another optical technique, surface plasmon resonance (SPR), is also a promising candidate for such applications. SPR is a label-free method that allows in real-time observation of local refractive index variations triggered by interactions between sensors and analytes. SPR has long been used for the study of biomolecular interaction in liquid media [7-9]. Preliminary assays were reported for the detection of VOCs in solution using SPR, with sensors consisting in specific biomolecules such as olfactory receptors and odorant binding proteins [10-12]. Although numerous studies were
conducted for the analysis of interaction in the liquid medium, in the literature much less was done for the detection of analytes in the gas phase by SPR. Historically, the feasibility of gas-phase analysis using SPR was demonstrated in the 1980s, for the detection of dinitrogen and halogenated VOCs [13, 14]. Since then, only very few examples of gas sensing using SPR were reported [15-18]. These systems were based on solely one or two sensitive layers, and were thereby limited in terms of sensitivity and selectivity due to a lack of surface engineering. Indeed, for efficient gas sensing based on SPR, the design of novel sensing materials with great diversity and better performances is
essential.
Among SPR-based techniques, SPR imaging (SPRI) is especially suited for gas-phase analysis as a small shift in the plasmon resonance curve generates a high variation of reflectivity, that could be
measured using a camera [13]. Recently, we have successfully developed an SPRI instrument for eN application by designing novel sensing materials based on organic molecules with diverse
physicochemical properties and short peptides. Thanks to the imaging mode, we were able to
simultaneously monitor the interactions between VOC analytes and hundreds of sensors on the same microarray in real-time [19]. Our system was capable of differentiating VOCs with a single carbon resolution and a sub-ppm detection limit, e.g. 120 ppb for 1-octanol. Clearly, such a high sensitivity and selectivity for VOC detection using SPRi is only possible in gas phase. Since it is well known that SPRi is not suitable for the analysis of small molecules such as VOC (< 300 Da) in liquid phase. In order to further improve the performance of our eN, the enhancement of the SPRI detection sensitivity is investigated in this study.
Improvement of SPRI detection sensitivity in the gas phase has been the subject of few studies. For example, bimetallic layers (silver and gold) on the prism was used to efficiently enhance SPRI sensitivity [15]. This approach, at first promising, is however quite difficult to implement, especially regarding the reproducibility of bimetallic layers. Another approach is based on the optimization of the wavelength of the light source, and especially shifting the wavelength toward the near-infrared. Such an optimization has already shown its efficiency for SPR analyses in the liquid medium [20-22]. For example, a wavelength of 1152 nm was used by Nelson et al. to detect the formation of the monolayer of 11-mercaptoundecanoic acid [21].
Herein, we focus on the influence of the wavelength of a light source such as LED on gas-phase VOC detection by SPRI for eN applications. A theoretical model was first used to study its relevance. This model allowed us to define an appropriate wavelength range to study, and to predict the extent of the gain in sensitivity that could be expected. Then, a complete experimental study was performed in order to verify the validity of the theoretical results. We have demonstrated that the wavelength of the light source has an impact on the surface sensitivity of SPRI for the detection of VOCs in the gas phase. In the studied wavelength range from 530 nm to 740 nm, both bulk sensitivity and surface sensitivity increase as the wavelength increases with good coherence between theoretical and
experimental results. With the optimal LED wavelength, the detection limits of our eN goes down to sub-ppm and even low ppb range for the VOC such as 1-butanol.
2. Material and methods
2.1. Numerical simulations
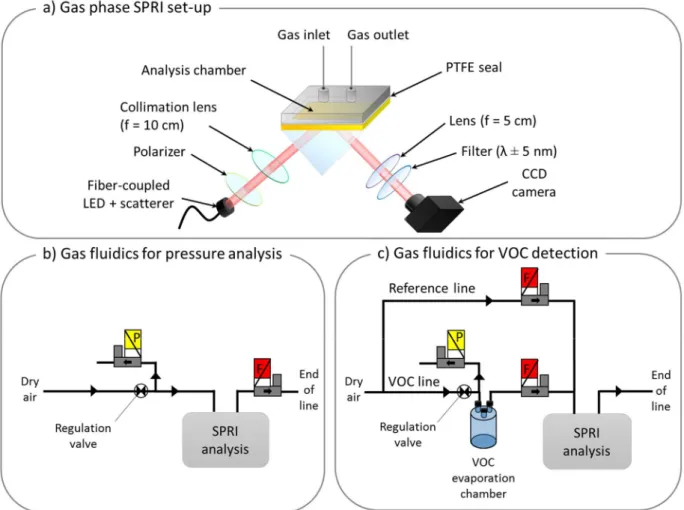
The schematic illustration of the whole optoelectronic nose set-up is given in Figure 1.
SPR plasmon curves and sensitivities were calculated with Mathematica 8.0 (Wolfram Research) using the matrix formalism for stratified media [23] by considering a perfectly monochromatic and collimated illumination and plane interfaces, as described in a previous study [24]. Each layer on the prism was characterized by its refractive index or permittivity in the case of metals, and calculated according to the wavelength of detection. The refractive index of the prism was provided by the Sellmeier formula [25] with the coefficients given in the Schott database for NBK7 [26]. The relative permittivity of metals was determined according to the literal expressions presented in other reported studies [27,28]. For each metallic interface, a constant 2-nm thick adhesion layer of chromium was taken into account. Pure air was used as the dielectric medium. The Edlén empirical equation [29] was used to determine the refractive index of air according to the wavelength and the air pressure. The equations used to calculate the plasmon wave penetration depth and propagation width are given by Homola [30]. The sensitivity optimization was performed with the NMaximize function, in order to define parameters that maximize the reflectivity variation associated with an index variation.
As a first estimate of the sensitivity, the angular sensitivity was evaluated. It corresponds to the minimum of the first derivative of the theoretical plasmon resonance curves. Afterwards, two
operating situations were simulated. Firstly, a variation of the refractive index of pure air was applied to the semi-infinite layer representing the dielectric medium (Figure 2a). A value corresponding to an overpressure of 1 bar relatively to the ambient pressure was chosen. This allowed to evaluate the theoretical bulk sensitivity, which corresponds to the optical sensitivity for a global index variation. Secondly, a physicochemical interaction was simulated. A finite layer was added between the metal interface and the dielectric medium to represent VOC adsorption (Figure 2b). A refractive index of 1.41 was chosen according to the refractive index of isoamyl butyrate, the reference compound used in our experiments. Two VOC layer thicknesses were used in the following, 0.1 nm and 0.5 nm. This allowed to evaluate the theoretical surface sensitivity, which corresponds to the optical sensitivity for a VOC adsorption.
2.2. Experimental set-up
The home-made SPRI apparatus is based on the Kretschmann configuration. A detailed presentation of this system for gas sensing was given elsewhere [19].
The optical instrument used in this study is shown in Figure 1a. LEDs with a wavelength of 530 nm, 625 nm, 740 nm and 850 nm were used (M530F2, M625F2, M740F2, M850F2, Thorlabs, U.S.). They were coupled to an optical fiber with a 125 µm core diameter. The output beam passed through a linear polarizer to obtain transverse magnetic polarized light. The beam was then collimated by a 25 mm-wide aspheric lens with a focal length of 10 cm in order to reduce the divergence of the light beam while remaining compatible with the dimensions of a portable instrument. For each
wavelength, band-pass filters with a full width at half maximum of 10 nm were used to minimize the spectral width of the LEDs (FB550-10, FB630-10, FB750-10, FB850-10, Thorlabs, USA; LEDs spectral distribution are available on www.thorlabs.com). SPR images were acquired with a 16-bit CCD
camera (AVT Pike, Allied Vision, Germany). To avoid any temperature effect, the whole SPRI apparatus was put in a Peltier controlled incubator at 25 °C.
A commercial SPRI microarray containing 130 cross-reactive sensors (five replicates for 26 different self-assembled organic molecules and short peptides), plus five internal references that are not sensitive to VOCs, was provided by Aryballe Technologies, as described previously [19]. This microarray was prepared on NBK7 prisms with an apex angle of 90° (Edmund Optics, U.S.). 2 nm of chromium and 54 nm of gold were deposited by evaporation on prism bases. The same microarray was used for all the experiments. The SPRI microarray was covered with a piece of thin
polytetrafluoroethylene (PTFE) gasket placed on the top of the prism and a stainless-steel cover with the gas inlet and outlet to form the analysis chamber for VOC detection.
For the gas sampling, purified dry air was used as a carrier gas. All the tubing was made of PTFE and all the connectors and valves were made of stainless steel (Swagelok, Netherlands). Two
configurations were used to evaluate either the experimental bulk sensitivity or the surface
sensitivities of sensors (Figure 1b and c). For the bulk sensitivity, the global refractive index of air was modified by varying the pressure in the analysis chamber. To do so, the air pressure was controlled from the regulatory valve down to the flowmeter (El-Flow, Bronkhorst, Germany) by a pressure controller (El-Press, Bronkhorst) (Figure 1b). Through this, the air pressure in the analysis chamber was sequentially set to 1.050 bar (absolute), 1.250 bar, 1.450 bar and 1.650 bar. Each pressure level was maintained for two minutes to ensure the equilibration throughout the system. The whole sequence was repeated twice at each tested wavelength.
For the surface sensitivity, that is the sensitivity for VOC detection, gas bench elements and
procedures were detailed in the previous study [19]. In brief, the fluid bench was composed of a VOC analyte line and a reference line (Figure 1c). The analyte line consisted of a 3-neck glass flask in which VOC liquid samples were evaporated at a controlled pressure of 1.050 bar and at a flowrate of 100 mL.min-1. The resulting VOC gas samples were then injected into the analysis chamber for ten minutes. At the end of the gas line, a photoionization detector (PID) was connected for the
measurement of VOC concentration (ppbRAE300, RAE Systems, U.S.). Isoamyl butyrate (provided by Naturamole, France) and 1-butanol (bottle of 5ppm with 20.9 % Oxygen and > 79.09% nitrogen, Air products) were used as VOC samples. After each VOC analysis, the reference line was used for the regeneration of the microarray and the purging of the whole fluidic system for their reuse.
2.3. Data processing
At the beginning of each experiment, TM images of the microarray were recorded with an angular resolution of 0.125° to obtain the plasmon resonance curves for all the cross-reactive sensors (Figure S1). The experimental angular sensitivities of the sensors were computed as the minimum of the first derivative of these experimental curves.
The SPRI images were collected by the camera during the pressure variation sequences and VOC injections at a fixed working angle with maximal sensitivity. The raw reflectivity (%R) was measured in real time for all the cross-reactive sensors. It was then converted for each sensor into a variation of reflectivity (Δ%R(t)) by subtracting a baseline taken 1 minute before the pressure variation sequence or the VOC injection. In this way, sensorgrams were obtained, representing the optical response of all sensors as a function of time.
For the analysis of the experimental bulk sensitivity, the variation of reflectivity Δ%R(t) associated with each pressure level was averaged over 1 minute for each replicate of each sensor. The values of reflectivity per replicate thus obtained gave the pressure calibration curves (Figure S2). The bulk
optical sensitivity per sensor replicate ((dR/dP)rep) was then calculated by linear regression. These (dR/dP)rep values were afterwards averaged among replicates for each of the 26 sensors and the standard deviation was calculated between replicates in order to compare the bulk optical sensitivity between sensors. The histogram was generated with the averaged (dR/dP) value for the 26 sensors and the standard deviation was indicated with the error bars.
For the analysis of the experimental surface sensitivity, VOC equilibrium patterns were computed as the mean reflectivity variation at equilibrium for 1 minute (Δ%Rrep) on each sensor replicate per VOC analysis. The histograms were generated with the average Δ%R value for the five replicates of each of the 26 sensors and their standard deviation was indicated with the error bars.
For each sensor, experimental enhancement factors corresponding to a wavelength shift were calculated. For the bulk sensitivity, the averaged (dR/dP) value obtained at a given wavelength was divided by the value obtained for the lower wavelength studied. For the surface sensitivity, the same data processing was performed on the averaged Δ%R. A general experimental enhancement factor was calculated by averaging those of all the sensors. The experimental error corresponds to the standard deviation between the experimental enhancement factors of all the sensors
The refractive index resolution was calculated from the measurement noise σ and the experimental bulk sensitivity to a refractive index variation Δ%R/Δn with Δn the variation of the refractive index. The value of Δ%R/Δn was obtained by dividing the bulk sensitivity to pressure (dR/dP) by the factor ΔP/Δn. The factor ΔP/Δn relates a pressure change to the corresponding index change, and was calculated according to Edlén empirical equations [29]. The resolution in refractive index was calculated by dividing the measurement noise by the experimental bulk sensitivity to a refractive index variation [31].
The resolution of detection in VOCs concentration was calculated as the minimum difference in concentration that can be reliably measured, i.e. over three times the measurement noise.
Figure 1. Schematic illustration of the optoelectronic nose set-up. (a) Configuration of the home-made SPRI dedicated for the analysis of VOCs in the gas phase; fluid bench configuration used for (b) the bulk sensitivity analysis based on air pressure variation; (c) the VOC generation, sampling and regeneration for the analysis of surface sensitivity. The devices noted (P) correspond to the pressure controllers, (F) correspond to the flowmeters.
3. Results and discussion
3.1. Theoretical study on the effect of wavelength on gas-phase VOC detection by SPRI In the first part of this study, the influence of the wavelength of the light source on surface plasmon resonance was investigated on several distinguishing features by numerical simulations, i.e. peak width of the plasmon resonance angular curves, penetration depth and propagation length of plasmon wave, and detection sensitivity for a fixed refractive index variation. Besides, the impact of wavelength on bulk sensitivity and surface sensitivity was simulated based on two operating situations, as described previously in Part 2.1 (Figure 2a and 2b). For the theoretical study, the wavelength range we investigated was between 400 nm and 1000 nm. Clearly, for wavelength below 540 nm the SPR was not noticeable, as shown in Figure 2c.
3.1.1. Impact on plasmon resonance curves
It was found that the wavelength has an impact on the plasmon resonance curves, in particular, the width of their peaks (Figure 3a). The longer the wavelength, the sharper the plasmon resonance angular peak. As a consequence, there was an increase in the theoretical angular sensitivity of the plasmon resonance curves, i.e. their slope. With the wavelength from 530 nm to 850 nm, the
theoretical angular sensitivity was multiplied by a factor of almost 60 (Table 2). Indeed, this value is often used as a first approximation to evaluate the detection sensitivity in SPRI. Increasing the wavelength of the light source would therefore generate an enhancement of the detection sensitivity in the gas phase.
Nevertheless, an increase in the theoretical angular sensitivity would come with a decrease in the angular linearity range, which corresponds to the angular range of the plasmon resonance curve where the %R reflectivity varies linearly with the angle of incidence of the beam. Plasmon resonance angular curves and their respective linearity range are shown in Figure 3a with wavelengths from 530 nm to 850 nm. Clearly, increasing the wavelength led to a further narrowing of these curves and a corresponding decrease in their angular linearity range. For example, the angular linearity range decreased from 1.2° for 530 nm to 0.05° for 850 nm (Table 2).
3.1.2. Impact on penetration depth and propagation length
In addition to the impact on the plasmon resonance curves, the wavelength has also an impact on the propagation distances of the plasmon in the probed medium. On the prism surface, the plasmon wave propagates in the dielectric medium, in the metal and along their interface. These quantities can be defined as the distance at which the remaining intensity of the wave is 1/e of its maximum intensity [32]. Our study focused on the penetration depth in the dielectric medium Lz, and the propagation length Lx along the metal-air interface.
It was found that the propagation length Lx increases also as the wavelength of the source increases (Figure S3a). For example, Lx was 5.79 µm for the wavelength at 632 nm, and it increased to 64 µm at 1000 nm, which was consistent with the values reported in the literature for computations using a dielectric medium index of 1.00 [33]. Generally, it is considered that the plasmon wave has an intensity close to zero at a distance about four times of Lx [34]. Surface plasmons at an even greater distance can therefore be considered independent. This aspect is essential for SPR imaging, where reflectivity variation needs to be recorded upon the interaction between each sensor of the
microarray deposited on the prism and analytes in the dielectric medium in an independent manner. In order to ensure that the reflectivity variation recorded for a given sensor has not interfered with interactions occurring on its neighbor sensors, a good balance had to be found between the density of sensors on the prism and the wavelength of the light source, with regard to the propagation length. In our array configuration [19], the distance d between the sensors was about 200 µm. In our SPRI configuration, the maximum wavelength was therefore roughly 800 nm in order to conserve d > 4Lx, and 850 nm for d > 3Lx, to ensure the independence of plasmons associated with the different sensors.
Furthermore, the penetration depth Lz in air increases as the wavelength increases. At 632 nm, the obtained Lz was 165 nm, and it increased to 510 nm in the near infrared at 1000 nm, which was consistent with the values reported in the literature for a dielectric medium index of 1.00 [33]. With a larger Lz, the more remote index variations from the metal-air interface are detectable. An increase in the wavelength of the light source would therefore affect the probed range of the dielectric medium, in particular, for the bulk versus surface sensitivity.
3.1.3. Impact on bulk sensitivity and surface sensitivity
In this part, we have evaluated the impact of the wavelength on bulk sensitivity and surface sensitivity with the aim of optimizing the experimental conditions for a better VOC detection sensitivity. The theoretical bulk sensitivity, which corresponds to the optical sensitivity for a global
refractive index variation in the probed range of the dielectric medium, was simulated by computing the reflectivity variation induced by a refractive index variation corresponding to an overpressure of 1 bar (Figure 2a). As shown in Figure 2c, the reflectivity variation, and corresponding bulk sensitivity, increased as the wavelength increased. On the one hand, this can be explained by the previously discussed narrowing of the plasmon resonance angular peaks at higher wavelengths; on the other hand, the reflectivity variation was integrated with an expanded probed range in the dielectric medium since the penetration depth increases with the wavelength. Therefore, for the detection of a global refractive index variation, SPRI was more sensitive as the wavelength of the light source increased.
The theoretical surface sensitivity for VOC detection was calculated by simulating an adsorbed layer of VOCs on the prism surface with an index of 1.41 and a thickness of 0.1 and 0.5 nm, respectively (Figure 2b). As shown in Figure 2c, the theoretical surface reflectivity variation, and corresponding surface sensitivity, increased as the wavelength increased and plateaued at around 800 nm. This was followed by a slight decrease for wavelengths higher than 850 nm and for both thickness of 0.1 nm and 0.5 nm. In fact, at higher wavelengths the adsorbed VOC layer represents a relatively smaller fraction of the probed medium due to the increased penetration depth, which led to a decrease of the surface sensitivity [33]. This result demonstrated that 850 nm would be an optimal wavelength for the gaseous detection of VOCs, above which a loss in sensitivity would occur.
Therefore, the improvement of SPRI sensitivity can not be reduced only to the sharpness of the plasmon resonance angular peaks. For a given SPRI configuration, we had to take into account the evolution of the penetration depth and propagation length in order, firstly, to find the optimal balance between surface sensitivity and penetration depth , and secondly, to ensure the independence of plasmon waves for each sensor on the microarrays. Hence, in this study, the wavelength was specifically studied in the range of 530 nm to 850 nm.
It should be mentioned that the theoretical surface reflectivity variation depends on the thickness of the adsorbed VOC layer. Figure 2c shows that from 0.1 nm to 0.5 nm, the theoretical surface
reflectivity variation increases by a factor of five. However, if we multiply by a factor of five the surface reflectivity variation as a function of the wavelength obtained with the adsorbed layer of 0.1 nm, the obtained curve overlaps completely with that obtained with the adsorbed layer of 0.5 nm. Thus, the surface reflectivity variation was proportional to the thickness of the adsorbed layer in the tested range. In practice, it is very difficult to determine precisely the thickness of the adsorbed layer on the prism, especially for gas phase adsorption in ambient conditions. Consequently, in our
experimental results, this parameter is unknown. Thus, in order to compare the results obtained based on the simulations with those obtained with experimental measurement, it is more relevant to use an enhancement factor associated with a wavelength shift. This enhancement factor was defined by the reflectivity variation for a given wavelength divided by the reflectivity variation obtained for an inferior wavelength. In this way, the dependency of the surface sensitivity on the thickness of the adsorbedlayer is eliminated. In the following experimental part, LEDs with a wavelength of 530 nm, 625 nm, 740 nm and 850 nm were tested. Therefore, the enhancement factors for bulk sensitivity and surface sensitivity based on the simulations with different wavelength shifts (530 nm to 625 nm, 625 nm to 740 nm, and 740 nm to 850 nm) were given in Table 1. By changing the wavelength of the light source, the surface sensitivity was theoretically multiplied by 4.6 from 530 nm to 625 nm; by 1.7 from 625 nm to 740 nm; and by 1.1 from 740 nm to 850 nm.
Figure 2. Schematic illustration of different layers at the interface of the prism and the dielectric medium used in the simulation for a) refractive index variation applied to the dielectric medium; and b) an adsorbed VOC layer characterized by a refractive index nCOV = 1.41 and a certain thickness dabs; c) evolution of the reflectivity variation as the wavelength of the light source increases for different conditions: with an overpressure of 1 bar for bulk sensitivity (black solid line); with an adsorbed VOC layer of 0.1 nm (purple dotted line) and 0.5 nm (orange solid line), respectively, for surface sensitivity. When multiply by a factor of five the curve of the adsorbed layer of 0.1 nm, the obtained curve overlaps completely with that of the adsorbed layer of 0.5 nm. The wavelengths of 530 nm, 625 nm, 740 nm and 850 nm are indicated by vertical dotted lines.
Enhancement factors 530 nm to 625 nm 625 nm to 740 nm 740 nm to 850 nm Bulk sensitivity 7.40 2.58 1.45 Surface sensitivity (0.1 nm; n=1.41) 4.62 1.68 1.08 Surface sensitivity (0.5 nm; n=1.41) 4.61 1.67 1.08
Table 1. Enhancement factors for bulk sensitivity and surface sensitivity based on the simulations with different wavelength shifts.
3.2. Experimental study on the effect of wavelength on gas-phase VOC detection by SPRI In order to verify the validity of the theoretical results, a complete experimental study was then performed. We have compared the theoretical and experimental results on different points including the plasmon resonance angular curves, the bulk sensitivities and surface sensitivities using LEDs with the wavelengths at 530 nm, 625 nm, 740 nm and 850 nm, respectively.
Figure 3. Comparison of theoretical and experimental plasmon resonance angular curves obtained with different wavelengths of the light source: a) theoretical curves, b) experimental curves. The angular linearity range of each curve is indicated by a rectangle of the same color.
The theoretical and experimental plasmon resonance angular curves are presented respectively in Figure 3a and 3b. First of all, for experimental ones, in agreement with what was simulated, the longer the wavelength, the sharper the plasmon resonance angular peaks. Besides, the value of internal resonance angle for each curve, obtained by the computations and the experimental measurements, was coherent.
However, the profiles of the theoretical and experimental plasmon resonance angular curves differ for the same wavelength. In particular, an attenuation of the depth of the resonance peak was observed for all experimental ones, especially for the highest wavelength of 850 nm. This attenuation can be quantified using the angular sensitivities presented in Table 2. For example, with the
wavelength shift from 625 nm to 740 nm, the theoretical angular sensitivity was tripled, while the experimental angular sensitivity increased only by a factor of about 1.5. As described in Table 2, the gap between theoretical computations and experiments widens at higher wavelengths.
Notably, there is a large difference in plasmon resonance angular curves between theoretical results and experimental results at 850 nm. This could be explained by more stringent requirements in the optical settings at higher wavelengths, especially regarding the parameters of the light source of the SPRI setup. The spectral width of the source and the divergence of the light beam were especially critical. The spectral width is defined by its manufacturing parameter and can be further tuned using a wavelength selector, or more easily using a band-pass filter. In the case where the diameter of the diaphragm is significantly larger than the wavelength of the light source, the divergence can be limited by reducing the diaphragm aperture. In this study, we have tested different optical settings including spectral width (10 nm and 22 nm) and diaphragm diameter (0.8 nm, 0.125 nm) and various other combinations for optimization. However, even under optimized conditions, a decrease in the light intensity was still observed, which, to some extent, would impair the resolution of the SPRI
measurement. Finally, it is noteworthy that the divergence can be further reduced by prolongating the optical path. Nevertheless, this could imply an increase in size and bulk of the instrument. It is incompatible with our final goal for the development and optimization of a portable SPRI device for eN applications.
Table 2. Summary of the theoretical and experimental angular sensitivities of the plasmon resonance curves according to wavelength and the difference between simulations and experiments.
Along with this, in practice, another feature to consider is the significant decrease of the
experimental angular linearity range as the wavelength increases (as shown in Table 2). For example, the angular linearity range decreased from 1.2° with the wavelength of 530 nm to 0.18° for 740 nm. In SPRI, the working angle to perform the VOC monitoring has to be chosen in the angular linearity range for all the sensors, preferably at the angle associated with the lowest reflectivity in order to conserve a large dynamic response range. If we use a light source with a wavelength of 850 nm, the working angle must be adjusted within <0.05°. This constitutes a rather strict requirement for an instrument, especially for a portable device for which the linear angular range must be large enough to accommodate manufacturing variability between instruments. Moreover, with the wavelength shift from 740 nm to 850 nm, there is almost no gain on the surface sensitivity with a theoretical enhancement factor of 1.08. Therefore, in the following experimental study, only LEDs with the wavelength of 530 nm, 625 nm, and 740 nm were used for the evaluation of bulk and surface sensitivities.
3.2.2. Experimental evaluation of bulk sensitivity
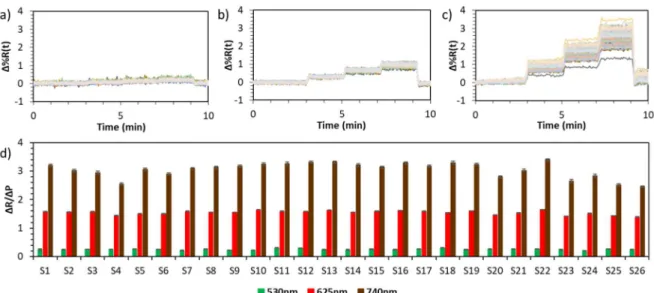
The bulk sensitivity was experimentally evaluated by measuring the reflectivity variation Δ%R induced by stepwise increases of the pressure in the analysis chamber, using LEDs with the wavelength of 530 nm, 625 nm, and 740 nm, respectively (Figure 4a to 4c). Indeed, these pressure changes gave rise to general refractive index variations in the dielectric medium probed by SPRI. Consequently, the obtained SPRI signal was solely related to the optical sensitivity of the sensors and not to a potential interaction affinity between VOC and the sensors. As shown in Figure 4a to 4c, for the same pressure change, the reflectivity variation Δ%R increases as the wavelength increases. Therefore, these experimental results confirm that the bulk sensitivity increase as the wavelength increases.
Moreover, the bulk optical sensitivity for the five replicates of each type of sensor (dR/dP)rep was then calculated by linear regression. For all sensor replicates at each pressure increase, an average difference of less than 0.03 % is found between the measured Δ%R values and the predicted values based on the regression equation. This difference was equivalent to the measurement noise of our SPRI instrument under these experimental conditions. The determination of the measurement noise
Wavelength (nm) 530 625 740 850
Theoretical angular linearity range (internal angle in deg) 1.2 0.18 0.09 0.05 Experimental angular linearity range (internal angle in deg) 1.2 0.25 0.18 - Experimental range of linear behavior (external angle in deg) 1.75 0.875 0.25 - Theoretical angular sensitivity (%.deg-1) 10.5 131 393 609
Experimental angular sensitivity (%.deg-1) 11 111 170 -
Difference between theory and experience
was described in detail in the Supplementary Information. Therefore, these results show a good repeatability of the performed measurements by our SPRI.
The averaged bulk sensitivity for each type of sensor was determined as described in section 2.3. Figure 4d shows all of them obtained using LEDs with the wavelength of 530 nm, 625 nm, and 740 nm for comparison. For all the sensors, the bulk sensitivity increased as the wavelength increases. Satisfyingly, the experimental results were very similar to the theoretical results. An average enhancement factor of 6 was obtained with the wavelength shift from 530 nm to 625 nm, and of 2 for the wavelength shift from 625 nm to 740 nm (as shown in Table 3).
It is worth to mention that measurement noise of our SPRI instrument has no significant difference as the wavelength of the light source increases (see Table S1 in the Supplementary Information). Therefore, the obtained enhancement factors with wavelength shift reflected an effective gain in detection sensitivity. In particular, using a wavelength of 740 nm allowed to double the bulk sensitivity, in comparison with the wavelength of 625 nm, which is used conventionally in SPRI. To further quantify this gain, the bulk refractive index resolution could be determined. The refractive index resolution is generally defined as the smallest difference in refractive index of the dielectric medium reliably measurable by a SPRI instrument. Taking into account the averaged bulk sensitivity per sensor and the measurement noise (detailed in the Supplementary Information), the bulk refractive index resolution decreased from 6.4.10-6 RIU (Refractive Index Unit) to 3.10-6 RIU with the wavelength shift from 625 nm to 740 nm for the most sensitive sensor. They correspond to a pressure resolution of 24 mbar and 12 mbar, respectively.
Figure 4. Experimental evaluation of bulk sensitivity. Reflectivity variation Δ%R(t) induced by
successive pressure increase (1.050 bar, 1.250 bar, 1.450 bar and 1.650 bar) for each replicate of each type of sensor using a LED with the wavelength of a) 530 nm, b) 625 nm and c) 740 nm, respectively; d) comparison of averaged bulk sensitivities Δ%R/ΔP for each type of sensor with the wavelength of 530 nm, 625 nm, and 740 nm.
Bulk sensitivity 530 nm to 625 nm 625 nm to 740 nm
Theoretical enhancement factor 7.4 2.6
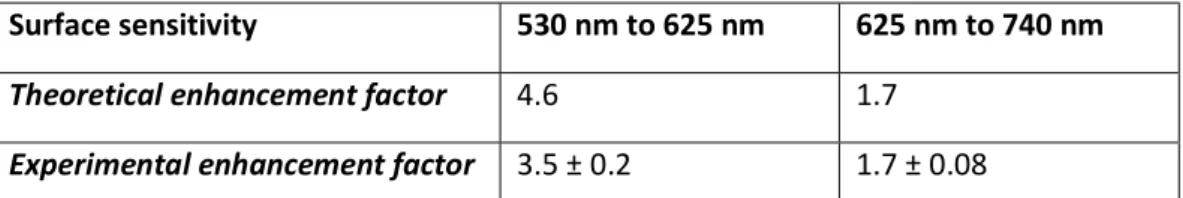
Surface sensitivity 530 nm to 625 nm 625 nm to 740 nm
Theoretical enhancement factor 4.6 1.7
Experimental enhancement factor 3.5 ± 0.2 1.7 ± 0.08
Table 3. Summary of theoretical and experimental enhancement factors with wavelength shift for the bulk and surface sensitivities.
3.3. Surface sensitivity: application for VOC detection
The surface sensitivity of SPRI for the detection of VOCs in the gas phase was investigated using the reflectivity variation Δ%R at equilibrium after the exposure to a reference VOC (isoamyl butyrate) for each wavelength. The concentration of the reference VOC was set to be the same between the experiments at different wavelengths in order to avoid any concentration bias. As seen in Figure 5, clearly, for all of the sensors the SPRI signal increases as the wavelength increases. Hence, the surface sensitivity could be enhanced by choosing light source with a wavelength of 740 nm. Besides, the experimental enhancement factors were well coherent with the values obtained by the
theoretical computations for the two wavelength shifts (as shown in Table 3). There was no change in the measurement noise as the wavelength increased (Table S1 in the Supplementary Information). The surface sensitivity for VOC detection was thus multiplied by a factor of 1.7 for a wavelength increase from 625 nm to 740 nm.
Then, the resolution in VOC concentration was evaluated to further quantify this gain in sensitivity. It corresponds to the limit of discrimination between two close concentrations, which can be reliably measured by an instrument. It was defined here as the concentration with SPRI signal corresponding to three times the measurement noise for the most sensitive sensor for the reference VOC isoamyl butyrate. Considering the measurement noise at each wavelength for this sensor (detailed in Supplementary Information), the resolution in VOC concentration decreased from 12.5 ppm for the wavelength of 530 nm to 2.4 ppm for 625 nm and further to 1.3 ppm for 740 nm, in a concentration range around 50 ppm of VOC. As a result, using a LED with the wavelength of 740 nm allows to improve the detection accuracy to roughly 2 % in this range of concentration. These results are very promising, demonstrating that for VOCs with higher affinity with our eN the detection limits could go down to sub-ppm.
To investigate the detection limit of the eN, 1-butanol was chosen. The European Odor Standard recommends the use of 1-butanol (20-80 ppb) as a panelist evaluation and screening tool and for quality criteria for the overall performance of the sensory measurement method. It was found that with the optimal wavelength of 740 nm the eN was able to reliably detect 1-butanol at 10 ppb for all the sensors (Figure S5 in the Supplementary Information).
Figure 5. Experimental evaluation of the surface sensitivity for VOC detection. Reflectivity variation Δ%R(t) measured during an exposure of isoamyl butyrate (50 ppm) using a LED of a) 530 nm, b) 625 nm and c) 740 nm, respectively; d) reflectivity variation at equilibrium of isoamyl butyrate for each wavelength (averaged Δ%R and standard deviation over 5 replicates for each receptor).
4. Conclusion
In conclusion, we have demonstrated that the wavelength of the light source has an impact on the surface sensitivity of SPRI for the detection of VOCs in the gas phase based on a complete theoretical study and an experimental investigation for the validation. First, the theoretical results have shown that the wavelength has an impact not only on the plasmon resonance curves, but also on plasmon penetration depth and propagation length. Therefore, for experimental setting, it is important to consider them in order to define an appropriate wavelength range, to optimize sensor density on the microarrays, and to ensure the independence of plasmon waves for each sensor.
In the studied wavelength range from 530 nm to 850 nm, both bulk sensitivity and surface sensitivity increase as the wavelength increases with good coherence between theoretical and experimental results. In particular, an experimental enhancement factor of 1.7 was obtained for surface sensitivity with the wavelength shift from 625 nm to 740 nm. Such results are very promising and push the detection limits of our SPRI-based eN down to low ppb range for the VOC such as 1-butanol. Nonetheless, according to experimental data, the gain in angular sensitivity at higher wavelengths was smaller than that was predicted by theoretical data. This is due to the fact that more stringent optical settings are required at higher wavelengths. Moreover, there is a significant decrease of the experimental angular linearity range as the wavelength increases. For example, at 740 nm, the obtained angular linear range required to choose the SPRI working angle with an accuracy of about one-tenth of a degree. This constitutes a rather strict requirement for an instrument. It is feasible for an instrument dedicated for laboratory use. However, it may be harsh for a portable device for which the linear angular range must be large enough to accommodate manufacturing variability between instruments. Therefore, a compromise must be made to choose the optimal LED wavelength according to different purposes.
The authors thank DGA and CEA for a Ph.D. scholarship for S. Brenet, Nanoscience Foundation for a Ph.D. scholarship for J.
S.
Weerakkody, Labex Arcane program (ANR-12-LABX-003) for their financial support for a postdoc scholarship for F.X. Gallat. This work was partially supported by the FUI-WISE AAP21 Minalogic project, BPI France.Appendix
Supporting Information
References
[1] E. Mahmoudi, Electronic nose technology and its applications, Sens Transduc J, 107(2009) 17-25. [2] A.D. Wilson, M. Baietto, Applications and Advances in Electronic-Nose Technologies, Sensors (Basel, Switzerland), 9(2009) 5099-148.
[3] Z. Li, K.S. Suslick, Portable Optoelectronic Nose for Monitoring Meat Freshness, ACS Sensors, 1(2016) 1330-5.
[4] H.K. Patel, M.J. Kunpara, Electronic nose sensor response and qualitative review of e-nose sensors, 2011 Nirma University International Conference on Engineering2011, pp. 1-6.
[5] T.A. Dickinson, J. White, J.S. Kauer, D.R. Walt, A chemical-detecting system based on a cross-reactive optical sensor array, Nature, 382(1996) 697.
[6] D.R. Walt, Bead-based optical fiber arrays for artificial olfaction, Current Opinion in Chemical Biology, 14(2010) 767-70.
[7] J. Homola, S.S. Yee, G. Gauglitz, Surface plasmon resonance sensors: review, Sensors and Actuators B: Chemical, 54(1999) 3-15.
[8] C.T. Campbell, G. Kim, SPR microscopy and its applications to high-throughput analyses of biomolecular binding events and their kinetics, Biomaterials, 28(2007) 2380-92.
[9] P. Singh, SPR Biosensors: Historical Perspectives and Current Challenges, Sensors and Actuators B: Chemical, 229(2016) 110-30.
[10] J. Vidic, M. Pla-Roca, J. Grosclaude, M.-A. Persuy, R. Monnerie, D. Caballero, et al., Gold Surface Functionalization and Patterning for Specific Immobilization of Olfactory Receptors Carried by Nanosomes, Analytical Chemistry, 79(2007) 3280-90.
[11] B.L. Cook, D. Steuerwald, L. Kaiser, J. Graveland-Bikker, M. Vanberghem, A.P. Berke, et al., Large-scale production and study of a synthetic G protein-coupled receptor: Human olfactory receptor 17-4, Proceedings of the National Academy of Sciences, 106(2009) 11925-30.
[12] C. Hurot, S. Brenet, A. Buhot, E. Barou, C. Belloir, L. Briand, Y. Hou, Highly sensitive olfactory biosensors for the detection of volatile organic compounds by surface plasmon resonance imaging, Biosensors and Bioelectronics, 123(2019) 230-236.
[13] C. Nylander, B. Liedberg, T. Lind, Gas detection by means of surface plasmon resonance, Sensors and Actuators, 3(1982) 79-88.
[14] B. Liedberg, C. Nylander, I. Lunström, Surface plasmon resonance for gas detection and biosensing, Sensors and Actuators, 4(1983) 299-304.
[15] S. Zuccon, M.G. Pelizzo, P. Nicolosi, D. Buso, A. Martucci, Different sensing layers for SPR sensing of organic vapours, in: G.B. Smith, A. Lakhtakia (Eds.), Nanostructured Thin Films, SPIE, San Diego, Etats-Unis, 2008.
[16] L.L. Zhang, X. Chen, J.H. Sun, H.Y. Cai, H. Li, Y.P. Chao, et al., A poly(dimethylsiloxane) based prism for surface plasmon resonance imaging system and its application for gas detection, Review of Scientific Instruments, 84(2013) 035001.
[17] J.N. Wilde, M.C. Petty, J. Saffell, A. Tempore, L. Valli, Surface plasmon resonance imaging for gas sensing, Measurement & Control, 30(1997) 269-72.
[18] H. Nanto, F. Yagi, H. Hasunuma, Y. Takei, S. Koyama, T. Oyabu, et al., Multichannel Odor Sensor Utilizing Surface Plasmon Resonance, Sensors and Materials, 21(2009) 201-8.
[19] S. Brenet, A. John-Herpin, F.-X. Gallat, B. Musnier, A. Buhot, C. Herrier, et al., Highly-Selective Optoelectronic Nose Based on Surface Plasmon Resonance Imaging for Sensing Volatile Organic Compounds, Analytical Chemistry, 90(2018) 9879-87.
[20] W.-J. Zhou, A.R. Halpern, T.H. Seefeld, R.M. Corn, Near Infrared Surface Plasmon Resonance Phase Imaging and Nanoparticle-Enhanced Surface Plasmon Resonance Phase Imaging for
Ultrasensitive Protein and DNA Biosensing with Oligonucleotide and Aptamer Microarrays, Analytical Chemistry, 84(2012) 440-5.
[21] B.P. Nelson, A.G. Frutos, J.M. Brockman, R.M. Corn, Near-Infrared Surface Plasmon Resonance Measurements of Ultrathin Films. 1. Angle Shift and SPR Imaging Experiments, Analytical Chemistry, 71(1999) 3928-34.
[22] G. Steiner, Surface plasmon resonance imaging, Anal Bioanal Chem, 379(2004) 328-31. [23] W.N. Hansen, Electric Fields Produced by the Propagation of Plane Coherent Electromagnetic Radiation in a Stratified Medium, J Opt Soc Am, 58(1968) 380-90.
[24] L. Laplatine, L. Leroy, R. Calemczuk, D. Baganizi, P.N. Marche, Y. Roupioz, et al., Spatial resolution in prism-based surface plasmon resonance microscopy, Opt Express, 22(2014) 22771-85.
[25] A. Sommerfeld, Lectures on theoretical physics: Optics: Academic Press; 1964. [26] Schott Datasheets.
[27] A. Vial, T. Laroche, Description of dispersion properties of metals by means of the critical points model and application to the study of resonant structures using the FDTD method, Journal of Physics D: Applied Physics, 40(2007) 7152.
[28] A.D. Rakić, A.B. Djurišić, J.M. Elazar, M.L. Majewski, Optical properties of metallic films for vertical-cavity optoelectronic devices, Appl Opt, 37(1998) 5271-83.
[29] K.P. Birch, M.J. Downs, An Updated Edlén Equation for the Refractive Index of Air, Metrologia, 30(1993) 155.
[30] J. Homola, Electromagnetic theory of surface plasmons, Surface plasmon resonance based sensors, Springer2006, pp. 3-44.
[31] J. Homola, Surface Plasmon Resonance Sensors for Detection of Chemical and Biological Species, Chemical Reviews, 108(2008) 462-93.
[32] J. Homola, M. Piliarik, Surface plasmon resonance (SPR) sensors: Springer; 2006.
[33] K. Johansen, H. Arwin, I. Lundström, B. Liedberg, Imaging surface plasmon resonance sensor based on multiple wavelengths: Sensitivity considerations, Review of Scientific Instruments, 71(2000) 3530-8.
[34] R.B. Schasfoort, A.J. Tudos, Handbook of surface plasmon resonance: Royal Society of Chemistry; 2008.