HAL Id: hal-00297094
https://hal.archives-ouvertes.fr/hal-00297094
Submitted on 9 Apr 2008
HAL is a multi-disciplinary open access
archive for the deposit and dissemination of
sci-entific research documents, whether they are
pub-lished or not. The documents may come from
teaching and research institutions in France or
abroad, or from public or private research centers.
L’archive ouverte pluridisciplinaire HAL, est
destinée au dépôt et à la diffusion de documents
scientifiques de niveau recherche, publiés ou non,
émanant des établissements d’enseignement et de
recherche français ou étrangers, des laboratoires
publics ou privés.
Intercomparison of simulations using 5 WRF
microphysical schemes with dual-Polarization data for a
German squall line
W. A. Gallus Jr., M. Pfeifer
To cite this version:
W. A. Gallus Jr., M. Pfeifer. Intercomparison of simulations using 5 WRF microphysical schemes
with dual-Polarization data for a German squall line. Advances in Geosciences, European Geosciences
Union, 2008, 16, pp.109-116. �hal-00297094�
© Author(s) 2008. This work is distributed under the Creative Commons Attribution 3.0 License.
Geosciences
Intercomparison of simulations using 5 WRF microphysical schemes
with dual-Polarization data for a German squall line
W. A. Gallus, Jr.1and M. Pfeifer2
1Iowa State University, Ames, IA, USA
2DLR Institute of Atmospheric Physics, Oberpfaffenhofen, Germany
Received: 1 August 2007 – Revised: 12 December 2007 – Accepted: 25 January 2008 – Published: 9 April 2008
Abstract. Simulations of a squall line system which
oc-curred on 12 August 2004 near Munich, Germany are per-formed using a fine grid version of the Weather Research and Forecasting (WRF) model with five different micro-physical schemes. Synthetic dual polarization observations are created from the model output and compared with de-tailed observations gathered by the DLR polarimetric radar POLDIRAD located near Munich. Synthetic polarimetric radar scans are derived from the model forecasts employing the polarimetric radar forward operator SynPolRad. Evalua-tions of the microphysical parameterization schemes are car-ried out comparing Plan Position Indicator (PPI) and Range Height Indicator (RHI) scans of reflectivity and the spatial distribution of hydrometeor types. The hydrometeor types are derived applying a hydrometeor classification scheme to the observed and simulated polarimetric radar quanti-ties. Furthermore, the Ebert-McBride contiguous rain area method of verification is tested in a variety of ways on the re-flectivity output from the simulations. It is found that all five schemes overestimate reflectivity in the domain, particularly in the stratiform region of the convective system. All four schemes including graupel as a hydrometeor type produce too much of it. Differences are seen among the schemes in their depiction of reflectivity in the convective line and their representation of radar bright bands.
1 Introduction
Improvements in computational power in recent years have allowed for increasing use of fully explicit numerical mod-els for weather prediction. It is well-known that the use of convective parameterizations in models introduces
substan-Correspondence to: W. A. Gallus, Jr.
(wgallus@iastate.edu)
tial error, and the use of near-cloud resolving grid spacings may reduce the error since convective schemes can be elimi-nated. However, microphysical schemes may also introduce uncertainty into forecasts (e.g., Jankov et al., 2005), and far fewer studies have been done to verify the results from differ-ent microphysical packages (e.g., Ferrier et al., 1995; Wang, 2002; Gilmore et al., 2004; Colle et al., 2005; Garvert et al., 2005).
In this study, the ability of a fine grid version of the Weather Research and Forecasting (WRF) model to repro-duce accurately the microphysical structure of a squall line is evaluated by comparing WRF simulations using five dif-ferent microphysical schemes to detailed observations gath-ered by the DLR polarimetric radar POLDIRAD (Schroth et al., 1988) located near Munich, Germany. Synthetic polari-metric radar scans are derived from the model forecasts em-ploying the polarimetric radar forward operator SynPolRad (Synthetic Polarimetric Radar; Pfeifer et al., 2004; Pfeifer, 2007). The hydrometeor types are derived applying a hy-drometeor classification scheme (Hoeller et al., 1994) to the observed and simulated polarimetric radar quantities. The Ebert-McBride contiguous rain area method of verification is tested in a variety of ways on the reflectivity output from the simulations.
2 Data and Methodology
On 12 August 2004 a cold front resulted in the development of severe thunderstorms with high reflectivities in southern Bavaria, Germany. A squall line with a sharply defined con-vective line produced hail while a trailing region of strati-form precipitation strati-formed later in the system’s lifetime. The squall line formed prior to 15:00 UTC and reached its max-imum intensity by 17:00–18:00 UTC (Fig. 1), when it was oriented north-south and passing very near the radar. In the
110 W. A. Gallus, Jr. and M. Pfeifer: Intercomparison of simulations using 5 WRF microphysical schemes
a b
c
d e
f
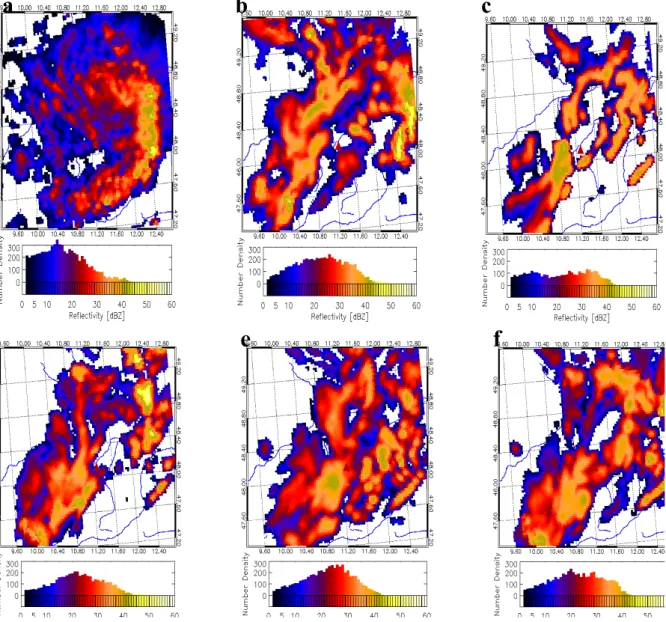
Fig. 1. 1◦ PPI scan of reflectivity [dBZ] at 18:00 UTC (a) observed by POLDIRAD, and simulated by (b) Lin, (c) Thompson-old, (d) Thompson-new, (e) WSM6, and (f) WSM5. Histograms showing distribution of reflectivity values are below each scan. The triangle in each figure indicates the observed (a) or presumed (b–f) location of the radar.
next 1–2 h, the system began bowing and developed a trailing stratiform rain region as it moved eastward.
WRF version 2.1.2 with the ARW (Advanced Research WRF) dynamic core was run over a 280 by 280 km inner do-main centered near Munich, Germany, having 2.8 km grid spacing, nested within a larger 1000 by 1000 km domain having 8.4 km grid spacing. Simulations were integrated for 24 h using 00:00 UTC 12 August GFS output for initializa-tion and lateral boundary condiinitializa-tions. No convective param-eterization was used on either grid. The five microphysical schemes used included Lin et al (Lin et al., 1983; Chen and Sun, 2002), older Thompson (Thompson et al., 2004), new
Thompson, WRF Single Moment – 6 class (WSM6; Hong et al., 2004), and WRF Single Moment – 5 class (WSM5; Hong et al., 2004). The WRF runs will be referred to as Lin, Thompson-old, Thompson-new, WSM6, and WSM5 hereafter. All versions of the model used the Dudhia short-wave and RRTM (Rapid Radiative Transfer Model) long-wave radiation schemes (Dudhia, 1989), “Noah” land sur-face model, and Yonsei University (YSU) planetary bound-ary layer scheme.
Synthetic polarimetric radar observables were calculated from the different model runs employing the polarimetric radar forward operator SynPolRad. SynPolRad calculates
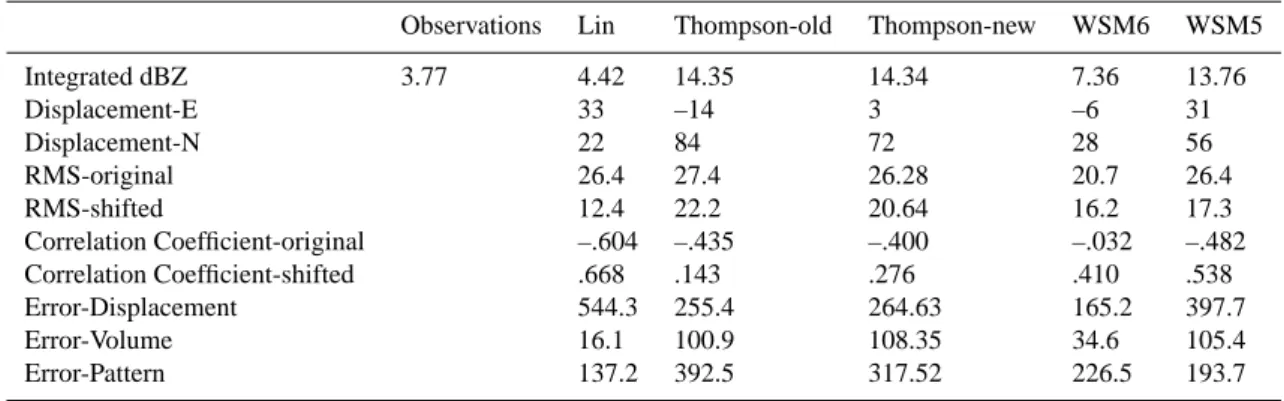
Table 1. CRA analysis results at 18:00 UTC for all model runs showing integrated reflectivity (×103dBZ km2), displacements in km east (E) or north (N), root mean square error (RMS) and correlation coefficients before and after shifting the CRA to account for displacement error, with error decompositions (displacement, volume, pattern) in dBZ2.
Observations Lin Thompson-old Thompson-new WSM6 WSM5 Integrated dBZ 3.77 4.42 14.35 14.34 7.36 13.76 Displacement-E 33 –14 3 –6 31 Displacement-N 22 84 72 28 56 RMS-original 26.4 27.4 26.28 20.7 26.4 RMS-shifted 12.4 22.2 20.64 16.2 17.3 Correlation Coefficient-original –.604 –.435 –.400 –.032 –.482 Correlation Coefficient-shifted .668 .143 .276 .410 .538 Error-Displacement 544.3 255.4 264.63 165.2 397.7 Error-Volume 16.1 100.9 108.35 34.6 105.4 Error-Pattern 137.2 392.5 317.52 226.5 193.7
the interaction of the radar beam with the hydrometeors (scattering and attenuation) using the T-Matrix scattering code (e.g. Vivekanandan, 1990). The T-Matrix method is a powerful technique for computing light scattering by non-spherical particles based on solving Maxwell’s equations, and it thus allows for the simulation of polarimetric signa-tures (Waterman, 1969; Mishchenko, 1998). The T-Matrix method is applicable to randomly oriented particles but par-ticles are normally assumed to be rotationally symmetric in order to save computational time. A fundamental feature of the approach is that it is independent on the incident and scat-tered fields and only depends on the shape, size and refractive index of the scattering particles as well as its orientation. The T-Matrix method has been used often in radar meteorology to simulate scattering by nonspherical particles (e.g., Vivekan-dandan et al., 1993; Zrnic et al, 2000). SynPolRad employs a version of T-Matrix code which also considers Rayleigh or Mie scattering (Bringi, 1998) if the assumptions are valid to reduce computational costs.
In a second step, the propagation of the radar beam in the model domain considering refraction and attenuation is sim-ulated. The verification is based on observed and synthetic reflectivity and the hydrometeor types derived from the hy-drometeor classification. The classification is based on ob-served and simulated linear depolarization ratio (LDR) and differential reflectivity (ZDR). All verification was done on the inner 2.8 km grid spacing domain. The observations were interpolated onto the model grid to allow comparisons at the same horizontal resolution. Subjective verification was per-formed using observed and synthetic Plan Position Indica-tor (PPI) and Range Height IndicaIndica-tor (RHI) plots of reflec-tivity and a hydrometeor classification. In addition, objec-tive verification was performed using a version of the Ebert-McBride technique (EMT; Ebert and Ebert-McBride, 2000) ap-plied to mesoscale convective systems (MCSs) in the central United States (Grams et al., 2006). The EMT identifies
con-tiguous rainfall areas (CRAs) which can be used to determine displacement errors within models. The EMT was applied at 18:00 UTC assuming no temporal error in the simulations, and also applied accounting for temporal errors.
3 Results
Simulated and observed 1◦PPI scans of radar reflectivities are compared in Fig. 1. At this time, all runs have too much areal coverage of reflectivity, particularly in the northern and western parts of the domain. When the EMT was applied at 18:00 UTC to each simulation, it was found that only WMS6 did not have a high bias in the number of points with positive reflectivity values. Lin and WSM5 both were the worst with a roughly 60% overestimate of the number of points. Aver-age simulated reflectivities in the domain using all schemes were roughly double those observed, reflecting both an over-estimate in areal coverage and in intensity. However, the maximum values at any grid point at 18:00 UTC were rel-atively close to the 50 dBZ values observed, implying in-tensity errors were more pronounced for smaller reflectivity values.
Using 25 dBZ as the threshold for which the EMT scheme determines its CRAs (Table 1), Lin best depicted the squall line, with an overestimate of integrated reflectivity of around 20%. By contrast, the overestimates exceeded 90% for WSM6 and 250% for the other schemes. These results sug-gest far too much reflectivity above 25 dBZ was present in those schemes. Displacement error was smallest, however, in WSM6, around 30 km to the NNW with other schemes having errors of 45–80 km to the NNW (Thompson-old), N (Thompson-new), NE (WSM5) or ENE (Lin). Thus in all runs, there was a tendency at this time to show too much re-flectivity north of the main squall line. RMS errors prior to accounting for displacement error were similar in all runs ex-cept WSM6, which had the smallest error. After accounting
112 W. A. Gallus, Jr. and M. Pfeifer: Intercomparison of simulations using 5 WRF microphysical schemes
a b c
d e f
Fig. 2. As in Fig. 1 except observations valid at 19:06 UTC with simulations valid at time of best stratiform region organization, 19:00 UTC for Lin (b) and 20:00 UTC for all other schemes (c–f).
for displacement error, Lin improved the most and had the smallest RMS error. Lin also showed a dramatic shift in the correlation coefficient as displacement was taken into ac-count. This result suggests that the forecasted reflectivity structure was very good but a displacement error was present. An error decomposition provided by the EMT, based on Mur-phy’s (1995) representation of mean square error (thus units for these terms in Table 1 are dBZ2), agrees with this anal-ysis. It suggests the worst displacement error was present in Lin. The smallest displacement error was in WSM6, which also had the smallest total error. Total errors were much larger and relatively similar in the other 4 runs. Pattern er-rors were responsible for most of the error in WSM6 and both Thompson versions, while displacement errors domi-nated Lin and WSM5. Overall, the 18:00 UTC verification
generally suggests WSM6 performed the best at this time. It should be noted, however, that automated approaches to identifying systems may not always link the observed system to the simulated system most forecasters would assume rep-resented the observed event, particularly when the forecasted event only partially resembles the observations. As can be seen in Fig. 1, both Thompson runs produce an arc of pre-cipitation with much of it well to the north of the observed system. The EMT emphasizes the northern portions of the forecasted rain areas in these runs, and because the orienta-tion of the high reflectivity regions there is east-west while the observed event was oriented north-south, especially large pattern errors result. In addition, the relatively low volume error associated with the Lin run is likely partly due to the fact that some of the forecasted rainfall is shifted off of the
a
b
c
d e
f
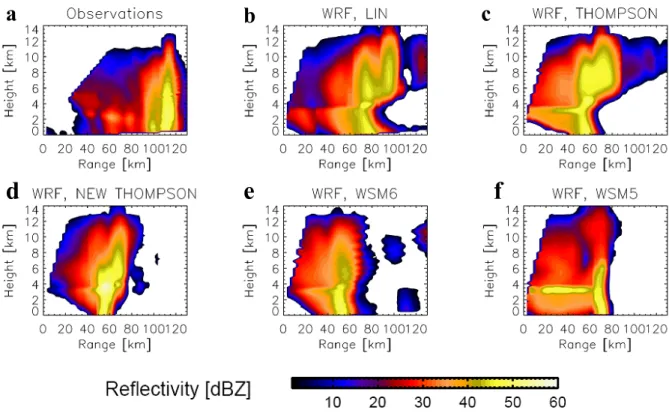
Fig. 3. RHI scans at 18:00 UTC for (a) observations, (b) Lin, (c) Thompson-old, (d) Thompson-new, (e) WSM6, and (f) WSM5.
verifying domain when the displacement error is taken into account. Grams et al. (2006) discusses these issues in more detail.
Because timing errors can be responsible for problems in the forecasts, the EMT was also applied to the simulations allowing for a small shift in the timing of key events in the evolution of the squall line. In particular, the verification was performed at the time when the system was intense near Mu-nich, and at a time when the system had a well-developed stratiform region. Regarding the comparison at time of best convective organization, only WSM6 seemed to have the cor-rect timing for when the squall line was intense and oriented north-south around 17:00 UTC. The other schemes produced squall lines that developed too quickly, passing the Munich area around 16:00 UTC instead of 17:00 UTC. For the entire domain at the time of best convective line structure all model versions underestimated the number of points with reflectiv-ity (not shown). The average reflectivities in the domain were much closer to the observed value than in the 18:00 UTC analysis, with underestimates of only 2-4 dBZ in the peak grid point values. The better performance at this earlier time suggests that the simulations had more problems with exces-sive production of hydrometeors at later times in the lifetime of the system.
Regarding CRAs at the time of best convective line or-ganization, all models overestimated the areal coverage of reflectivity above 25 dBZ. Considering that all models un-derestimated the areal coverage of any positive reflectivity
within the full domain, this implies the models are aggres-sive at producing relatively high reflectivity values, but lack-ing in lighter reflectivity areas at this time. Displacement er-rors were much smaller in all runs, which makes sense since the temporal error was subjectively accounted for by choos-ing times when the model output best resembled the obser-vations. In all cases the displacements were less than 27 km. Changes in RMS error and correlation coefficient after ac-counting for the displacement error were much smaller than at 18:00 UTC for a similar reason. The best RMS errors were present in WSM6 and WSM5. The best correlation coeffi-cients were in WSM5. In all 5 runs, pattern errors were by far the biggest contributor to the total error, and the total er-ror was smallest in WSM5 and largest in the Thompson runs. A sensitivity test was performed for the model data at these times to determine what role the reflectivity threshold param-eter played in the EMT results. In a test using 30 dBZ instead of 25 dBZ, noticeable changes occurred in some parameters for some model runs but the changes were not substantial enough to change the results described above.
A stratiform rain region was well-developed in the radar data by 19:00 UTC (Fig. 2). In the model simulations, its evolution was dependent on the microphysical scheme used (Fig. 2). Subjectively, the best agreement in the general lo-cation and areal coverage of the stratiform rain region with that in the simulations occurred when 19:00 UTC observa-tions were compared with the 19:00 UTC Lin output and with 20:00 UTC output from all of the other schemes,
im-114 W. A. Gallus, Jr. and M. Pfeifer: Intercomparison of simulations using 5 WRF microphysical schemes
Figure 4: Vertical cross-sections corresponding to those used in Fig. 3, but depicting the domi
a b
c
d
e
f
Fig. 4. Vertical cross-sections corresponding to those used in Fig. 3, but depicting the dominant hydrometeor species in the radar data (a) and in the named model runs (b–f). Light orange indicates wet hail, cyan – dry hail, yellow – graupel, dark orange – snow, dark blue – heavy rain, medium blue – light rain.
plying a lag in development in most of the model runs. None of the model runs showed as much organization to the strat-iform region as observations indicated. For the entire do-main at the time of best depiction of a stratiform region, the areal coverage of positive reflectivity evidenced very differ-ent trends compared to the areal coverage at time of maxi-mum intensity of the convective line. All 5 model versions had a low bias in the total number of points with positive reflectivity, with the smallest underestimate of around 13% in Lin, and the worst being almost 50% in both Thompson runs (not shown). Average reflectivities, however, were too high in all runs except Thompson-old. These trends suggest that all of these microphysical schemes fail to produce large
enough areas of low reflectivity, and continue to show too many areas of moderately high reflectivity. A comparison of histograms in Fig. 2 shows that the models depict too lit-tle coverage of reflectivities below roughly 20 dBZ and too much coverage above, giving the histograms a more Gaus-sian shape than that present for the observations. The un-derrepresentation for smaller reflectivities is due to the fact that SynPolRad does not consider beam broadening; there-fore, the simulated radar beam is assumed to be totally filled by scatterers while in the observations, especially at longer ranges, beams are normally only partially filled which re-duces reflectivity. The overestimation of the higher reflectiv-ities is due to the simulations incorrectly representing
itation type and intensity. Also, the models tend to overesti-mate the brightband due to enhanced snow mixing ratios and the assumption of very broad snow size distributions near the 0◦isotherm.
For the CRAs identified at this time, all runs continued to overestimate the area of reflectivity above 25 dBZ (not shown). Northward displacements existed in all runs, with significant eastward displacements in all but the WSM5. The eastward displacements might suggest that the model ver-sions failed to develop enough stratiform rainfall to the rear of the system. The smallest RMS errors occurred in WSM5 after accounting for displacement error. The worst error was present in Lin. All correlation coefficients were negative prior to shifting the CRA; after the shift, the WSM5 value improved to .367 while the other runs had more modest im-provements to around 0. Pattern errors dominated the error decomposition in all runs, but were relatively less severe in WSM5.
Errors were also apparent in the RHI (range-height indi-cator) scans of the simulated reflectivities (Fig. 3). These images were created around 18:00 UTC by taking vertical cross-sections through the systems at a point where the con-vective line subjectively appeared to be most intense. All runs had too much water mass at high levels in the strati-form regions, although the problem was less severe with Lin. Lin and both Thompson runs had too much high reflectiv-ity at upper levels ahead of the main convective line. All schemes except Lin also had too much reflectivity at low levels in the stratiform region. The bright band behind the line was too intense in all runs except Lin and Thompson-new. The too intense bright band was especially noticeable in WSM5. Within the convective line, Lin was too weak with reflectivity in both the rain and ice regions, WSM6 was too weak aloft but acceptable in the rain region, Thompson-old was too intense aloft, Thompson-new was better aloft but too intense in the rain region, and WSM5 agreed best with obser-vations. Both Lin and the two Thompson versions incorrectly depicted a bright band in this region. Overall, Lin seemed to best capture the structure of the reflectivity, despite having an incorrect depiction of a convective cell ahead of the line at high levels. It was the run that came closest to showing the reflectivity structure correctly behind the convective line.
Dual-polarization radar can be used to diagnose the hy-drometeor species present in the data, and therefore, this radar offers one of the few ways available to verify qualita-tively the mixing ratio contents of different species produced by microphysical schemes. Figure 4 shows the hydrome-teor species dominating in the observations and each of the 5 model runs. In all model runs except WSM5, far more grau-pel was produced than was present in the radar data. WSM5 likely avoids this problem because it does not include a grau-pel classification. It should be noted that the T-matrix scat-tering code used by SynPolRad simulates attenuation, and as with any radar, incorrect hydrometeor classifications may re-sult in bright band regions or areas with strong attenuation,
such as the area just behind the convective line. Anomalous depiction of wet and dry hail in Fig. 4 near the stratiform bright band area and the heavy rain of the convective line can be seen.
4 Summary and conclusions
Five high resolution WRF simulations using different micro-physical schemes were compared with detailed observations of a German squall line gathered by the DLR polarimetric radar POLDIRAD. Synthetic polarimetric radar scans were derived from the model forecasts employing the polarimetric radar forward operator SynPolRad. The evaluation of the mi-crophysical parameterization schemes was carried out com-paring PPI and RHI scans of reflectivity and the spatial dis-tribution of hydrometeor types. Additionally, the EMT was used for quantitative verification.
All microphysical schemes were found to share some problems. For instance, all resulted in runs that had too little areal coverage of reflectivity early in the development of the convective line, but quickly produced too intense re-flectivities on average throughout the domain. At all times evaluated, all runs seemed to produce too many areas with intense reflectivity (generally over 25 dBZ) and not enough areas with light reflectivity. All runs overestimated reflec-tivity in the stratiform portion of the system as it matured. The hydrometeor classification scheme also showed that all runs that included a graupel classification incorrectly de-picted graupel as the dominant hydrometeor aloft throughout the system when snow was the dominant observed hydrome-teor.
Other deficiencies affected a subset of the microphysical schemes. Bright bands were incorrectly shown within the convective lines of the Lin and Thompson runs. Reflectivities within ice were too small in the convective lines of the Lin and WSM6 runs, but too large in the Thompson-old run. Re-flectivities within the convective rain region were too small in the Lin run. All runs except Lin had too much reflectivity in the stratiform anvil. The bright band was overestimated in WSM5 and Thompson-old.
Although the results suggest problems exist in all of the microphysical schemes tested, it must be noted that some of the problems may be due more to other model errors, such as incorrect dynamics, lateral boundary effects, and incorrect depiction of vertical motion. Future work should examine the role of these other problems and investigate the sensitivity of the results to the grid spacing used in the model, and extend the sample to other cases including other convective modes. If the results found for this squall line are robust, techniques like SynPolRad could be used to help model developers make changes in their microphysical schemes to better agree with radar observations. The impacts of such changes on rainfall, however, would have to be investigated.
![Fig. 1. 1 ◦ PPI scan of reflectivity [dBZ] at 18:00 UTC (a) observed by POLDIRAD, and simulated by (b) Lin, (c) Thompson-old, (d) Thompson-new, (e) WSM6, and (f) WSM5](https://thumb-eu.123doks.com/thumbv2/123doknet/14761149.585214/3.892.95.811.103.760/fig-ppi-reflectivity-observed-poldirad-simulated-thompson-thompson.webp)