Publisher’s version / Version de l'éditeur:
Noise Control Engineering, 13, 2, pp. 76-82, 1979-09
READ THESE TERMS AND CONDITIONS CAREFULLY BEFORE USING THIS WEBSITE. https://nrc-publications.canada.ca/eng/copyright
Vous avez des questions? Nous pouvons vous aider. Pour communiquer directement avec un auteur, consultez la
première page de la revue dans laquelle son article a été publié afin de trouver ses coordonnées. Si vous n’arrivez pas à les repérer, communiquez avec nous à PublicationsArchive-ArchivesPublications@nrc-cnrc.gc.ca.
Questions? Contact the NRC Publications Archive team at
PublicationsArchive-ArchivesPublications@nrc-cnrc.gc.ca. If you wish to email the authors directly, please see the first page of the publication for their contact information.
NRC Publications Archive
Archives des publications du CNRC
This publication could be one of several versions: author’s original, accepted manuscript or the publisher’s version. / La version de cette publication peut être l’une des suivantes : la version prépublication de l’auteur, la version acceptée du manuscrit ou la version de l’éditeur.
Access and use of this website and the material on it are subject to the Terms and Conditions set forth at
Prediction versus reality: A preliminary evaluation of the NRC traffic
noise model
Halliwell, R. E.; Quirt, J. D.
https://publications-cnrc.canada.ca/fra/droits
L’accès à ce site Web et l’utilisation de son contenu sont assujettis aux conditions présentées dans le site LISEZ CES CONDITIONS ATTENTIVEMENT AVANT D’UTILISER CE SITE WEB.
NRC Publications Record / Notice d'Archives des publications de CNRC:
https://nrc-publications.canada.ca/eng/view/object/?id=51e7ae21-4593-4c65-85e6-e373ab34f8fb https://publications-cnrc.canada.ca/fra/voir/objet/?id=51e7ae21-4593-4c65-85e6-e373ab34f8fb
I
RefI
I 8 S e r
1
TH1
National Research
Conseil national
N21d
I
$*
Council Canada
de recherches Canada
I
110.816
I I
1
I,,
PUB
PREDICTION VERSUS REALITY:
I
A PRELIMINARY EVALUATION OF
1
THE NRC TRAFFIC NOISE MODEL
by
R.E. Halliwell and J.D. Quirt
Reprinted from
Noise Control Engineering
Vol.
13,No.
2,September-October 1979
p. 76
82DBR Paper No. 876
Division
ofBuilding Research
SOMMAIRE
Un programme de relev6s sonares a i.te entrepris afin d'svaluer la
validit6 du modsle de prediction des bruits de la circulation mis au point par le Conseil national de recherches du Canada.Les ana-
lyses pr6limiqaires des dann6es de neuf sites montrent un bon
accord entre les niveaux th6oriques et mesurEs,mais indi.qoent des
Prediction Versus Rea
I
A Preliminary Eva uation of
the
NRC Traffic Noise Model*
R. E. Halliwellt and J. D. Quirtf discuss a program of field measurements that
has been initiated to evaluate the validity of the road noise prediction model
developed by the National Research Council of Canada. Preliminary analysis
of the data from nine sites shows good agreement between the measured and
predicted levels, but indicates some discrepancies for configurations that
include barriers.**
The National Research Council of Canada (NRC) traffic noise prediction model, described by Northwood, Quirt, and Halliwell, required extensive field testing to validate some of the assumptions on which it is based.' The model was tested against published data where possible, but to a s s e s s properly s o m e of t h e simplifications used, a program of systematic measurements was essential. This article describes the instrumentation developed to carry out this program and reports some preliminary findings from the first season of measurements.
Instrumentation
Because one major concern of the study is the attenua- tion of noise due to ground absorption, a grid of micro- phones was required to measure the noise level as a function of receiver height above the ground and distance from the source.
To
facilitate this measurement and to reduce the time spent in analysis, a small van was equipped with a computer-based data acq~~isitinn anrl analysis system. A block diagram of this system is shown in Fig. 1.*Received 1 December 1978; revised 4 June 1979
tDivision of Building Research, National Research Council of
Canada, Ottawa, Ontario KIA OR6, Canada Figure I-Block diagram of measurement system. The bnsic **This paper is a contribution from the Division of Building system is shown at left. Noise data can also be tope-recorded
Research, National Kesearch Council ot Canada, and 1s and played back through the frequency-analysis system shown published with the approval of the Director of the Division. at right.
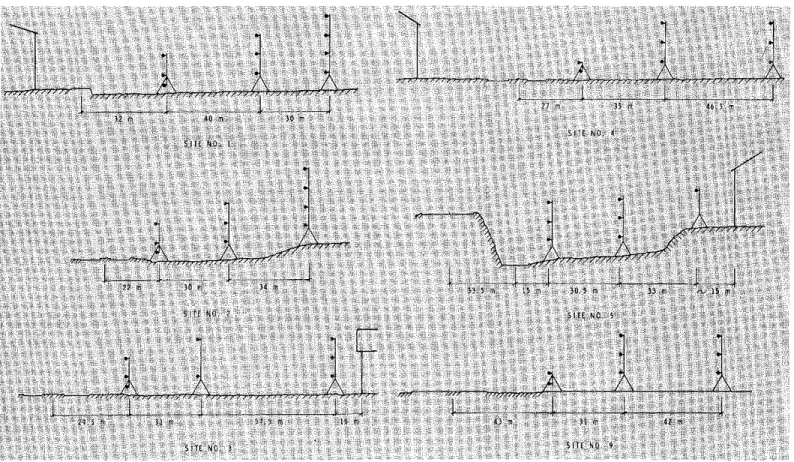
Figure 2-Cross sections of openfield sites. The vertical scale has been expanded for the soke of clarity
Noise measurements were made with ten 1.27-cm condenser microphones (B&K Type 4149) equipped with rain covers and windscreens (B&K UA 0393 and UA 0331). The microphones use battery-powered supplies (B&K Type 2804) modified by the inclusion of amplifiers with 30 dB of gain to reduce the noise pickup from transmission over long cables. Within the mobile laboratory, the signal from each microphone is passed through an amplifier (where extra gain or attenuation can be added a s required) into a filter network which gives both A-weighted and C- weighted outputs. Each of these filtered signals is channeled to a true rms converter (Analog Devices Type 442 K) with a time constant of 30 ms. Outputs of the rms converters are then sampled by a multichannel analog-to- digital converter interfaced to a mini-computer.
The resultant twenty signals (two from each micro- phone) are scanned 128 times per second, and a running average of each is stored in the computer. These averages are sampled, usually once per second, and various desired noise descriptors are calculated. The type of averaging (linear or exponential), the appropriate time constant or averaging period used, and the sampling rate can be selected under computer control. This flexibility allows the operator to tallor the response of the entire system to the type of measurement being made. Thus, it is possible to duplicate the response of a Type
I
sound level meter on "slow" or "fast" response or, if desired, that of an impulsesound level meter. The outputs.from three Gill anemom- eters are also sampled during the measurement period to determine the range of wind speeds.
This system gives the various noise descriptors based on the A-weightsd and C-weighted levels, but does not provide any spectral information. For spectrum analysis, an auxiliary system consisting of two seven-channel FM tape recorders is included to make simultaneous record- ings from all microphones. One-third octave analysis can subsequently be performed by playing the tape recording back through a set of one-third octave filters (B&K Type 5004). The output of these filters can be measured by the computer via the rms converters and the analog-to-digital converter. This provides the full capabilities of a real time analyzer under software control.
Measurement Procedure
The microphones are mounted 1, 2, 4, 6, or 8 m above ground on three portable masts. Typically, the masts are arranged in a single line perpendicular to the roadway, with the most remote mast up to 120 m from the centerline of the roadway.
Measurements are usually conducted for periods of 15 minutes. This period of time is long enough to average out short-term fluctuations caused by individual vehicles, yet
D I S T A N C E F R O M S O U R C E , m 20
15
Figure 3-Attenuation relative to reference position for on effective height of 5.5 m. Solid line gives the predicted attenuation.
-
I
I
I
I
S I T E N O . 1 0 2 .-
3 A-
4 A E F F E C T I V E T O T A L H E I G H T , rnFigure 4-Variation of attenuation with height relative to reference position at a distance of 86 m at site no. 2. Solid line gives the predicted attenuation.
short enough that the sample is not influenced by changes in traffic density. On occasions when the traffic density is very low, the measurement period is extended to 30 minutes. A manual count is taken of the traffic during the measurement period, since there is no other simple method to determine the percentage of heavy vehicles. At the end of each period, the temperature and relative humidity are measured and entered into the computer, along with the traffic count information. Before each set of measurements, the microphones are calibrated and the necessary corrections entered into the computer. These corrections are then automatically applied to all of the measured levels.
The prediction model does not include any considera- tion of meteorological conditions, on the assumption that over a long period of time, the atmospheric effects will average out. Nevertheless, meteorological data were collected during each measurement period and recorded for possible future analysis. The measurements reported here were made on days with fair weather and negligible wind, and would not be expected to require any significant corrections.
Evaluation of Data
Measurements were made at nine different locations during the first season of operation with this system. Five of the sites were open grassy fields adjacent to a freeway or arterial road with free-flowing traffic, one was a paved parking lot adjacent to a freeway, and three were on side streets perpendicular to a freeway.
At each of the five grassy field sites the road was straight and level, providing a clear, unobstructed view of the traffic in both directicns. Four of the five locations had reflecting surfaces, either on the other side of the road or behind the rearmost microphone mast. In these cases, the estimated effects of the reflections were taken into consideration when t h e measured levels were compared with t h e predicted levels. T h e c r o s s sections of t h e s e sites, showing the microphone positions, are presented in Fig. 2.
Site no. 1 is beside a 50 km/h two-lane arterial; site no. 2,
beside a 60 km/h four-lane arterial; and sites no. 3,4,5, and
9, beside a 100 km/h freeway.
The data from these sites were used t o assess several features of the prediction model discussed in the preceding paper.' The attenuation of noise as a function of distance from the centerline of the road for one effective total height is shown in Fig. 3. Results for other effective total heights are similar. The effective total height parameter was developed in the prediction model to deal with the excess attenuation that occurs with propagation near soft ground surfaces. It is the sum of the heights above ground of the noise source, the receiving point, and, if there is an intervening barrier, its height above ground on both sides.' It may be viewed as an approximate measure of the proximity of the shortest propagation path to the ground. The source height used is the equivalent source height.
This is an average of the source heights for cars (tire noise) and for trucks (exhaust and tire noise), suitably weighted a s a function of the percentage of trucks and of the average speed of traffic as discussedin Refs. 1 and 2 . The solid line
. 1
shown in the fisure is the attenuation c u r ~ e
-
~redlcred bvI
the model, relative to a reference point 1 m above the ground at 30 m from the centerline of the road.
The prediction model is divided into two steps: a prediction of the noise level at a reference point 1 m above the ground, 30 m from the centerline (in the absence of barriers or other sources of excess attenuation), and a prediction of the difference in level between the reference point and the receiving point. To examine the dependence of the attenuation on distance and height alone, indepen- dent of any possible errors in the source model, the data were adjusted s o that for each site the difference between the measured level and the predicted level, averaged over all microphone locations, was zero. It was found that this adjustment varied from +2 dB to -2 dB, depending on the -.
site and to some extent on the traffic mix. This may be o JO 6 0 10 1 2 0
caused by variations in topography (such as ditches or
small hummocks). variations in the tvue and condition of O l 5 i R N C t i R O h l S O U R C E , s
. . . .
the road surface, or errors in the source model. Figure 5-Attenuation relative t o reference position for site no. 9.
Dashed line gives the predicted attenuat~on, with the assumption
The residual scatter in Fig. 3 be the result several of hardground throughout. A a n d B orepredictedattenuations. effects. The effective total height varied from site to site by
as much as 0.3 rn from the nominal value shown. The ground cover and topographical details differed greatly among sites, although all were treated as acoustically soft
lane surfaces. Errors mav also have been introduced through the effective source height, especially from the rather arbitrary definition of a heavy vehicle.'.z
One aspect of particular interest is the variation in sound attenuation as a function of receiver height, for propaga- tion over a soft ground surface. This is illustrated more clearly by the data for receiving points 86 m from the centerline at site 2, shown in Fig. 4. The solid line is again the predicted attenuation relative to the sound level at the reference position. The attenuation decreases steadily with increasing effective total height. This particular site was covered with very dense high grass, which may explain why the dependence on receiver height was greater than predicted. Data from other locations also exhibit decreas- ing attenuation with increasing receiver height, but the dependence on height is less pronounced; the average trend shows good agreement with the NRC model's predictions. An independent verification of the predicted dependence on effective total height was recently provided in D. N. May's study of the noise incident on a high-rise building near a major highway.3
For propagation over hard ground, the attenuation predicted by the NRC model is the same for all total effective heights. If more than half of the ground surface between the source and receiving points is soft, then the model allows a ground absorption correction (which decreases with increasina total effective heisht). These ~-~
-
- .
features are illustrated in Fig. 5, which presents the sound Figure 6-Cross sections of residential street sites. The vertical attenuation versus distance for the data from site no. 9, a scale has been expanded for the sake of clarity.
paved parking lot. For the more distant receiving points at 74 m and 116 m from the centerline, only the adjustment for propagation over hard ground (3 dB per doubling of distance) is allowed by the model. The measured attenuations are clustered around the predicted values, with no consistent systematic dependence on receiver height. Because there was a strip of grass 27 m wide alongside the road, a ground absorption correction was applied for the receiving points 43 m from the road. The resulting predicted attenuations for total effective heights of 3.2 m and 2.2 m are indicated in Fig. 5 as A and B, respectively. Although the data for the 43 m distance do not agree perfectly with predictions, they do exhibit the expected trends; that is, the attenuation is greater than that for propagation over hard ground, and there is more attenuation at the receiving point closer to the ground.
The remaining three sites, shown in Fig. 6, were residential streets that terminated at a major freeway which, at two of the sites, was elevated relative to the streets. These three areas were of particular interest because of the impending construction of a noise barrier along this section of the freeway. These sites had the advantage of having very little local traffic, which facilitated measurement of the freeway noise, and the disadvantage of having houses on both sides of the street, which limited the field of view of the freeway to a narrow angle. This last feature is not taken into account in the prediction model in its basic form. As a first approximation, it was assumed that equal angles of view of the freeway contributed equally to the integrated energy.
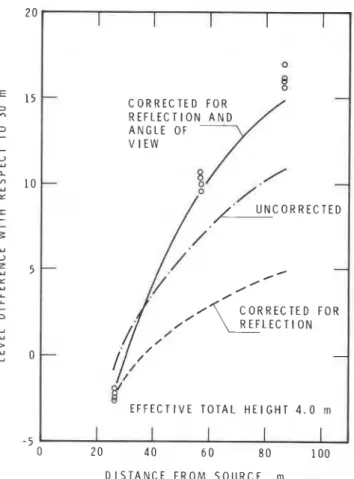
Fig. 7 shows the measured and predicted level differ- ences versus distance from the freeway centerline for one effective height at site no. 6, relative to the level predicted at 30 m. The freeway was not elevated relative to this site; however, there was a high retaining wall on the opposite side, as illustrated in Fig. 6. Allowance was made for this reflecting surface by inclusion of an image source behind the wall. The predicted level differences without correc- tions, with reflection corrections alone, and with reflection and angle of view corrections, are shown in Fig. 7. The resulting curve, after corrections, gives a good fit to the measured levels. The agreement at other heights and for the other two sites is similar. In some cases the edge of the highway constituted a barrier, and further corrections were necessary to allow for the additional attenuation this provided. After corrections for the field of view as already discussed, these data also exhibited consistency between measured and predicted attenuation similar t o that observed for the data in Fig. 7.
How does the model work overall? Fig. 8 shows the predicted levels versus the measured levels for all micro- phones at all five open sites. The solid line indicates the ideal relationship (measured level equal to predicted level). The standard deviation is 3.3 dB from the ideal. Fig. 9 shows the same information for the side streets perpendic- ular to the freeway. The solid line indicates the ideal relationship and the standard deviation is 2.3 dB. For these sites the model predicts noise levels higher than
- 5 0 2 0 4 0 6 0 8 0 1 0 0 D I S T A N C E F R O M S O U R C E . m
I
0!
-
-
C O R R E C T E D F O R A N G L E OF 0 0 C O R R E C T E D F O R #-
E F F E C T I V E T O T A L H E I G H T 4 . 0 mFigure 7-Level difference relative to reference position for effective height of 4 m at site no. 6 . Solid and dashed curves are predicted level differences.
M E A S U R E D L E V E L , d B ( A )
Figure 8-Comparison of predicted level with measured level for open-field sites
Figure 10-Difference between predicted levels and the data of Ref. 5 for receiving positions in an open field behind a roadside barrier
5 0 6 0 70 8 0
M E A S U R E D L E V E L , d B ( A l
Figure 9-Comparison of predicted level with measured level for residential street sites
those measured, especially at points near the source. This one site (such as the road surface) that are not properly
discrepancy may be a result of increased attenuation along accounted for in the model. However, the predicted
the street due to scattering off the buildings, a phenom- sound levels tend to be greater than the measured levels
enon noticed by other worker^.^ for path length differences greater than -0.1 m (the cases
where barrier attenuation is expected). This suggests that the barrier attenuation corrections in the NRC model are
Comparison with Other
Experimental Studies
The data presented here were not sufficient for a thorough evaluation of the NRC traffic noise prediction model. Our own measurement program is continuing, but in the interim, information from other studies has become available.
The extensive data of Rickley et al. are well suited for evaluation of the attenuation provided by barriers.5 Their report includes measurements for many microphone heights and receiver locations in a grassy field behind a barrier adjacent to a major highway. The performance of the barrier was carefully evaluated for four different barrier heights, and comparable measurements were made without the barrier. In Fig. 10, the differences between the NRC prediction and their measured results are presented for all of the measurements at locations behind the barrier. For path length differences less than -0.1 m (where barrier attenuation should be negligible), the predicted sound levels are consistently lower than the measured values. This discrepancy is presumably associated not with the effect of the barrier, but with some characteristics of this
less than the actual attenuation observed here.
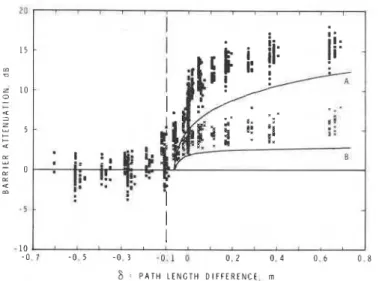
To demonstrate more clearly, some of these data are presented in a different manner in Fig. 11. Each point plotted in Fig. 11 was determined by subtracting the measured sound level from a value calculated using the NRC model, with two changes. The first change was the addition of a site adjustment term, to give a mean deviation of 0 dB between predicted levels and the data measured at equivalent positions with no barrier present (thus reducing the errors in the predicted values associated with factors other than barrier attenuation). The second change was the omission of the barrier attenuation term. To the
extent that these calculated levels represent the actual
,
sound level in the absence of the barrier, the plotted points can be considered as the measured barrier attenuation. The squares are for measuring positions 17 m behind the barrier and 150 m from both ends; the crosses are for positions at the same distance from the barrier, but directly in line with one of its ends. Curves A and B are the barrier attenuations predicted by the NRC model for these two situations. In both cases, the measured attenuations tend to be several decibels greater than the predicted values. It should be noted that the predicted barrier attenuation is deliberately conservative to allow for such possible
Figure 1 1 -Comparison of measured and predicted barrier
attenuation for a subset of the data in Fig. 10 40
40 5 0 6 0 70 8 0 9 0
M E A S U R E D L E V E L , d B ( A )
Figure 12-Comparison of predicted level with measured level for data provided by J . S . Bradley6
complications a s reflections from nearby buildings.' Thus, some deviation between curve A and the plotted squares in Fig. 11 is expected. A second source of the deviations is the adjustment in the calculated ground attenuation to allow for the presence of the barrier. This might explain part of the difference between measured and predicted values for the receiving position behind the middle of the barrier, and is the dominant concern at the position behind the end of the barrier. At that position, half of the line source is directly visible, and the barrier attenuation should therefore not exceed 3 dB. However, because the prediction model allows only the reduced ground attenua- tion that would be appropriate if the barrier were present in both halves of the field of view, the net effect is ecluivalent to a somewhat larger barrier attenuation.2 Obviously, for sites such a s that considered in Figs. 10 and 11, the NRC model systematically underestimates the effectiveness of barriers by several decibels. However, for the more complicated sites in urban and suburban areas, the con- servative prediction of barrier attenuation is likely to be justified.
The portion of the noise prediction model dealing with the actual noise source was also assessed employing data from other experimental studies. The most useful of these
were the data of J. S. Bradley, who made half-hour
measurements (close to the roadside at 138 sites) of the noise from freely flowing traffic.6 A comparison of these measurements with the predicted values is shown in Fig. 12. The rms deviation of the measured sound levels from the predicted values was 2.0 dB. These data, in conjunc-
tion with our own, included a wide range of traffic speeds and percentages of heavy vehicles, and suggest that the model for the noise emitted by traffic is quite reliable for a broad range of traffic conditions.
Conclusions
Preliminary study shows that noise predictions based on the NRC model are in good agreement with measured levels for simple configurations. Data collection is continuing, with emphasis on sites suitable for studying special problems such a s propagation through suburbia and the effect of stoplights on the noise emitted by traffic.
References
1. T. D. Northwood, J. D. Quirt, and R. E. Halliwell, "Residential Planning with Respect to Road and Rail Noise," Noise Control Engineering, 13, 2 (1979).
2. R. E. Halliwell and J. D. Quirt, "Traffic Noise Prediction," National Re- search Council of Canada, Division of Building Research, Building Re- search Note 146 (1979).
3. D. N. May, "Freeway Noise and High-Rise Balconies," J. Acoust. Soc.
Am., 65,3,699-704 (1979).
4. R. Bullen, "Sound Scattering in an Urban Street," Noise Control Engi- neering, 9, 2, 54-67 (1977).
5. E. J. Rickley, K. U. Ingard, Y. C. Cho, and R. W. Quinn, "Roadside Barrier Effectiveness: Noise Measurement Program," US Department of Transportation, Report No. DOT-TSC-NHTSA-78-24 (1978).
6. J. S. Bradley, Faculty of Engineering Science, University of Western Ontario, private communication.
This publication is being distributed by the Division of Building R e s e a r c h of the National R e s e a r c h Counrii of Canada. I t should not b e reproduced in whole o r in r a r t without p e r m i ~ e i o n of the original publisher. The Di- vision would b e glad to b e of a s s i s t a n c e i n obtaining s u c h permission.
Publications of the Division m a y be obtained by m a i l - ing the a p p r o p r i a t e r e m i t t a n c e (a Bank, E x p r e s s , o r P o s t Office Money O r d e r , o r a cheque, m a d e payable to the R e c e i v e r G e n e r a l of Canada, c r e d i t NRC) t o the National R e s e a r c h Council of Canada, Ottawa. K I A OR6. Stamps a r e not acceptable.
A l i s t of a l l publications of the Division i s available and m a y be obtained f r o m the Publications Section, Division of Building R e s e a r c h , National R e s e a r c h Council of Canada, Ottawa. KIA OR6.