HAL Id: hal-00317344
https://hal.archives-ouvertes.fr/hal-00317344
Submitted on 2 Apr 2004
HAL is a multi-disciplinary open access
archive for the deposit and dissemination of
sci-entific research documents, whether they are
pub-lished or not. The documents may come from
teaching and research institutions in France or
abroad, or from public or private research centers.
L’archive ouverte pluridisciplinaire HAL, est
destinée au dépôt et à la diffusion de documents
scientifiques de niveau recherche, publiés ou non,
émanant des établissements d’enseignement et de
recherche français ou étrangers, des laboratoires
publics ou privés.
Meridional motions of the afternoon radar aurora,
auroral electrojets, and absorption patches under
variable IMF conditions
R. A. Makarevitch, F. Honary, A. V. Koustov, M. V. Uspensky
To cite this version:
R. A. Makarevitch, F. Honary, A. V. Koustov, M. V. Uspensky. Meridional motions of the afternoon
radar aurora, auroral electrojets, and absorption patches under variable IMF conditions. Annales
Geophysicae, European Geosciences Union, 2004, 22 (5), pp.1649-1664. �hal-00317344�
SRef-ID: 1432-0576/ag/2004-22-1649 © European Geosciences Union 2004
Annales
Geophysicae
Meridional motions of the afternoon radar aurora, auroral
electrojets, and absorption patches under variable IMF conditions
R. A. Makarevitch1, F. Honary1, A. V. Koustov2, and M. V. Uspensky3,4
1Department of Communication Systems, Lancaster University, Lancaster, LA1 4YR, UK
2Institute of Space and Atmospheric Studies, University of Saskatchewan, 116 Science Place, Saskatoon, SK, S7N 5E2,
Canada
3Finnish Meteorological Institute, Geophysical Research Division, P. O. Box 503, Helsinki, FIN-00101, Finland 4on leave from Murmansk State Technical University, Sportivnaya 13, Murmansk, 183010, Russia
Received: 6 October 2003 – Revised: 22 January 2004 – Accepted: 3 February 2004 – Published: 8 April 2004
Abstract. The meridional motions of the CUTLASS HF and
STARE VHF coherent echoes, IMAGE equivalent electro-jet currents, and IRIS absorption patches during the post-noon/early-evening event of 14 February 2000 are presented. The motions were found to be synchronous, to a first ap-proximation, for all instruments. The temporal correlation between motions in the radar and magnetometer data was exceptionally good, although spatially the areas with the E-region backscatter and most intense equivalent currents were not coincident, with the HF (VHF) echoes being shifted 100– 200 km (20–50 km) equatorward (poleward). The meridional motions of the radar echoes and electrojet currents appeared to be controlled by the IMF Bzchanges; the meridional
prop-agation direction was equatorward (poleward) during the in-tervals when the IMF was southward (northward), with one exception when the poleward progression continued after the IMF southward turning. We relate the observed meridional motion patterns to the polar cap expansion/contraction dur-ing variable IMF conditions and discuss the relative impor-tance of two types of processes: the dayside reconnection and IMF-triggered substorms. We also investigate the irregularity Doppler velocity for the STARE (144 MHz) and CUTLASS (12 MHz) observations at large flow angles in the context of the eastward and westward electrojet systems. We show that the 144-MHz Doppler velocity is determined by a combi-nation of two factors: the sense of electrojet currents and the aspect angle conditions within the STARE field of view. Finally, the behavior of small dayside enhancements of the IRIS absorption (up to 0.5 dB at 38.2 MHz) accompanying the radar echoes and electrojet currents is examined. Since the velocity of the meridional displacements was close to that of the poleward/equatorward progressing intense currents, it is suggested that the absorption patches observed during the event were related to the heating of the E-region plasma by the unstable plasma waves in the regions of enhanced electric fields.
Correspondence to: R. A. Makarevitch
(r.makarevitch@lancaster.ac.uk)
Key words. Ionosphere (auroral ionosphere; electric fields
and currents; plasma convection)
1 Introduction
The high-latitude ionosphere is a highly dynamic medium with complex, interrelated processes occurring simultane-ously. The coherent radars in the UHF, VHF, and HF bands have proved to be useful instruments for studying these pro-cesses (see, for example, the review papers by Nielsen, 1982; Greenwald et al., 1995, and references therein). Such radars routinely detect echoes from the magnetic-field-aligned ir-regularities in the ionosphere. The advantage of coherent radars is in their relatively good spatial and temporal reso-lutions (typically of the order of 30 km and 1 min, respec-tively) and significant coverage (as much as 106km2). The phenomenon of coherent echo detection from the auroral E-region is often referred to as the radar aurora.
Information on the amplitude and Doppler velocity is fun-damentally important for understanding the plasma physics of the irregularity formation (Fejer and Kelley, 1980; Sahr and Fejer, 1996). The Doppler velocity measurements are also extensively used for monitoring plasma motions at vari-ous heights (Greenwald et al., 1978, 1995). It has been shown that the UHF and VHF E-region echoes collocate with the areas of intense electrojet currents (Greenwald et al., 1975; Tsunoda et al., 1976). Moreover, the echo strength was found to be a measure of the electrojet intensity (Greenwald et al., 1973; Uspensky et al., 1983; Starkov et al., 1983). Coherent radars hence can be used for tracing the auroral electrojets. It has also been established that the E-region echoes often occur in the areas adjacent to the visual auroral arcs (Green-wald et al., 1973; Tsunoda et al., 1976), so that they can pro-vide valuable information for the auroral arc physics as well (Timofeev et al., 1987).
More recently, with the construction of a number of the Super Dual Auroral Radar Network (SuperDARN) HF radars, studies of the high-latitude ionosphere and
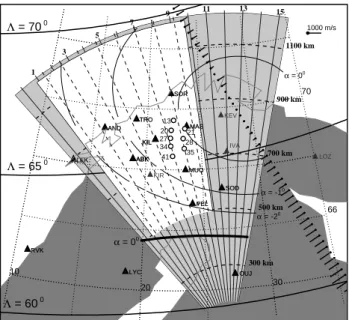
1650 R. A. Makarevitch et al.: Meridional motions of the afternoon radar aurora 1 3 5 7 9 11 13 15 300 km 500 km 700 km 900 km 1100 km Λ = 60 0 Λ = 65 0 Λ = 70 0 α = -20 α = -10 α = 00 SOR KEV TRO MAS AND KIL IVA ABK LEK MUO LOZ KIR SOD PEL OUJ LYC RVK SOR TRO MAS AND KIL ABK LEK MUO SOD PEL OUJ LYC RVK 13 20 27 34 41 21 28 35 KIL ABK 1000 m/s 10 20 30 66 70 α = 00
Fig. 1. The experimental setup in Northern Scandinavia
show-ing the near (r<1200 km) fields of view of the CUTLASS (grey) and STARE (white) Finland radars. The nominal directions of the CUTLASS (STARE) beams 0–15 (1–8) are indicated by the solid (dashed) straight lines. Also shown are slant range marks (dashed circular curves) and PACE lines of equal magnetic latitudes
3=60◦,65◦, and 70◦(solid black curves). The black thin curves
α=−2◦, −1◦, 0◦represent the geometrical off-perpendicular (as-pect) angle lines at 110 km. The heavy black curve α=0◦ is the perfect aspect angle line at 110 km, assuming a model electron den-sity profile and a radar frequency of 12 MHz. The location (with the three-letter abbreviation) of the stations of the IMAGE and SAM-NET magnetometer networks close to the radars’ FoV is shown by triangles. The open circles (with digits nearby showing the beam number) represent the easternmost IRIS beams (at 100 km) close to the meridional direction of interest. The DMSP pass (F13: 14:18– 14:21 UT) with the measured perpendicular ion velocities is indi-cated by black vectors. The scale for the ion velocities is shown in the top right corner of the diagram.
magnetosphere with HF coherent radars have become popu-lar. The advantage of HF coherent radars is in their ability to detect echoes not only from the E-region but also from the F-region (at UHF and VHF, detection of the E-F-region echoes is only possible), so that additional information on the plasma there can be obtained (Milan and Lester, 1998; Koustov et al., 2002). The comparisons between the echo characteris-tics at HF and VHF have also been used recently for studies of the plasma physics of irregularity formation (Koustov et al., 2002; Makarevitch et al., 2002).
In this paper we advance our knowledge on radar au-rora dynamics with the disturbance development at high lat-itudes by exploring the joint HF and VHF radar data in the Scandinavian sector, where data from several facilities are available, including the Co-operative UK Twin Located Au-roral Sounding System (CUTLASS) HF radar (∼12 MHz) and Scandinavian Twin Auroral Radar Experiment (STARE) VHF radar (∼144 MHz). Following classical UHF and VHF
studies (e.g. Greenwald et al., 1973; Tsunoda et al., 1976) we consider the radar echoes in the context of other phenom-ena, such as magnetic disturbances, riometer absorption, etc. Our target is the radar frequency effects (HF versus VHF), so that HF radar capabilities can be better understood. We concentrate on the afternoon/early-evening sector of obser-vations for which the relationship of HF radar echoes with various phenomena is not well established. More specifi-cally, the purpose of the present report is, first of all, to inves-tigate the meridional displacements of HF and VHF echoes and the potential reasons for these motions. Secondly, we explore the details of the spatial distributions of the VHF and HF Doppler velocity and compare them with the electrojet structure as observed by magnetometers. In this way, we at-tempt to complement previous radar studies which concen-trated on the echo intensity. Finally, we compare the motions of the radar echoes and equivalent currents with those of the riometer absorption patches, in attempt to reveal the factor(s) responsible for the riometer absorption during the event.
2 Experiment setup
In this study, we used the data collected by the CUTLASS Finland radar located at Hankasalmi, Finland (62.3◦N, 26.6◦E, geographic), oriented towards magnetic north. The radar is analogous technically and operationally to all other SuperDARN radars described in some detail by Greenwald et al. (1995) (see also Milan et al., 1997). The Hankasalmi antenna array consists of 16 log-periodic antennas (with both transmitting and receiving capabilities) that are phased rela-tive to one another to form the field of view (FoV) centered at the boresite direction of −12◦E (east of geographic north, or
+12◦W). The radar sweeps through 16 beam positions
(sep-arated by 3.24◦) in 2 min, with the 7-s dwell time in each position. The measurements of the Doppler velocity, power, and spectral width are made by using a 7-pulse transmission sequence that allows for the 18-lag auto-correlation function (ACF) determination. The data are available in 45-km steps for ranges 180–3500 km.
Figure 1 shows the near FoV (slant range r<1200 km) of the CUTLASS Finland radar by a grey sector. The dashed circular curves represent the slant range marks. Also shown in Fig. 1 by heavy solid black curves are the Polar Anglo-American Conjugate Experiment (PACE) lines of equal mag-netic latitudes 3=60◦, 65◦, and 70◦(Baker and Wing, 1989).
In this study we also used the data collected by the STARE VHF radar. In the standard STARE mode (we use only such data), the double-pulse phase delay measurements are used to determine the Doppler velocity of the E-region echoes (∼110 km) and the single-pulse data are used to determine the power of echoes (Greenwald et al., 1978; Nielsen, 1982). The echoes are monitored in 8 beams separated by 3.6◦in az-imuth, so that the STARE radar FoV is somewhat narrower than the CUTLASS FoV (28.8◦versus ∼52◦). The STARE radar antenna boresite direction is −19.1◦E. The data are in-tegrated over 20 s. In terms of range, the measurements are
performed from 495 to 1245 km with a 15-km resolution. We showed the STARE Finland radar FoV in Fig. 1 by the white sector; the central positions of the STARE beams are indi-cated by the dashed straight lines.
The aspect angle conditions for coherent radar observa-tions in the Scandinavian sector are quite favorable. To illus-trate this, we show in Fig. 1 by thin black curves the lines of geometrical or rectilinear aspect angle α= − 2◦, −1◦, and 0◦ at 110 km. In a large area, very little bending of the radar beam is required to reach orthogonality with the mag-netic field at the E-region heights. Since the frequency of the STARE radar is 144 MHz, one need not consider refrac-tion of the radio waves for typical E-region densities and one can expect that the STARE echoes would occur in the broad area of the ionosphere, with the strongest echoes near the ranges of minimum achievable aspect angle. For the high-number beams, the aspect angle conditions are quite interest-ing; the perfect aspect angle line α=0◦ (thin) intersects the
beams twice (e.g. for beam 8, at 700 and 1000 km), so that one would expect strong VHF echoes to occur at two sets of ranges.
For the CUTLASS radar (12 MHz), refraction can be sig-nificant; to illustrate its effect we show by heavy black line in Fig. 1 the expected zero aspect angle line computed in a simple geometrical optics approach of Uspensky et al. (1994) for a typical (for the location and time of observations) elec-tron density profile from the model (Bilitza, 2001). The electron density profile used has a broad maximum at the electrojet heights around 110 km, with the maximum den-sity ∼7·104cm−3. One would expect the HF echoes to oc-cur preferentially at ranges close to the heavy black line, at
∼400 km, which is ∼300 km equatorward of the expected ranges of the STARE echoes.
Figure 1 also shows by triangles the locations of the In-ternational Monitor for Auroral Geomagnetic Effects (IM-AGE) fluxgate magnetometers in the vicinity of the radars’ FoV (e.g. Luhr et al., 1998) and by open circles the central positions (at 100 km) of several beams of the Imaging Ri-ometer for Ionospheric Studies (IRIS) at Kilpisjarvi, Finland (69.1◦N, 20.8◦E). The IRIS riometer (Browne et al., 1995; del Pozo et al., 2002) records the non-deviative cosmic noise absorption (CNA) at 38.2 MHz at 49 different directions with 1-s resolution, although some post-integration is usually em-ployed. We show only those IRIS beams (digits nearby indi-cate the IRIS beam number) that were the closest to the area of interest 23◦E, geographic (see Sect. 3.2) and that were
not affected by the solar radiation/ionospheric scintillations during the event.
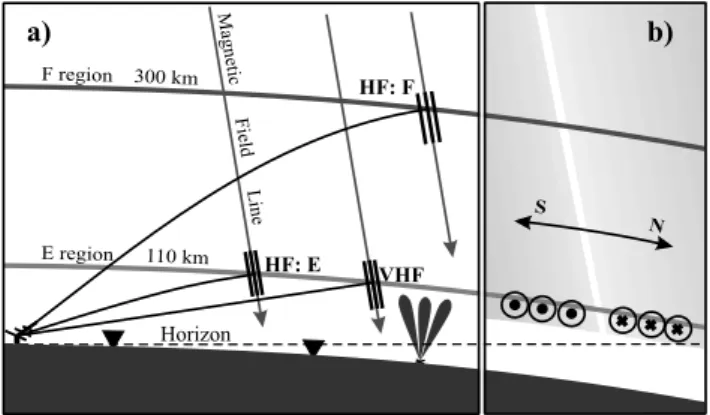
To provide an overall perspective on various measure-ments, we present in Fig. 2a the geometry of the observa-tions in the vertical plane along the meridian. The STARE VHF radar beam (straight line) reaches orthogonality with the magnetic field (indicated by the slightly inclined long ar-rows) at an E-region height of ∼110 km. The CUTLASS HF radar is able to reach the orthogonality condition at both E- and F-region heights (∼110 and ∼300 km, respectively). The radio waves can be scattered back from the
magnetic-S N F region 300 km E region 110 km VHF HF: E HF: F Horizon M agn etic F ie ld L ine a) b)
Fig. 2. The schematic diagram showing (a) the geometry of
ob-servations along a meridian (north is to the right) in the vertical plane and (b) electrojet current system near the boundary dividing the eastward (circles with dots) and westward (circles with crosses) currents.
field-aligned irregularities shown by short heavy lines. Ex-amples of two IMAGE magnetometers and three beams of the IRIS riometer measuring the magnetic field perturbations and CNA, respectively, are shown in Fig. 2a by triangles and oblong figures. We return to this diagram, panel (b), in Sect. 4 where we interpret the observations.
3 Observations
On 14 February 2000, 11–18 UT (∼13–20 MLT), the CUT-LASS HF radar observed bands of both E- and F-region backscatter that were moving along the meridian, which have resulted in the appearance of the quite remarkable “V-” and even “W-like signatures” in the range-time-intensity (RTI) plots. The STARE VHF radar observed similar signatures in the E-region backscatter.
The period under consideration was characterized by the moderate level of magnetic activity; the global Kp index
was between 4+ and 5+. According to the Advanced Com-position Explorer (ACE) satellite, the solar wind velocity (along the x-axis) and proton number density were around 640 km/s and 8 cm−3, respectively, for almost the entire pe-riod. The propagation time from the satellite upstream point (1.54·106km from the Earth) can be estimated using these values. The 3-step technique of Khan and Cowley (1999) applied to our event gives a result of ∼45 min and from here-after we adopt this value as the time required for changes in the IMF conditions to reach the Earth’s ionosphere.
3.1 Echo band motions at HF and VHF
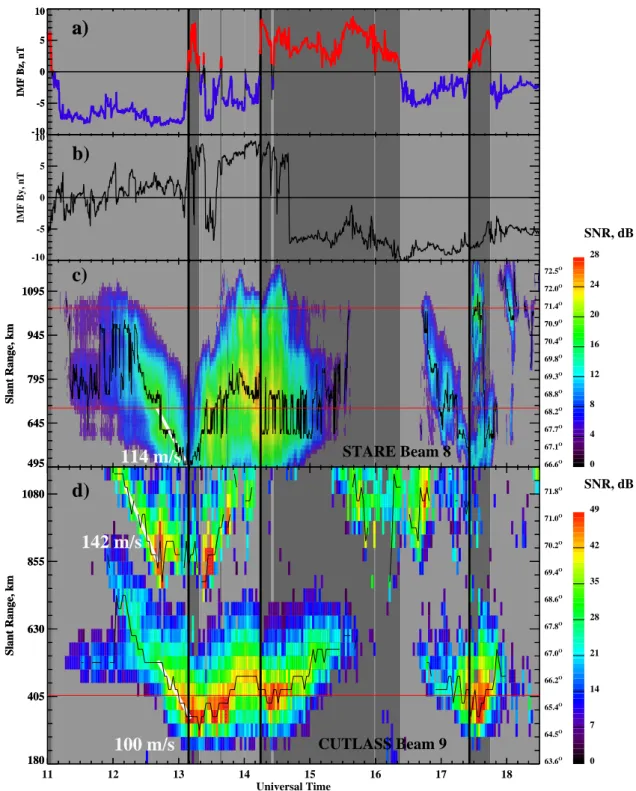
Figures 3a and b show the time-lagged by 45 min IMF Bz, By
components, respectively, measured by the ACE magnetic field instrument (Smith et al., 1998) with 16-s resolution. The positive (negative) IMF Bzdata are shown by red (blue)
color. The time intervals corresponding to the positive (neg-ative) IMF Bz are marked by dark (light) grey background
1652 R. A. Makarevitch et al.: Meridional motions of the afternoon radar aurora represent the sudden northward IMF turnings (SNITs). Two
bottom panels are the RTI plots of the signal-to-noise ratio (SNR) for the (c) STARE beam 8 and (d) CUTLASS beam 9. During data post-processing the ground scatter echoes in the CUTLASS data were removed from the records. The echoes that had low SNR (<3 dB) and unusually large spectral width (>500 m/s) were also not considered.
The IMF Bz was negative and more or less stable
(∼−7 nT) for over 2 h from 11:05 to 13:10 UT in the begin-ning of the interval under study; the By component varied
in random fashion around zero. At 11:20 UT the STARE radar started to detect the echoes at 800 and 1000 km. Af-ter ∼1200 UT the echoes started to show a regular equator-ward displacement. To facilitate the monitoring of the effect we computed the range of the echo maximum at each instant and connected the obtained points by solid black line; see the ragged black lines in panel (c). The equatorward motion was especially clear after 12:20 UT when both VHF and HF echoes intensified. To estimate the velocity of equatorward progression we fitted the straight line to the maximum power range location curve. This fitted line is indicated in Fig. 3b by a white line with the digits representing the echo band displacement speed along the radar beam.
Similar meridional motions were observed by the CUT-LASS radar; see panel (d) for beam 9, Fig. 3. The HF echoes first appeared at 11:15 UT at 500 km. The equatorward pro-gression speed was slightly lower, 100 m/s, as compared to a speed of 114 m/s for STARE. Interestingly, equatorward mo-tion of HF echoes was also observed at ranges 900–1200 km. These echoes are usually associated with the scatter from the F-region (Milan et al., 1997; Danskin et al., 2002; Koustov et al., 2002). The F-region HF echo band displacement speed was larger, around 142 m/s.
At 13:10 UT the IMF abruptly changed its direction from southward to northward, which is shown by the first black vertical line in Fig. 3. Almost immediately after this IMF turning, the STARE echoes started to move away from the radar, Fig. 3c. The IMF returned back to the southward ori-entation in about 10 min but the poleward echo band progres-sion continued up until 14:00 UT, when it stopped and be-came equatorward again. The second equatorward progres-sion continued until ∼14:15 UT when the second SNIT oc-curred. At HF, the situation was very reminiscent of the one at VHF, except the HF echoes started to move poleward after the first IMF northward turning not at 13:10 UT but some-what later. From 13:20 to 14:00 UT, the F-region echoes be-came strong and abundant enough to be traced as poleward progressing.
After the second SNIT at 14:15 UT, the strongest STARE echoes were observed at 630 km; the poleward motion of the echo band was less obvious here compared to the case of the IMF reversal at 13:10 UT; the range of maximum power was jumping between 630 and 735 km but one can notice that the
∼8- and 16-dB contours of SNR at the equatorial edge were moving poleward. At HF, the poleward progression after the second SNIT started ∼10 min later and it was very clear. We note that at 14:40 UT the Bycomponent sharply changed its
sign with no apparent effect in the echo band motions either at VHF or at HF.
At 16:23 UT Bz, again, became negative and soon after
that both VHF and HF radars started to detect echoes. For both radars, the echoes were moving to the radar until the time of the third IMF reversal, 17:25 UT. Similar to the two previous cases, the change in the direction of the HF echo band meridional displacement was slightly delayed with re-spect to the time of the IMF reversal. The poleward progres-sion apparently stopped soon after the Bz became negative
at 17:45 UT, again, with larger delay at HF. We would like to point out here for future reference that a second distinct band of VHF echoes appeared at 17:25 UT at farther ranges of ∼1000 km.
The RTI plots for the STARE beam 8 and CUTLASS beam 9 (roughly along the magnetic meridian) presented in Fig. 3 indicate that the echo bands were moving in range as a whole as well. Also, we note that the exact range position of the power maxima was not exactly coincident with the expected ranges of perfect aspect angle either at VHF or at HF. 3.2 Electrojet meridional motions according to the IMAGE
magnetometers
To judge the dislocation of electrojet currents during the event we employed the method of spherical elementary cur-rent systems (Amm and Viljanen, 1999; Pulkkinen et al., 2003). The method requires a continuous data record-ing throughout the event for the magnetometers considered (mostly for convenience of programming and computation time minimization), therefore, the data from KEV and KIR stations were excluded from the analysis. The complete list of considered stations is UPS, NUR, DOB, HAN, OUJ, LYC, RVK, PEL, SOD, MUO, LEK, ABK, KIL, AND, MAS, TRO, SOR, BJN, HOP, HOR, LYR, and NAL. All magne-tometer data were post-integrated with a period of 1 min.
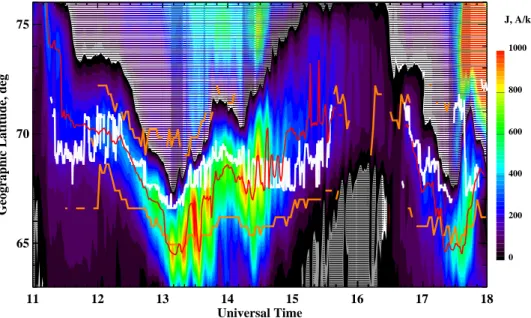
The results of calculations are illustrated in Fig. 4 which shows the equivalent current density J at 24.8◦east of geo-graphic north at 100 km altitude as a function of geogeo-graphic latitude and universal time. The contours filled with solid color (horizontal lines) correspond to the eastward (west-ward) electrojet. We reproduce in Fig. 4 the grey scale shad-ing scheme of the background from Fig. 3. To facilitate com-parison with the radar data we also show in Fig. 4 the location of the center of eastjet current system (latitude of maximum current, J >200 A/km) by the red line. The location of the maximum backscatter power for the STARE beam 8 (CUT-LASS beam 9) from Fig. 3 is shown by the white (orange) line(s). For CUTLASS data, these locations are shown for the F- and E-region echo bands separately.
From 11:05 to 13:10 UT the eastward current center moved towards the equator. At ∼13:10 UT the first SNIT occurred and the motion became poleward. The motions tween the eastward electrojet center and the boundary be-tween eastward and westward electrojets are well synchro-nized (red line follows closely the J =0 contour but shifted equatorward by 2◦–3◦), indicating that the electrojet was
-10 -5 0 5 10 IMF Bz, nT
a)
180 405 630 855 1080 Slant Range, kmd)
100 m/s
142 m/s
180 405 630 855 1080 Slant Range, km 11 12 13 14 15 16 17 18 Universal TimeCUTLASS Beam 9
0 7 14 21 28 35 42 49 SNR, dB 63.6O 64.5O 65.4O 66.2O 67.0O 67.8O 68.6O 69.4O 70.2O 71.0O 71.8O 495 645 795 945 1095 Slant Range, kmc)
114 m/s
495 645 795 945 1095 Slant Range, kmSTARE Beam 8
0 4 8 12 16 20 24 28 SNR, dB 66.6O 67.1O 67.7O 68.2O 68.8O 69.3O 69.8O 70.4O 70.9O 71.4O 72.0O 72.5O -10 -5 0 5 10 IMF Bz, nTa)
-10 -5 0 5 10 IMF By, nTb)
Fig. 3. The panel (a) (and b) presents the ACE IMF Bz(By) data on 14 February 2000, 11:00–18:30 UT, shifted by 45 min. The positive
(negative) Bzdata are shown by the red (blue) color and the corresponding time intervals are marked by the dark (light) grey shade of the
background. Heavy vertical lines show the IMF Bzreversals from southward to northward. The range-time-intensity (RTI) plots of the SNR
measured at STARE beam 8 and CUTLASS beam 9 (see Fig. 1) are presented in panels (c) and (d), respectively. The color bars are shown to the right of each RTI plot. Also shown on the right axes of panels (c) and (d) are the geographic latitudes along each radar beam. The red lines in panels (c) and (d) indicate the ranges with the perfect aspect angle at 144 and 12 MHz, respectively. The thin ragged lines represent time variation of the range location of the power maximum for each radar. The 12-MHz power maxima have been identified separately for the closer (r<800 km) and farther (r>800 km) ranges of the CUTLASS radar measurements. Examples of the linear best fit to the power maxima range variation curves (for the intervals of steady equatorward progress) are shown by the white lines with the apparent echo band velocity along the radar beam indicated by the digits.
1654 R. A. Makarevitch et al.: Meridional motions of the afternoon radar aurora
65 70 75
Geographic Latitude, deg
11 12 13 14 15 16 17 18 Universal Time 0 200 400 600 800 1000 J, A/km
Fig. 4. The contour plot of the equivalent current density J (east-west component) at 24.8◦E (geographic) as a function of UT and geographic latitude. The scale for the current density in A/km is shown on the right. The contours filled with the solid color (horizontal lines) correspond to the eastward (westward) electrojet. The intervals of northward (southward) IMF are marked by the dark grey (white) background. The location of the center of eastjet (maximum of J along the meridian) is shown by the red line. Also shown are the latitudinal positions of the power maximum along the STARE beam 8 (white line) and CUTLASS beam 9 (orange lines) from Fig. 3.
11 12 13 14 15 16 17 18 Universal Time 68.0 68.5 69.0 69.5 70.0
Geographic Latitude, deg
0.0 0.1 0.2 0.3 0.4 0.5 Abs, dB Universal Time IRIS Keogram
Fig. 5. The IRIS keogram at 23.0◦E (geographic). The black line is a contour J =0 from Fig. 4 representing the boundary between eastward and westward electrojets. On the top we reproduce the grey-scale shading from Fig. 3; the dark (light) grey shade corresponds to the time interval when time-lagged by 45 min ACE IMF Bzcomponent was positive (negative).
moving as a whole and was to a certain degree homogeneous. At ∼14:00 UT the eastjet center again changed its meridional motion direction to the equator. Note that no changes in the IMF conditions were observed at this moment. The equator-ward progression was, however, not long this time; it ended at ∼14:20 UT. After that, the poleward progression of the electrojet system was observed, up until ∼16:10 UT. The last change in the direction of the meridional motion from equa-torward to poleward during the considered period occurred at 17:30 UT.
The meridional displacement of the strongest VHF backscatter (white line) was in good agreement with the most intense equivalent current location (red line). For the 12:30– 14:30 UT interval, when both were the closest to the radar, the white line is 20–50 km poleward. At 17:30 UT the white
line suddenly jumps up by more than 3◦of latitude and stays at 70◦for about 10 min. This jump is clearly associated with the appearance of the second band of VHF echoes at this time (Fig. 3).
The location of the strongest backscatter at HF (orange lines) significantly differed from the position of either the strongest VHF echoes or the most intense equivalent current. The lower orange curve corresponding to the E-region echoes is systematically equatorward of the STARE echoes and most of the time equatorward of the current center. The meridional motions of the E-region echoes at HF were nevertheless well correlated with those of VHF scatter and eastward electro-jet. The correlation with the latter was truly remarkable from 12:40 to 14:20 UT. The situation was somewhat different for the F-region echoes (upper orange curve) which appeared at
the latitudes of the eastward electrojet (e.g. 12:00–12:40 UT), as well as of the westward electrojet (13:30–13:40 UT). In both cases, the CUTLASS F-region echoes were located sig-nificantly poleward from the latitudes of the eastjet center and the STARE echoes. The meridional motions of the F-region echoes, however, overall, corresponded rather well to those in the STARE and IMAGE data.
3.3 Meridional motions of absorption patches according to IRIS
The FoV of the imaging riometer installed at Kilpisjarvi overlaps with both STARE and CUTLASS viewing areas and is close to several IMAGE magnetometer stations (Fig. 1), which provides an excellent opportunity for studying the mo-tions in the riometer data for the auroral zone in conjunction with radars and magnetometers. The event under study, how-ever, was characterized by a considerable level of solar radio noise/ionospheric scintillations. Fortunately, the IRIS beams closest to the meridional direction of interest (indicated in Fig. 1 by the open circles with numbers) were not signifi-cantly affected.
Figure 5 is the absorption keogram at 23.0◦in 20-s reso-lution. The keogram longitude was chosen as a compromise between the proximity to the meridional direction of interest (see Fig. 1) and a requirement to stay within the IRIS FoV. An additional reason is that this longitude is far enough from the beams that were disturbed by the solar radiation. The IMF Bzgrey-scale shading from Fig. 3 is reproduced on the
top of the diagram. The black contour corresponds to the boundary between westward and eastward electrojets J =0 from Fig. 4.
During the first (roughly) half of the period under study, the displacement of the absorption contours seemed to be consistent with the latitudinal variations of the eastjet pole-ward border (black line). The reversal of the meridional motion direction in absorption data from equatorward to poleward somewhat preceded the electrojet boundary mo-tion reversal and the first SNIT at ∼13:10 UT (see the grey-scale bar above the main diagram). After ∼14:30 UT, the absorption dropped below the 0.2-dB level and in general did not exhibit any consistent pattern in latitudinal shift. The relatively strong absorption enhancement appeared at
∼17:30 UT, soon after the last SNIT. From 17:37 to 17:52 UT the contours were moving northward and then from 17:52 to 17:56 UT equatorward, consistent with the motions of the eastjet-westjet boundary.
3.4 Coherent echoes: velocity of the meridional motions and Doppler velocity
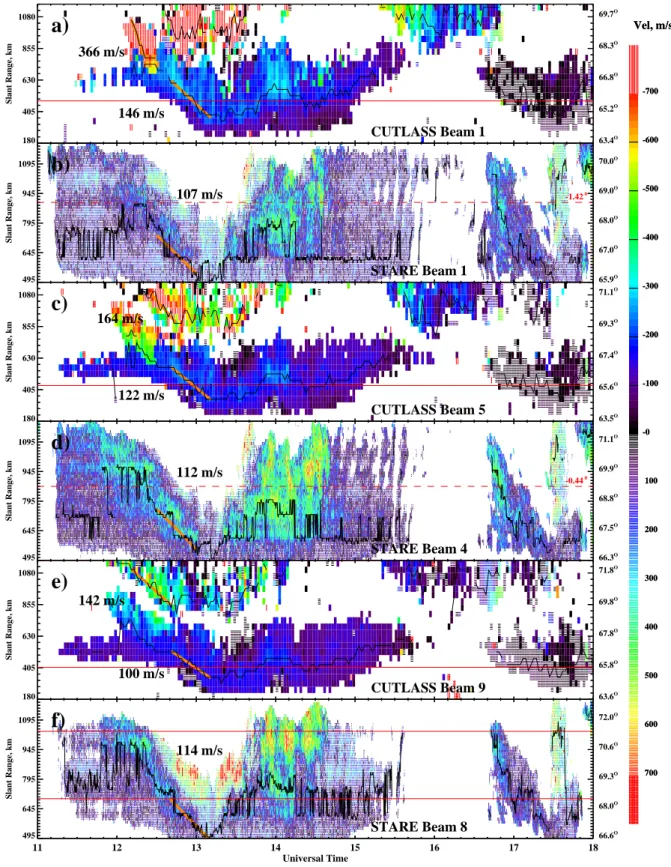
Another objective of this study is to examine the spatial dis-tribution of the observed Doppler velocities at two radar fre-quencies and to find out if the velocities are consistent with the magnetometer data. We also look at the velocity of the echo band meridional displacement for different observa-tional directions in both the E- and F-regions. In Fig. 6 we
present the Doppler velocity RTI plots for various observa-tional directions. Similar to Fig. 3, the ragged black line is the range location of the power maximum along each radar beam, the heavy orange line is the best linear fit to this line for the intervals of steady progression, and digits nearby in-dicate the velocity of echo band displacement along the radar beam. With respect to the latter, one should note that in this section, in addition to the echo band displacement velocity towards/away from the radar, we consider the irregularity Doppler velocity measured by the radar directly. To avoid any confusion we will refer to the former as “the echo band (displacement) velocity” (Vband) and to the latter as “the
(ir-regularity) Doppler velocity”. Note that both velocities are assumed to be positive (negative) for motions toward (away from) the radar.
For the STARE radar the aspect angle conditions are pro-gressively more favorable with the STARE beam number in-crease; for beam 1, panel (b), the minimum achievable rec-tilinear aspect angle is −1.42◦(we indicated the range cor-responding to this angle by the dashed red line), for beam 4, panel (d), it is −0.44◦, and for beam 8 it is zero. For the CUTLASS radar, the orthogonality condition is met closer to the radar because of refraction, typically at 400–450 km, and we show these ranges determined from the model by the solid red lines in panels (a), (c), and (e).
The diagrams in Fig. 6 have an appearance similar to the one in Fig. 3, with “W-like” signatures for observations at 12:00–15:30 UT and “V-like” signatures at 17:00–18:00 UT. At HF and ranges of the F-region echoes (∼1000 km) the “V-signature” without the bottom part is well seen in CUTLASS beams 5 and 9, panels (c) and (e).
At VHF, the echo band velocity seems to be nearly con-stant for all directions, with perhaps a small increase with beam number (Vband=107, 112, and 114 m/s at STARE
beams 1, 4, and 8, respectively). Interestingly, the situation is the opposite for the E-region HF echoes, where the echo band velocity at closer ranges seems to be decreasing with beam number (Vband=146, 122, and 100 m/s at CUTLASS
beams 1, 5, and 9, respectively). The decrease is also seen for the F-region HF echoes, Vband=366, 164, and 142 m/s,
although the first number is probably an overestimation. Turning to the Doppler velocity data, one can see that for the first time interval (11:00–15:00 UT), the F-region irreg-ularity velocity at farther ranges (>800 km) decreases with beam number increase or, in other words, with the devia-tion from the expected E×B drift direcdevia-tion. The E-region HF Doppler velocity is, on the other hand, fairly constant; it decreases with beam number but very slowly, remaining neg-ative for the entire interval and for almost all slant ranges. In sharp contrast with that, the VHF velocities could be either negative or positive, depending on whether the echoes are close to the range location of the power maximum. Thus, VHF echoes that are close to the power maxima location (denoted by the thin ragged line) predominately have nega-tive velocities (the cells filled with the solid color), consistent with the expected electrojet eastward orientation for this time sector. However, there is a large set of VHF echoes with the
1656 R. A. Makarevitch et al.: Meridional motions of the afternoon radar aurora 146 m/s 366 m/s 180 405 630 855 1080 Slant Range, km CUTLASS Beam 1
a)
63.4O 65.2O 66.8O 68.3O 69.7O 107 m/s 495 645 795 945 1095 Slant Range, km STARE Beam 1b)
-0 -100 100 -200 200 -300 300 -400 400 -500 500 -600 600 -700 700 Vel, m/s -1.42 0 65.9O 67.0O 68.0O 69.0O 70.0O 122 m/s 164 m/s 180 405 630 855 1080 Slant Range, km CUTLASS Beam 5c)
63.5O 65.6O 67.4O 69.3O 71.1O 112 m/s 495 645 795 945 1095 Slant Range, km STARE Beam 4d)
-0.44 0 66.3O 67.5O 68.8O 69.9O 71.1O 100 m/s 142 m/s 180 405 630 855 1080 Slant Range, km CUTLASS Beam 9e)
63.6O 65.8O 67.8O 69.8O 71.8O 114 m/s 495 645 795 945 1095 Slant Range, km 11 12 13 14 15 16 17 18 Universal Time STARE Beam 8f)
-0 -100 100 -200 200 -300 300 -400 400 -500 500 -600 600 -700 700 Vel, m/s 66.6O 68.0O 69.3O 70.6O 72.0OFig. 6. The RTI plots of the Doppler velocity for various CUTLASS and STARE beams. The color scheme is indicated on the right. Cells
filled with solid color (horizontal lines) correspond to the negative (positive) velocities. As in Fig. 3, the thin ragged lines show the range locations of power maxima along each radar beam, and the best linear fit to the latter is denoted by the orange straight lines. The geographic latitude along each radar beam is shown on the right axes. The red solid (dashed) horizontal lines correspond to the range location with the perfect (minimum achievable) aspect angles. The minimum achievable aspect angles for STARE beams 1 and 4 are indicated above the red dashed lines.
opposite sign of Doppler velocity, so that at STARE beams 1 and 8 the “islands” of the solid color are surrounded by the much larger “seas” of the echoes with positive Doppler ve-locities. At easternmost STARE beam 8, the positive Doppler velocities as high as 700 m/s (the hatched red cells at 12:40– 13:40 UT, at slant ranges of more than 800 km) are observed. Notice that the echoes in the second band of VHF echoes at
∼1000 km, at 17:30 UT, the presence of which we noted ear-lier (Fig. 3), also have positive Doppler velocities and they are quite high (∼500 m/s).
Positive Doppler velocities in general and large positive velocities of 700 m/s in particular are impossible to explain in terms of the usual sense of an irregularity velocity sign that is appropriate for the observations in the eastward electrojet. We have to remember, however, that the second band of VHF echoes from the data presented in Fig. 4 was clearly associ-ated with the westward electrojet, for which the Doppler ve-locity is expected to be positive for our observational direc-tions. One can think then that all other echoes with positive velocities (including the ones at ∼800 km) originated from the westward electrojet as well.
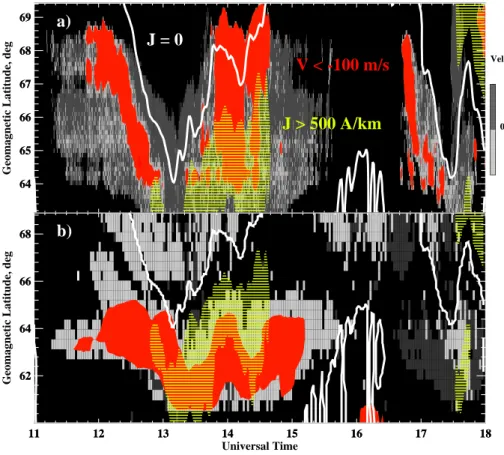
The equivalent electrojet current data presented in Fig. 4 is a useful framework that can be used to resolve this is-sue. In Fig. 7a we compare the STARE velocities at beam 8 from Fig. 6f and the IMAGE equivalent currents from Fig. 4. Since the IMAGE and STARE data refer to slightly different locations, we compare them in terms of the PACE geomag-netic latitude. The positive (negative) Doppler velocities are shown by the dark (light) grey cells. The boundary between the currents of the opposite polarity J =0 is shown by the white contour. The red (yellow) area represents the range cells with the largest negative Doppler velocities (current in-tensities), with the farthest radar range limited by 720 km. One can see in Fig. 7a a good general agreement between electrojet currents and VHF Doppler velocities. The white contour is close to the boundary between positive and nega-tive velocities. The hypothesis that the large posinega-tive veloci-ties of more than 700 m/s from 12:50 to 13:30 UT at farther ranges occur within the westward electrojet also seems to find its confirmation; the dark grey cells are generally above the white contour. This is also the case for the second band of VHF echoes at 17:40 UT.
There are, however, several unexpected features in Fig. 7a. First, the cells with the positive Doppler velocities (dark grey) equatorward of the islands of negative velocities (lat-itudes of 65◦–66◦) are all well within the eastward
electro-jet. At 13:10 UT, although the latter moves very close to the equatorward edge of the STARE observations (3∼=63◦N),
the first ∼100 km in range of the STARE observations are still within the eastward electrojet, while the radar records the positive Doppler velocities for all slant ranges with echoes present. Even when the radar detects the echoes with nega-tive velocities (e.g. at ∼12:50 and 13:30 UT), the white con-tour dividing the equivalent currents of opposite directions is somewhat poleward of the line that divides the echoes with positive and negative Doppler velocities. For an inter-val when both Doppler velocities and currents intensities are
large (13:00–14:30 UT), the areas with the largest STARE Doppler velocities (red) are located somewhat poleward of the areas with the most intense eastward currents (yellow).
The CUTLASS E-region velocities, on the other hand, are predominantly consistent with the eastward electrojet, Fig. 7b. Contrary to VHF measurements, the area with the largest HF velocity (red) is equatorward of the most intense currents (yellow). The shift in the most negative velocities with respect to the most intense eastward currents (equator-ward at HF and pole(equator-ward at VHF) is in agreement with a similar feature in the SNR data presented in Fig. 4.
Another way to look at the problem is to compare explic-itly the locations of the STARE and CUTLASS Doppler ve-locity of the same sign and in Fig. 8 we show the plot for the CUTLASS Doppler velocity (Fig. 6e) with the overlaid STARE velocity plot. The grey-scale (color) scheme for the HF (VHF) Doppler velocity is shown on the right. Figure 8 shows clearly that the gap between the E- and F-region CUT-LASS echoes was to a great extent covered by the STARE echoes and that there was a good correlation between the E-region echo occurrences at both frequencies. The agreement between velocity signs, on the other hand, is rather poor; the CUTLASS velocities were predominantly negative, whereas the STARE velocities (observed at the same range gates, say, at 500–700 km) were either negative or positive. Once again, we notice that the positive (red) VHF velocities equatorward of the areas with negative VHF velocities (yellow) were all located within the CUTLASS echo band (negative veloci-ties). The meridional motions of the areas with negative ve-locities at HF and VHF, however, were quite similar.
4 Discussion
In this study, we considered meridional motions of echo bands observed by the STARE VHF and CUTLASS HF coherent radars, electrojet currents inferred from the IM-AGE magnetometer data, and IRIS absorption, during a 7-h event in the afternoon/early-evening sector, with three abrupt northward turnings of the IMF each preceded by at least a 60-min interval of southward IMF registered by the ACE magnetic field instrument upstream of the magnetopause at
∼13:10, 14:15, and 17:25 UT (the IMF data were shifted by 45 min to account for the propagation time from the upstream point to the ionosphere). The time variation of the AL in-dex indicated two periods of enhanced substorm-like activ-ity, 11:00–16:00 UT and 16:00–18:00 UT, with the minima in AL index at ∼13:00 and ∼17:00 UT, although the qual-ity of the AL index data was not fully conducive to the ex-act substorm onset time identification, since not every sta-tion recorded the data during the event. The SAMNET and IMAGE magnetometers recorded two periods with enhanced Pi2 pulsation intensity, indicating the substorm onsets near the first and third SNITs at ∼13:10 and 17:25 UT. The geo-stationary satellite LANL 1984-084 detected three sharp in-creases in both proton and electron fluxes on the nightside at 13:08, 14:08, and 17:10 UT, indicating substorm-associated
1658 R. A. Makarevitch et al.: Meridional motions of the afternoon radar aurora Universal Time 64 65 66 67 68 69
Geomagnetic Latitude, deg
64 65 66 67 68 69
a)
J = 0
J > 500 A/km
V < -100 m/s
11 12 13 14 15 16 17 18 Universal Time 62 64 66 68Geomagnetic Latitude, deg
11 12 13 14 15 16 17 18 62 64 66 68
b)
Vel 0Fig. 7. Comparison between the IMAGE equivalent currents and (a) STARE (beam 8) and (b) CUTLASS (beam 9) velocities. The positive
(negative) velocities are shown by the dark (light) grey cells. The white contour is the boundary between eastward and westward electrojets
J =0. The area filled with the red solid color (horizontal yellow lines) corresponds to the ranges with V <−100 m/s (J >500 A/km).
180 360 540 720 900 1080 Slant Range, km 11 12 13 14 15 16 17 18 Universal Time V HF 0 V VHF 0
particle injections into the nightside ionosphere. The analysis of the nightside POLAR UVI data revealed the UVI aurora intensification associated with the substorm expansive phase onset at 17:12 UT.
During the event, the areas of the strong coherent backscatter were moving in slant range both at VHF and HF, changing the direction of meridional motion from equator-ward to poleequator-ward several times. These changes, however, were not quite simultaneous at VHF and HF; VHF echoes preceded the E-region HF echoes by ∼10 min and slightly trailed behind the F-region HF echoes. The speed of equator-ward/poleward progression was slightly decreasing with the deviation from meridional direction at VHF and increasing at HF, both for the E- and F-region echoes.
4.1 Radar aurora and auroral oval dynamics
We would first like to discuss the reasons for the observed changes in the location of the strong backscatter on a global scale and interpret the noted earlier differences between the meridional motions at HF and VHF.
We showed in Fig. 3 that the changes in the radar aurora meridional motion direction from equatorward to poleward corresponded remarkably well to the reversals of the IMF di-rection from southward to northward, even with some uncer-tainty in the IMF delay time. One quite obvious reason for such a correlation is the dayside reconnection. For a south-ward IMF, the polar cap expands and the ionosphere adjusts to a new equilibrium with the auroral oval moving equator-ward. For a northward IMF, the dayside reconnection cannot proceed anymore; the polar cap contracts and the auroral oval moves poleward. One should note here that although an asso-ciation between the dayside meridional motions and IMF Bz
polarity has been reported in the past for the case of optical aurora (e.g. Horwitz and Akasofu, 1977), whether a similar association exists between the IMF and the radar echo bands needs to be investigated, since the optical and radar aurora are not necessarily related.
Our observations of the radar echoes, although support-ing this scenario for most of the event, are not in agreement with it for observations during 13:20–14:00 UT, when the backscatter area was clearly moving poleward, while IMF
Bzwas negative. We think that this feature is related to the
fact that the motions of the afternoon radar aurora, in partic-ular, and the auroral oval, in general, were affected by the substorm processes on the nightside.
As already mentioned, the data from several instruments indicated a substorm onset at ∼13:10 UT, in reasonable agreement with the first SNIT and the reversal of the merid-ional motion direction from equatorward to poleward. It is therefore reasonable to assume that the poleward progres-sion of the backscatter area after 13:20 UT under negative IMF Bz conditions was related to the poleward expansion
of the auroral oval during the substorm expansion phase (Akasofu, 1964). One should note that most of the auro-ral observations during the substorm have been made on the nightside, whereas our observations were performed in the
afternoon/early-evening sector (13–20 MLT). In this respect we would like to point out that although the radar aurora dynamics during the substorm conditions has been studied extensively in the past on the nightside (Greenwald et al., 1973; Greenwald et al., 1975; Tsunoda et al., 1976; Baumjo-hann et al., 1978; Uspensky et al., 1983; Lewis et al., 1997; Voronkov et al., 1999), we report the first observations of the poleward motion of the radar echoes in response to the substorm onset on the dayside, as early as 15 MLT. Impor-tantly, this feature was consistent with the data from all other instruments. Thus, our observations suggest that the day-side dynamics in the 15 MLT sector can be controlled by the substorm processes in the midnight sector rather than by the dayside processes related to the reconnection near noon. The exact longitudinal extent of the region directly affected by the IMF through the dayside reconnection needs to be inves-tigated further and this work is planned.
The equatorward progression of the coherent echoes be-fore the substorm onset at 13:10 UT can be then interpreted as associated with the expansion of the auroral oval dur-ing the substorm growth phase. A similar feature was re-ported recently at HF by Lewis et al. (1997) and Voronkov et al. (1999). In both Lewis et al. (1997) and Voronkov et al. (1999), however, no poleward progression after the sub-storm onset was observed. Several examples of the coher-ent HF echoes moving in latitude synchronously with the proton aurora were presented (but not discussed in terms of substorm-associated auroral oval dynamics or IMF variation) by Jayachandran et al. (2002). We would like to empha-size at this point that the observations of the equatorward progression of the HF coherent echoes during the substorm growth phase presented in this study are also unique, since they refer to the postnoon sector. In this sense, of special interest are the results of Uspensky et al. (2001), who pre-sented the CUTLASS Finland radar observations of the F-and (later) E-region echoes ∼3 h before the substorm onset in the postnoon/early-evening sector. The relatively narrow bands (∼100 km in slant range) of HF echoes were slowly drifting equatorward with the speed of ∼30 m/s. Uspensky et al. (2001) associated the E-region CUTLASS echoes with the equatorial boundary of the diffuse luminosity belt located equatorward of the auroral oval and equatorial progression of these echoes with the diurnal rotation of the auroral oval; in the evening sector of the ionosphere the motion of the equa-torial boundary is expected to be equatorward. In our ob-servations, the speed of equatorward progression was greater (≥100 m/s), almost certainly related to more disturbed con-ditions during the event.
In Sect. 3.4 we demonstrated that the speed of the echo band equatorial progression was larger at HF and that it was different for various HF beams. For both E- and F-region HF echoes, the echo band velocity Vband was decreasing with
beam number, implying that the echo band displacement ve-locity vector was directed roughly along the meridian as one would expect for the equatorward expanding auroral oval. The variation of the echo band velocity for the STARE ob-servational directions was small, so that the velocity decrease
1660 R. A. Makarevitch et al.: Meridional motions of the afternoon radar aurora with beam number was most likely just an apparent effect due
to the uncertainties of the estimates.
The echo band velocity changes with azimuth at HF were, however, quite significant. We think that this effect is a con-sequence of HF ray bending in the course of the radio wave propagation to the irregularities and back, as discussed be-low. The broad ionospheric region with enhanced electron density and electric field moving equatorward will be first detected by an HF radar at farther ranges as F-region echoes, then by a VHF radar at lower E-region heights at somewhat closer ranges, and, finally, by an HF radar in the E-region, Fig. 2a. Meridional motion of the large-scale ionospheric en-hancement would result in meridional displacement of echo bands, which is consistent with the data presented in Fig. 3, which suggests that the reversal in the meridional motion di-rection occurs in the described above succession. The obser-vations of the F-region and the obserobser-vations of the E-region at HF at ranges much closer than at VHF are only possible due to the large ray bending at HF. As the ionospheric en-hancement migrates closer or farther from the radar, it moves essentially along the straight VHF radar beam, while at HF the ray is curved and hence the echo band velocity along the HF radar beam would be larger, even though the “true” ve-locity of the echo band, that is the veve-locity of the magnetic flux tube crossings, is the same, Fig. 2a. This implies that the larger echo band displacement velocities at HF as compared to VHF is most likely an apparent effect.
A similar argument can be put forward as an explanation of the stronger azimuthal dependence of the echo band veloc-ity at HF. The amount of bending of the radar beam depends upon the azimuth of observations. We can qualitatively es-timate how this would affect our observations using the pre-sentation of Fig. 1, which shows two types of the aspect angle isolines: the thin black curves represent the rectilinear aspect angle lines (α=−2◦, −1◦, and 0◦) and the heavy black curve
α=0◦indicates the perfect aspect angle line with refraction taken into account. Importantly, the azimuthal variation of the range distance between the heavy curve and, say, the bot-tommost thin curve (α=−2◦), gives a sense of the amount of the ray bending as a function of radar look direction. Thus, for example, for the low-number beams this distance is much larger than for the high-number beams, meaning that refraction is more significant at low-number beams, which, in turn, signifies that the apparent velocity along the radar beam would be larger for directions away from the meridian, con-sistent with the data presented in Fig. 6. We hence conclude that the difference between the azimuthal variations of the echo band displacement velocity at HF and VHF is simply a consequence of larger refraction at HF.
With respect to the comparative ability of the HF and VHF radars to detect the auroral echoes and to monitor the auroral oval dynamics, one has to consider the meridional motions as they are observed by different instruments, including co-herent radars at significantly different frequencies (12 and 144 MHz in our study). The CUTLASS radar, primarily de-signed to monitor the large-scale convection patterns in the high-latitude F-region, in our observations detected E-region
echoes almost simultaneously with the STARE radar, Fig. 8. The spatial coverage of the two radars was different, with the most intense VHF echoes observed in the gap between E-and F-region HF echoes. The reversal in the meridional mo-tion direcmo-tion of the E-region HF echoes associated with the substorm onset occurred a few minutes later as compared to the corresponding reversals inferred from the VHF radar and magnetometer data. Another important implication of this study is the potential overestimation of the echo band pro-gression speed at HF as compared to VHF, due to the radar beam curvature.
Different aspect angle conditions at two radar frequen-cies were most likely the reason for the significant equator-ward shift of the HF E-region echo band. Thus, in Fig. 4 the location of the most intense irregularities as observed by VHF radar is systematically (100–200 km) poleward of the strongest HF echoes in the E-region. In Fig. 8, the areas with the most negative VHF velocities are also located poleward of those at HF.
If one considers the relationship between electrojet cur-rents and radar echoes, an agreement between the strongest VHF echoes and most intense currents was quite good, Fig. 4. There was some poleward shift in the VHF echoes during the intervals when the most intense currents were lo-cated closer to the radar (e.g. at ∼13 UT), which is again probably related to more favorable aspect conditions at VHF at large slant ranges (see also next section). The boundaries between electrojet currents and VHF Doppler velocities of the opposite polarity were also located close to each other, Fig. 7a. The difference in range between these boundaries was most pronounced near the substorm onset at ∼13:10 UT, with the electrojet currents typically reversing at slightly far-ther ranges. Similar comparison between the electrojet cur-rents and HF velocities shows that the E-region echo band at HF was located within the eastward electrojet, consistent with the sign of HF velocities, Fig. 7b. The meridional mo-tions of the boundary between electrojets of the opposite po-larity were well synchronized with those of the absorption patches during the first half of the interval under study, Fig. 5. 4.2 Irregularity Doppler velocity and electrojet direction Another major issue considered in this study is the relation-ship between the Doppler velocity of coherent echoes and the ionospheric electric field/electrojet current. In the F-region, the dominant irregularity generation mechanism is the gradi-ent drift (G-D) instability and the irregularity phase velocity is simply equal to that of the background plasma convection or E×B drift. In the E-region, the situation is much more complicated. For observations at large angles with respect to the background drift of electrons Ve0, the secondary waves
generated through the nonlinear cascade of energy from the primary two-stream or G-D waves, are often assumed to propagate with the velocity of primaries given by
V = ˆk ·Ve0+9Vi0
with 9 = νeνi ei (cos2α + 2 e ν2e sin 2α). (2)
Here ˆk is the unit wave vector k/ k; Ve0(Vi0)is the electron
(ion) drift velocity; α is the off-orthogonal magnetic aspect angle; νe, νi, e, and i are collision and gyrofrequencies of
the electrons and ions, respectively.
Since in the E-region i νi, the electron background
drift dominates, so that for the westward convecting plasma flow appropriate for the MLT sector under study (13:00– 20:00 MLT), the E-region Doppler velocity should be nega-tive for the radar beams looking more westward (e.g. STARE beam 1) and close to zero at perpendicular to the flow direc-tions (STARE beam 8).
In Fig. 6 the Doppler velocity is indeed negative for the slant ranges close to the power maximum location (islands of solid color). The latter, however, was not maximized at a range close to the minimum aspect angle range shown by the red lines and this was also the case for the Doppler velocity, though Eqs. (1–2) predict that the phase velocity should be maximized at perfect (if it is achievable) aspect angle and decrease with the aspect angle increase.
Moreover, for STARE beam 8 (Fig. 6f), that is for radar beams looking perpendicular to the flow, we observed an in-teresting feature; velocity was positive at farther ranges and very large, up to +700 m/s, in disagreement with the sense of westward drifting plasma (eastward current flow). We then compared the STARE Doppler velocity with the IM-AGE equivalent currents (Fig. 7a) and found that these large positive Doppler velocities were recorded within the west-ward electrojet.
To interpret large velocity magnitudes of more than 700 m/s within the westward electrojet, however, is not that easy. We think that the combination of two effects, namely the aspect angle conditions for the radar directions of interest and electric field gradients are responsible for the observed significant Doppler velocity variation with range.
The large positive Doppler velocities were observed only for the easternmost STARE beams 7 and 8. For these di-rections, as we noted earlier, the orthogonality condition can be reached at two sets of ranges with relatively good aspect angles of the order of 0.5◦between 700–1200 km and with quickly decreasing aspect angles up to −2◦at closer ranges 500–700 km. One can state that the aspect angle conditions at farther ranges corresponding to the westward electrojet are much more favorable than at closer ranges (eastward electro-jet) for these directions.
The latitudinal distribution of the equivalent current den-sity under the assumption of the plasma denden-sity homogene-ity, on the other hand, indicates corresponding latitudinal variation of the plasma drift/electric field with the direction reversal in the latter occurring near the range of the Doppler velocity sign reversal. We illustrated this feature in Fig. 2b that shows the areas with the gradually changing electric field intensity (to the left and to the right from the white inclined
stripe). The electrojet current at ∼100 km is shown schemat-ically by the circles with dots and crosses inside; it is directed to the east (west) for the area located southward (northward) from the white stripe denoting the boundary between the electrojets of the opposite polarity.
The large positive Doppler velocities were observed only during the interval for which the westward electrojet was ob-served very close to the radar (e.g. at ∼13:30 UT), which can imply that during this interval the radar probed (at farthest ranges) the areas with the most intense electric field. Thus, in Fig. 2b the radar would probe the darkest area to the right (poleward) from the white stripe when the white stripe (to-gether with adjacent grey areas) would move the farthest to the left (equatorward).
Importantly, since the aspect angle conditions are better at the far ranges (where the westward electrojet was developed) than at short ranges (where the eastward electrojet was devel-oped), the latitudinal variation and direction reversal of the electric field stipulate significantly higher Doppler velocities in the westjet as compared to the simultaneous eastjet ob-servations, even if the electric field intensity itself is smaller in the westjet (as suggested by Fig. 4). Being directly pro-portional to the convection velocity/electric field and quickly decreasing with the aspect angle through Eqs. (1–2), the Doppler velocity variation with latitude/range is determined by the combination of these two factors.
Although no electric field measurements were available for the interval 12:30–13:30 UT when large positive veloc-ities were observed, the DMSP ion drift measurements of the convection velocity for three passes over the FoV (F13: 14:18–14:21 UT, F14: 17:52–17:56 UT, and F15: 17:44– 17:48 UT) during the event generally support the hypothe-sis of the electric field/convection gradual decrease with lat-itude, direction reversal, and again gradual increase towards the magnetic pole. In Fig. 1 we show the ion drift-meter data from one Defense Meteorological Satellite Program (DMSP) pass over the near radars’ FoV during the interval under study. Here the black vectors are the cross-track ion drift ve-locity. The scale of vectors is indicated in the top right corner of the diagram. Data from a DMSP altitude of 810 km were projected to an E-region height of 110 km along the PACE magnetic field lines. For the other two passes, the zonal con-vection reversal latitudes were also found to be in reasonable agreement with the latitudes of the eastjet poleward bound-ary.
The other interesting Doppler velocity feature noticed in Fig. 7a was that the STARE radar recorded small positive velocities for a large number of radar cells. These small pos-itive Doppler velocities are impossible to explain by the dif-ferent direction of the plasma flow, since some of them were definitely within the eastjet for which the l-o-s component of the flow is expected to be negative, especially for more zon-ally directed beams such as STARE beam 1. We think that the STARE velocity measurements for these areas might not represent general trends, since both the echo power and elec-trojet intensity was low. As mentioned, in this study we used the standard double-pulse STARE velocity data, which, as
1662 R. A. Makarevitch et al.: Meridional motions of the afternoon radar aurora demonstrated by Uspensky et al. (2004), under certain
con-ditions can somewhat underestimate the true Doppler veloc-ity (inferred from the ACF data similar to the SuperDARN radars). Moreover, according to Uspensky et al. (2004) (see their Fig. 2), when the backscatter power (and multi-pulse Doppler velocity) was low the STARE Finland double-pulse velocity changed its sign, becoming slightly positive for east-ward electrojet flow.
Interestingly, the E-region CUTLASS observations in the areas collocated with those of small positive STARE veloci-ties (500–700 km) showed predominantly negative Doppler velocities for almost the entire period (except for the last 80 min), indicating the “proper” direction of the flow, Figs. 6a, c, e. The Doppler velocity at HF was neverthe-less smaller compared to that at VHF when the area with strong VHF echoes (or negative velocities) was sufficiently close in range to allow the meaningful comparison (as, for example, near 12:45 or 14:00 UT). The Doppler velocity at HF was typically less than 300 m/s, and it did not change sign along the radar beam. HF echoes with unusually small Doppler velocities were reported previously by Makarevitch et al. (2002) and Milan et al. (2003) and hypothesized to be the scatter from the bottom of an unstable E-layer, where the Doppler velocity is depressed because of the enhanced 9-factor in Eq. (1) due to larger collision frequencies with neu-trals, Eq. (2).
In both Makarevitch et al. (2002) and Milan et al. (2003), however, no electric field measurements near the HF scat-ter area were available. In our observations, simultaneous STARE velocities were quite high (up to 500 m/s at ∼600 km in Fig. 6d), therefore, HF Doppler velocity limited in mag-nitude is unlikely to be caused by the small electric field in-tensity. The Doppler velocity at HF was featured recently in another study (Makarevitch et al., 2004), where the same conclusion was reached on the basis of the simultaneous F-and E-region CUTLASS observations during the event when the DMSP drift-meter measurements did not show any sig-nificant latitudinal variation of the convection component. Therefore, we will not discuss this issue any further, but note that the simultaneous HF/VHF observations provide yet an-other argument in support of this conclusion.
4.3 Absorption patch velocity
Under the conditions of strong horizonal electric field the E-region plasma can be heated by the unstable plasma waves generated through the electrojet instabilities (Schlegel and St.-Maurice, 1981). This E-region heating could also lead to an increase in the CNA, since absorption is proportional to
νe, which for the typical E-region heights increases with the
electron temperature Teas ∝ Te1/2(e.g. Kelley, 1989, p. 462).
Following this idea, Stauning (1984) introduced a new class of riometer events for observations in the polar cap, where relatively small absorption enhancements (patches) associ-ated with heating could be easily distinguished from the ab-sorption due to the particle precipitation that is responsible for a bulk of CNA events. Later, Stauning et al. (1995)
at-tributed the polar progressing disturbances in both magne-tometer and riometer data in the polar cap to the electron heating associated with the By-related disturbances in the
electrojet current system. One should note that the above interpretation is remarkably different from the more widely accepted notion that the auroral precipitation of the ener-getic (>15 keV) electrons is responsible for the formation of absorption patches (see, for example, the recent review by Stauning, 1996), which implies that the latter should move either with the E×B drift (Hargreaves, 1970; del Pozo et al., 2002) or with significantly larger velocities during the sub-storm expansion phase (Nielsen, 1980; del Pozo et al., 2002). During the first half of the period under study, the absorp-tion features moved in the meridional direcabsorp-tion with veloci-ties that were very close to those observed in the radar aurora and equivalent currents, Fig. 5, Vabs∼=Vband∼100 m/s. The
Doppler velocity measured by the coherent radars near the IRIS FoV (r∼800 km) was, on the other hand, significantly larger; for example, at ∼12:10 UT the STARE radar observed E-region velocities of ∼500 m/s, with similar F-region ve-locities recorded by CUTLASS, Figs. 6e, f, which implies that the meridional motion velocity of absorption patches in our observations was different from the convection compo-nent, but comparable to that of the coherent echo bands and electrojet currents. One can then assume that the absorption patches in our event were moving together with the areas of enhanced electric field in the E-region rather than with the convecting magnetic field lines and that the CNA enhance-ments were caused mostly by the heating associated with the large horizontal electric fields.
In our opinion, the observations of the auroral riometer absorption presented in this study are thus more consistent with the electron heating mechanism (or Electron Heating Absorption (EHA) type in classification of Stauning, 1996) than with the D-region electron precipitation idea. In this sense the results of the present study are more reminiscent of those of Stauning (1984) and Stauning et al. (1995) than, for example, of del Pozo et al. (2002). There are, however, sev-eral important differences between this study and Stauning et al. (1995). First of all, the electric field that caused the ab-sorption enhancements in our case was the electric field as-sociated with the background auroral convection rather than with the local convection flow enhancements. The motion of the absorption patches was synchronized with the meridional displacements of the auroral oval rather than with the polar progressing By-related disturbances in the polar cap and
ve-locity was much smaller in our case (100 m/s versus 1 km/s).
5 Summary and conclusions
The presented observations of the radar aurora at two fre-quencies (12 and 144 MHz), electrojet currents, and riome-ter absorption during a 7-h event in the afriome-ternoon sector (13–20 MLT) showed synchronous, to a first approximation, meridional motions of the areas of strong HF and VHF coherent backscatter, intense equivalent electrojet currents,