HAL Id: hal-02609421
https://hal.inrae.fr/hal-02609421
Submitted on 25 May 2020
HAL is a multi-disciplinary open access
archive for the deposit and dissemination of
sci-entific research documents, whether they are
pub-lished or not. The documents may come from
teaching and research institutions in France or
abroad, or from public or private research centers.
L’archive ouverte pluridisciplinaire HAL, est
destinée au dépôt et à la diffusion de documents
scientifiques de niveau recherche, publiés ou non,
émanant des établissements d’enseignement et de
recherche français ou étrangers, des laboratoires
publics ou privés.
Distributed under a Creative Commons Attribution - NonCommercial| 4.0 International
License
Potential of Sentinel-2 satellite images to monitor vine
fields grown at a territorial scale
Nicolas Devaux, T. Crestey, C. Leroux, Bruno Tisseyre
To cite this version:
Nicolas Devaux, T. Crestey, C. Leroux, Bruno Tisseyre. Potential of Sentinel-2 satellite images to
monitor vine fields grown at a territorial scale. OENO One, Institut des Sciences de la Vigne et
du Vin (Université de Bordeaux), 2019, 53 (1), pp.52-59. �10.20870/oeno-one.2019.53.1.2293�.
�hal-02609421�
Potential of Sentinel-2 satellite images to monitor vine fields grown
at a territorial scale
Nicolas Devaux1, Thomas Crestey2, Corentin Leroux2-3, Bruno Tisseyre 2*
1LISAH, Montpellier SupAgro, INRA, IRD, Univ Montpellier, Montpellier, France 2UMR ITAP, Montpellier SupAgro, Irstea, Univ Montpellier, France
3SMAG, Montpellier, France
Corresponding author: skoundou@agro.auth.gr
Aim: The aim of this short note is to provide first insights into the ability of Sentinel-2 images to monitor vine
growth across a whole season. It focuses on verifying the practical temporal resolution that can be reached with Sentinel-2 images, the main stages of Mediterranean vineyard development as well as potential relevant agronomic information that can be seen on the temporal vegetation curves arising from Sentinel-2 images.
Methods and results: The study was carried out in 2017 in a production vineyard located in southern France, 2 km
from the Mediterranean seashore. Sentinel-2 images acquired during the whole vine growing cycle were considered, i.e. between the 3rd of March 2017 and the 10th of October 2017. The images were used to compute the classical normalized difference vegetation index (NDVI). Time series of NDVI values were analyzed on four blocks chosen for exhibiting different features, e.g. age, missing plants, weeding practices. The practical time lag between two usable images was closer to 16 days than to the 10 theoretical days (with only one satellite available at the date of the experiment), i.e. near 60% of the theoretical one. Results show that it might be possible to identify i) the main steps of vine development (e.g. budburst, growth, trimming, growth stop and senescence), ii) weed management and inter-row management practices, and iii) possible reasons for significant inter-block differences in vegetative expression (e.g. young vines that have recently been planted, low-productive blocks affected by many missing vines).
Conclusions: Although this experiment was conducted at a time when Sentinel-2b was not fully operational, results
showed that a sufficient number of usable images was available to monitor vine development. The availability of two Sentinel satellites (2a and 2b) in upcoming seasons should increase the number of usable images and the temporal resolution of the time series. This study also showed the limitations of the Sentinel-2 images’ resolution to provide within-block information in the case of small blocks or blocks with complex borders or both.
Significance and impact of the study: This technical note demonstrated the potential of Sentinel-2 images to
characterize vineyard blocks’ vigor and to monitor winegrowers’ practices at a territorial (regional) scale. The impact of management operations such as weeding and trimming, along with their incidence on canopy size, were observed on the NDVI time series. Some relevant parameters (slope, maximum values) may be derived from the NDVI time series, providing new insights into the monitoring of vineyards at a large scale. These results provided areas for further investigation, especially regarding the development of new indicators to characterize block-climate relationships.
vine growth, satellite images, large-scale monitoring, NDVI A B S T R A C T
K E Y W O R D S
51 OENO One 2019, 1, 51-58 © 2019 International Viticulture and Enology Society - IVES
INTRODUCTION
Multiple studies have shown the interest of
remote sensing images for field or within-field
management purposes in viticulture such as
irrigation or fertilization monitoring
(Acevedo-Opazo et al., 2008; Carrillo et al., 2016; Hall et
al., 2002; Johnson et al., 2001). However,
current limitations of most remote sensing
acquisition platforms are their low temporal
resolution (16 days for the LandSat8 platform)
and their cost ($1.65/km² for Spot 6-7 new
image acquisition with a minimum order of
500km² or $1.28/km² for RapidEye new image
acquisition with a minimum order of 3500km²).
It is acknowledged that unmanned aerial vehicle
(UAV) and airborne platforms can be used
intensively over time to monitor the temporal
dynamics of vine growth or vine water status
either at the field or at the within-field level
(Hall et al., 2011), but such monitoring approach
is quickly limited by acquisition costs, making
any commercial services unrealistic for most
vineyards (Matese et al., 2015).
The recent availability of Sentinel-2 images
might be seen as an interesting opportunity to
provide an affordable service to monitor vine
growth over time. Indeed, the two satellites (2a
and 2b) have particularly valuable features
(ESA, 2012):
- a revisit period of 5 days that could enable the
observation of significant changes in canopy
growth (e.g. new phenological stage or biotic
and abiotic stresses);
13 different spectral bands, 10 of which being
-particularly interesting for the computation of
vegetation indices [e.g. normalized difference
vegetation index (NDVI) or soil-adjusted
vegetation index (SAVI)] or soil-related
indicators; and
- a free diffusion of the images, with multiple
levels of correction (e.g. atmospheric
correction, orthorectification, cloud masks,
etc.).
Despite these advantages, Sentinel-2 images also
present some drawbacks which, in viticulture
and depending on the wine-growing regions,
may limit the use of this new information source.
First, the images’ spatial resolution ranges from
10 to 20 m according to the wavebands, which
may be limiting to record relevant information in
small fields or in fields with complex boundaries
such as those commonly found in southern
France. Another limitation of this resolution lies
in the impossibility of obtaining pure pixels of
vine. Indeed, Sentinel-2 images are necessarily
made up of mixed pixels (vines/soil or
vines/cover crop when the inter-row is grassed).
Second, depending on the location under study,
cloudy weather conditions can be of great
concern as they limit the number of usable
images. Finally, it is stressed that the chain
actually available to process, correct and supply
Sentinel-2 images has not yet been tested in light
of a possible new service for dynamic vine
vegetation monitoring.
The main goal of this short note is to provide
first insights into the ability of Sentinel-2 images
to monitor vine growth across a whole season.
The objective of this study is to answer the two
main following questions: i) Which practical
temporal resolution can be reached with
Sentinel-2 images? ii) Can the main stages of
Mediterranean vineyard development be seen on
the temporal vegetation curves arising from
Sentinel-2 images? Questions and concerns
requiring further work with this new source of
information are discussed.
MATERIALS AND METHODS
1. Study area
The study was carried out in 2017 in a
production vineyard, called Domaine du
Chapitre, located close to Montpellier
(Villeneuve-lès-Maguelone, France 43°31’52.
668”N, 3°51’51.597”W, RGF93), 2 km from the
Mediterranean seashore.
The vineyard is composed of 40 blocks ranging
from 0.1 to 4.69 ha (the mean block area is
0.8 ha). Vine blocks were planted between 1973
and 2016 and were subjected to a very classical
training system in southern France (vertical
shoot positioning with a 2.5 m inter-row and
mechanical weeding). Vines are grown under
Mediterranean climatic conditions characterized
by a hot and dry summer. Precipitations mainly
occur in autumn and spring. A high evaporative
demand usually leads to significant water
restrictions in summer. Blocks are mainly
non-irrigated.
Four out of the 40 blocks were selected for the
study (Figure 1). The latter were chosen for
exhibiting different features, e.g. age, missing
plants, weeding practices (Table 1). Note that all
Nicolas Devaux et al.
© 2019 International Viticulture and Enology Society - IVES OENO One 2019, 1, 51-58 52
the technical operations that were carried out on
the blocks were filed in the farm management
information system (Agreo, SMAG, Montpellier,
France) by the vineyard manager. This made it
possible to retrieve the date of each management
operation inside each block.
2. Data acquisition
All the Sentinel-2 images that were used in this
study were distributed by Copernicus with a
level-2A processing provided by the National
Centre for Spatial Studies (CNES) for the Theia
data centre (Irstea, Montpellier, France)
1.
Level-2A correction incorporates several processes
such as image orthorectification, and corrections
for atmospheric and slope effects. In addition,
Theia level-2A images are provided with cloud
and shadow masks. Level-2A images are
currently available within an interval of more or
less 8 days after the raw images are acquired.
Sentinel-2a images have 13 spectral bands
(ESA, 2012) with a spatial resolution ranging
from 10 to 20 m depending on the band. In this
study, only the red band (665 nm ± 15 nm) and
the NIR band (842 nm ± 52 nm) were used to
compute the classical NDVI index (Rouse et al.,
1974). Both bands come with a 10-m spatial
resolution. In this study, only the images
acquired during the whole vine growing cycle
were considered, i.e. between the 3
rdof March
2017 and the 10
thof October 2017.
© 2019 International Viticulture and Enology Society - IVES
OENO One 2019, 1, 51-58 53
OENO One, 2017, vol. , x
!"# " " " " " " " " " " " " " " " " " " " " " " " " " " " " " " " " " " " " " " " " " " " " " " " " " " " " " " " " " " " " " " " " " " " " "
FigurE 1. Location of the vineyard and the four blocks of interest
The red line inside the blocks is an inner buffer that is used to remove border effects (see the “Data processing” section)
TABLE 1. Main characteristics of the four blocks of interest
Block ID Planting year Area (ha) Varieties Specificities cover cropInter-row
B1 2000 1.91 Caladoc Fully productive block (Reference) None
B2 1973 0.41 Syrah Old vines with 23% of missing vines Present
B3 2002 0.84 Syrah Fully productive block Present
B4 2016 0.71 Muscari Young vines (2 years old with limited canopy development) None
3. Data processing
In this study, the whole processing included the
following steps:
I
Downloading Sentinel-2 images.
II In addition to cloud and shadow masks
delivered with the images, carrying a visual
check of each image on the four blocks of
interest in order to identify any disturbance
(haze, isolated cloud not detected, etc.)
likely to affect the quality of the
calculation.
III Cropping red and near-infrared bands with
an inner buffer of 10m to avoid border
effects (Figure 1).
IV Computing NDVI using the cropped red
and near-infrared images.
V Extracting descriptive NDVI statistics
(mean value) in each block boundary.
Image processing was performed with the QGIS
software (version 2.18, QGIS Development
Team, 2018 - Open Source Geospatial
Foundation Project
2). The processing of each
image took less than 10 seconds with a computer
equipped with a processor i5 7th generation with
four cores and a 3.80 GHz base frequency.
RESULTS AND DISCUSSION
1. Practical temporal resolution of Sentinel-2
images
Figure 2 shows the NDVI temporal dynamics for
block B1. During the experiment, Sentinel-2a
was the only operational satellite to provide
usable images. No images from Sentinel-2b
could be used for the study period. As the revisit
period of the Sentinel-2a satellite is 10 days, 22
images should have been potentially available
over the experiment. After the elimination of
cloudy images and the identification of images
that were not acquired due to technical problems,
a total of 14 images were found available to
compute the NDVI temporal spectrum. Results
show that the time lag between two usable
images was closer to 16 days than to the 10
theoretical days presented (the practical time lag
is near 60% of the theoretical one).
Figure 2 shows that the NDVI temporal
dynamics created with Sentinel-2 images enable
to identify the main stages of vine development.
The budburst and growth phases corresponding
to an increase in biomass (NDVI) are perfectly
observed from early April to mid-June. After
mid-June, the decrease in NDVI values is due to
summer operations (trimming). After mid-July, a
plateau corresponding to a stop in vegetation
growth is observed. At veraison (August), the
Nicolas Devaux et al.
© 2019 International Viticulture and Enology Society - IVES OENO One 2019, 1, 51-58 54
OENO One, 2017, vol. , x
FigurE 2. NDVI temporal dynamics on plot B1 between 2017/03/14 and 2017/10/10
Images are either Usable, Cloudy (it was not possible to calculate the NDVI due to climatic conditions) or Missing (images were not available on the CNES web platform).
(Johnson, 2003; Johnson et al., 2001). At the end
of September, after harvest, the decrease in
NDVI values corresponds to leaf senescence.
The study site benefits from a very high annual
sunshine rate. Despite these advantageous
climatic conditions, note the two successive
cloudy images in May. Practically, this lack of
images is problematical as this period
corresponds to a period of high plant growth
where more information is needed. Note also that
six images were missing during the whole vine
development (Figure 2), mainly due to technical
problems in the processing chain of the images’
providers. These technical problems have now
been resolved, meaning that, theoretically, 20
images should have been available over the
season. It is reminded that this study has only
been performed with one single Sentinel
satellite. The use of both satellites in upcoming
Figure 3 shows NDVI maps at the within-block
level over four dates spanning the whole season.
Figure 3 highlights i) an increase in NDVI
values during the leaf development phase, from
2017/04/03 to 2017/06/22, ii) a maximum NDVI
value in June, and iii) a decrease in NDVI values
at the end of summer and early autumn as
illustrated on 2017/10/10. Figure 3 also shows
the advantages and limitations of Sentinel-2
images to observe either inter-block or
within-block variability. It must be clear that the
objective of this technical note is not to provide
an explanation for the observed NDVI spatial
variability. Much work has already been
dedicated to this issue in the literature
(Acevedo-Opazo et al., 2008; Carrillo et al., 2016; Hall et
al., 2002; Johnson et al., 2001). The objective is
rather to discuss what seems to be observable
and provide areas for further investigation.
Inter-© 2019 International Viticulture and Enology Society - IVES
OENO One 2019, 1, 51-58 55
OENO One, 2017, vol. , x
plot variability can be observed on the first
image (2017/04/03), for example between block
B1 and the block further north, certainly because
of differences in cover crop, variety, training
system, etc. On 2017/04/03, the resolution of the
NDVI map allows to visualize some level of
intra-block variability in the block further north
to B1 that may be related to differences in vigor
or in cover-crop development, etc. Lower NDVI
values, corresponding to early canopy
senescence, can also be observed in the western
part the block on 2017/10/10.
Regardless of this interest to highlight
within-block zones, the 10-m spatial resolution remains
a strong limitation for most of the blocks,
especially those south to B1. Indeed, in the case
of small or narrow fields, very few NDVI values
can be extracted, which means that the proposed
methodology cannot apply to small blocks or
blocks with complex boundaries. This
constitutes a significant limitation for the use of
Sentinel-2 images in some vineyards, especially
small blocks in small farms as those found in
southern France. Extreme care should therefore
be paid to the vineyard blocks (size and shape)
before recommending the use of Sentinel-2
images to map vine vigor throughout the season.
3. Monitoring vines’ temporal NDVI
dynamics with Sentinel-2 images
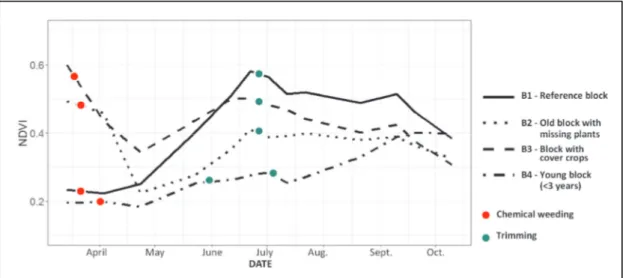
Figure 4 shows the NDVI temporal dynamics for
the four blocks of interest whose characteristics
are presented in Table 1. The four NDVI time
series are particularly interesting because they
highlight specific features of the vine
development in each of the four blocks under
study. At the beginning of the season (April),
Figure 4 shows significant NDVI differences
between the blocks with inter-row cover crops
(B2 and B3) and the others (B4 and B1). At this
date, the vines had not broken out yet, leading to
higher NDVI values in blocks B2 and B3
because of the photosynthetically active biomass
of the inter-row crop. Lower NDVI values for B4
and B1 were mainly due to low bare soil’s
reflectance. From April to mid-May, the decrease
in NDVI values observed for blocks B2 and B3
originated from a chemical weeding operation
and the destruction of the inter-row cover crop.
The inter-row was then weeded as much as
necessary until the summer, so any residual
inter-row crop has a very small impact on NDVI
values during the rest of the season for these
blocks. At the beginning of May, the NDVI
values were almost identical for B1, B2 and B4.
Note, however, that higher NDVI values could
be observed for B3 since weeding was carried
out every two rows compared to the other block
with inter-row cover crop, B2, for which
weeding was done on each inter-row. From May
to the end of June, the increase in NDVI values
was due to classical vegetative growth. However,
the four blocks differed in the maximum NDVI
value that was reached at the end of the vine
growth stage (beginning of July). The highest
values (0.5 < NDVI < 0.6) were observed for the
two blocks at full production, B1 and B3. For
B2, the lower NDVI peak (NDVI = 0.4) was
probably due to the higher number of missing
vines (Table 1). The lowest NDVI peak that was
found for B4 was the consequence of the
Nicolas Devaux et al.
© 2019 International Viticulture and Enology Society - IVES OENO One 2019, 1, 51-58 56
OENO One, 2017, vol. , x
(
FigurE 4. NDVI temporal dynamics for the four blocks of interest (B1, B2, B3, B4)
July resulted in a slight decrease in NDVI values
for the four plots under study. The NDVI values
then remained relatively stable after the growth
had stopped (after mid-July), especially for B1,
B2, and B3. The plateau values observed from
mid-July to mid-September were different for
each of these three blocks because of differences
in the overall biomass (vine canopy). Note,
however, the particular behavior of B4 during
summer with a constant increase in NDVI, which
may be explained by a growth resumption of the
young vines without any fruits. The last NDVI
peak occurring in September, after harvest, was
due to the specific Mediterranean climatic
conditions that took place, i.e. autumn rains,
which reduced summer water stress and revived
plant growth. Senescence was observed
simultaneously (mid-September) for the four
blocks.
These results highlighted the potential interest of
temporal sequences of Sentinel-2 images to
characterize vineyard blocks’ vigor and to
monitor winegrowers’ practices at a territorial
(regional) scale. Indeed, given what was found in
Figure 4, it might be possible to identify i) weed
management and inter-row management
practices, ii) the trimming date with the
associated potential impact on canopy size, iii)
possible reasons for significant inter-block
differences in vegetative expression (e.g. young
vines that have recently been planted,
low-productive blocks affected by many missing
vines), and iv) interesting pathways for
developing new indicators of vine development
for new consulting services or by growers
themselves. For instance, the NDVI slope
between bud break and growth stop could be a
relevant indicator of vine vigor. The NDVI
plateau may also constitute an indicator of the
overall vegetative expression. It should be noted
that such indicators could be used to
cross-compare vintages in the near future when
substantial historical databases will be set up.
Similar researches are already underway for
arable crops with software development that
automatically estimates new indicators from
NDVI time series (Eklundh and Jönsson, 2016).
blocks’ vigor and to monitor winegrowers’
practices at a territorial (regional) scale. As an
example, the impact of management operations
such as weeding and trimming, along with their
incidence on canopy size, were observed on the
NDVI time series. Some relevant parameters
(slope, maximum values) may be derived from
the NDVI time series, providing new insights
into the monitoring of vineyards at a large scale.
These results provided areas for further
investigation, especially regarding the
development of new indicators to characterize
block-climate relationships as well as
management operations performed by growers.
New experiments have already been conducted
in the study domain to test the relevance of these
indicators. Although this experiment was
conducted at a time when Sentinel-2b was not
fully operational, results showed that, under
Mediterranean growing and climatic conditions,
a sufficient number of usable images was
available to monitor vine development. It must
be stated, however, that this study also showed
the limitations of the Sentinel-2 images’
resolution to provide within-block information
in the case of small blocks or blocks with
complex borders or both. One should be aware
that any Sentinel-2-based service will
necessarily depends on the quality of images’
corrections and the velocity with which
corrected images are provided to users. This last
point may constitute important limitations.
Acknowledgements
This technical note contains Copernicus
Sentinel-2 data 2017 processed at level-2A by
CNES for THEIA Land data centre. The authors
thank Denis Feurer for helpful discussions on
the processing.
REFERENCES
Acevedo-Opazo C., Tisseyre B., Guillaume S. and Ojeda H., 2008. The potential of high spatial resolution information to define within-vineyard zones related to vine water status. Precision Agriculture, 9(5), 285–302. doi:10.1007/s11119-008-9073-1
Carrillo E., Matese A., Rousseau J. and Tisseyre B., 2016. Use of multi-spectral airborne imagery to improve yield sampling in viticulture. Precision
© 2019 International Viticulture and Enology Society - IVES
Agriculture, 17(1), 74–92. doi:10.1007/s11119-015-9407-8
Eklundh L. and Jönsson P., 2016. TIMESAT for processing time-series data from satellite sensors for land surface monitoring. In Multitemporal Remote Sensing: Methods and Applications, ed. Y. Ban, Springer International Publishing, pp. 177–194. doi:10.1007/978-3-319-47037-5_9
ESA, 2012. Sentinel-2, ESA’s Optical High-Resolution Mission for GMES Operational Services. Ed. K. Fletcher, European Space Agency (ESA) Communications, The Netherlands. https://sentinel. esa.int/documents/247904/349490/S2_SP-1322_2.pdf Hall A., Lamb D. W., Holzapfel B. and Louis J., 2002. Optical remote sensing applications in viticulture - a review. Australian Journal of Grape and Wine Research, 8(1), 36–47. doi:10.1111/j.1755-0238.2002.tb00209.x
Hall A., Lamb D.W., Holzapfel B.P. and Louis J.P., 2011. Within-season temporal variation in correlations between vineyard canopy and winegrape composition and yield. Precision Agriculture, 12(1), 103–117. doi:10.1007/s11119-010-9159-4
Johnson L.F., 2003. Temporal stability of an NDVI-LAI relationship in a Napa Valley vineyard. Australian Journal of Grape and Wine Research, 9(2), 96–101. doi:10.1111/j.1755-0238.2003. tb00258.x
Johnson L.F., Bosch D.F., Williams D.C. and Lobitz B.M., 2001. Remote sensing of vineyard management zones: implications for wine quality. Applied Engineering in Agriculture, 17(4), 557–560. doi:10.13031/2013.6454
Matese A., Toscano P., Di Gennaro S.F., Genesio L., Vaccari F.P., Primicerio J., Belli C., Zaldei A., Bianconi R. and Gioli B., 2015. Intercomparison of UAV, aircraft and satellite remote sensing platforms for precision viticulture. Remote Sensing, 7(3), 2971–2990. doi:10.3390/rs70302971
Rouse J.W. Jr., Haas R.H., Schell J.A. and Deering D.W., 1974. Monitoring the Vernal Advancement and Retrogradation (Green Wave Effect) of Natural Vegetation. Final Rep. RSC 1978-4, Remote Sensing Center, Texas A&M Univ., College Station. https://ntrs.nasa.gov/archive/nasa/casi.ntrs.nasa.gov/1 9730017588.pdf
Nicolas Devaux et al.
© 2019 International Viticulture and Enology Society - IVES OENO One 2019, 1, 51-58 58