HAL Id: hal-02324241
https://hal.archives-ouvertes.fr/hal-02324241
Submitted on 15 Jun 2020HAL is a multi-disciplinary open access
archive for the deposit and dissemination of sci-entific research documents, whether they are pub-lished or not. The documents may come from teaching and research institutions in France or abroad, or from public or private research centers.
L’archive ouverte pluridisciplinaire HAL, est destinée au dépôt et à la diffusion de documents scientifiques de niveau recherche, publiés ou non, émanant des établissements d’enseignement et de recherche français ou étrangers, des laboratoires publics ou privés.
maximus using pigments, fatty acids and sterols analyses
Romain Lavaud, Sébastien Artigaud, Fabienne Le Grand, Anne Donval,
Philippe Soudant, Jonathan Flye-Sainte-Marie, Tore Strohmeier, Øiving
Strand, Aude Leynaert, Beatriz Beker, et al.
To cite this version:
Romain Lavaud, Sébastien Artigaud, Fabienne Le Grand, Anne Donval, Philippe Soudant, et al.. New insights into the seasonal feeding ecology of Pecten maximus using pigments, fatty acids and sterols analyses. Marine Ecology Progress Series, Inter Research, 2018, 590, pp.109-129. �10.3354/meps12476�. �hal-02324241�
Please note that this is an author-produced PDF of an article accepted for publication following peer review. The definitive publisher-authenticated version is available on the publisher Web site.
Marine Ecology Progress Series March 2018, Volume 590 Pages 109-129 http://dx.doi.org/10.3354/meps12476 http://archimer.ifremer.fr/doc/00431/54244/
© Inter-Research and Fisheries and Oceans Canada 2018 · www.int-res.com
Archimer
http://archimer.ifremer.fr
New insights into the seasonal feeding ecology of Pecten
maximus using pigments, fatty acids and sterols analyses
Lavaud Romain 1, 2, * , Artigaud Sébastien 2, Le Grand Fabienne 2, Donval Anne 2, Soudant Philippe 2, Flye-Sainte-Marie Jonathan 2, Strohmeier Tore 3, Strand Øivind 3, Leynaert Aude 4, Beker Beatriz 2,Chatterjee Arnab 2, Jean Fred 2
1
Fisheries and Oceans Canada/Pêches et Océans Canada, Gulf center/Centre du Golfe, Moncton, NB E1C 9B6, Canada
2 Laboratoire des sciences de l’environnement marin (UMR6539 CNRS/UBO/IRD/Ifremer), Institut
Universitaire Européen de la Mer, Université de Brest, 29280 Plouzané, France
3
Institute of Marine Research (IMR), 5005 Bergen, Norway
* Corresponding author : Romain Lavaud, email address : romain.lavaud@dfo-mpo.gc.ca
Abstract :
We combined the use of pigments, fatty acids and sterols as biomarkers of the seasonal variation in food sources of the great scallop Pecten maximus. From March to October 2011, on a biweekly to twice-weekly basis, scallops and seawater from the water column and the water-sediment interface were collected in the Bay of Brest (Brittany, France). Pigment compositions in the seawater and in the stomach and rectum content of the scallops were analyzed by HPLC. Fatty acids and sterols from digestive gland (DG) tissue were analyzed by gas chromatography. Potential relationships between the temporal proportion of each marker in the environment and in the digestive tract were tested using multivariate analysis. Proportions of diatoms and Dinophyceae biomarkers alternated in the digestive tract of P. maximus. This switch of feeding was confirmed by the polar lipid composition of the DG. Peridinin, characterizing Dinophyceae, occurred in high proportions in the digestive tract compared to the low ambient concentration, suggesting a selection of this microalgae group by the scallop. Chlorophyceae and green macroalgae tracers were found in low proportions, suggesting they were not actually ingested. Markers of Prymnesiophyceae were also observed at significant levels. Cyanobacteria tracers showed that this microalgae class was not ingested by the scallops during monitoring but may be of higher importance during winter. Switching from one food source to another as well as selectivity in feeding are discussed relative to the season.
Keywords : Trophic ecology, Food sources, Pigments, Fatty acids, Trophic marker, Phytoplankton,
2
1. Introduction
Scallops, such as Pecten maximus (Linnaeus, 1758), are sessile, suspension-feeding animals living half-buried on the sea floor. They rely on the availability of trophic resources in the nearby water to obtain their food. In coastal environments, factors such as temperature, light, riverine inputs, salinity, tide and currents influence seawater primary production. The availability of food depends on the strong seasonality of these hydrological and biochemical conditions; therefore, suspension-feeding bivalves must have evolved to develop a plastic trophic niche (Rossi et al. 2004, Nérot et al. 2012). Scallops may thus feed on pelagic and benthic microalgae, protozoans, microzooplankton, dissolved organic carbon and detrital organic matter (Shumway et al. 1987, Lorrain et al. 2002, Mac Donald et al. 2006, Lavaud et al. 2014, Aya & Kudo 2017). A recent study has confirmed this diversified diet (Nérot et al. 2012), yet only qualitatively.
Studies aiming at tracing the potential trophic sources of an organism use various chemical, biological, biochemical or physiological indicators of the prey items in the environment and inside the organisms. Among these indicators, stable isotopes are often used (Rossi et al. 2004, Bode et al. 2006, Marín Leal et al. 2008). Although they are able to discriminate between taxa at different trophic levels (benthic vs. planktonic microalgae for example), their low turnover is sometimes insufficient to distinguish short-term changes in the diet of the consumer. Pigments and lipids (fatty acids [FAs] and sterols), on the other hand, have long been used to characterize the class, genus and even species of microalgae (Jeffrey 1974, 1997, Pastoureaud et al. 1995, Loret et al. 2000, Louda et al. 2008, Sanz et al. 2015 for pigments; Parrish et al. 1995, Soudant et al. 1996, Bachok et al. 2003, 2009 for FAs; and Volkman 1986, Napolitano et al. 1993, Soudant et al. 1998a for sterols). These biomarkers have been extensively used in foraging ecology and food web studies. Statistical methods are in development to assess the contribution of different food sources in the diet, e.g. CHEMTAX for pigments (Mackey et al. 1996) and for FA analysis (Dijkman & Kromkamp 2006) or quantitative fatty acid signature analysis (QFASA) in FA studies (Iverson et al. 2004). However, their distribution is complex, with few un-ambiguous biomarkers. It is therefore important that other techniques are used to identify the food types present (Wright & Jeffrey 2006). In this context, combining pigment and lipid compositions of tissues could prove advantageous to assess seasonal variability of food sources (Hurtado et al. 2012).
The present study describes the temporal qualitative and quantitative variations in trophic sources consumed by P. maximus, in an innovative approach combining 3 well established trophic markers: pigments, FAs and sterols, in the digestive gland and rectum contents. The coupling of these 3 biomarkers is expected to provide a full understanding of both high-frequency and long-term patterns in the feeding ecology of the great scallop and to help trace different food sources from various origins.
3
2. Material and methods
2.1. Study area and sampling protocol
The study was conducted in the Bay of Brest (Brittany, France). Pecten maximus were dredged in the bay in November 2010 and then relocated to Lanvéoc (48° 17’ N, 4° 27’W, average depth: 12 m). From 14 March 2011 until 24 October 2011, 3 individuals were collected by SCUBA divers every 2 wk. During April and May, corresponding to a period of high phytoplankton productivity, scallops were sampled twice a week. Only animals over 3 yr old (identified by yearly shell growth rings; Mason 1957), and thus fully mature, were selected for this study. The digestive gland (DG) content, hereafter referred to as the stomach content, was collected in 2 ml Eppendorf tubes by squeezing the DG. In the same way, the content of the posterior part of the intestine (branch outside the gonad) was obtained by pressing the rectum. Stomach fraction was used as a proxy of ingested food, and rectum fraction was considered as the digested part of food that was not assimilated. A total of 2 aliquots of DG tissue were encapsulated into aluminium cups. DG content and tissue samples were frozen in liquid nitrogen and stored at −80°C until sample treatment.
Seawater was also sampled using a 5 l Niskin bottle at 2 m below the surface during the entire study period. Sampling of the water−sediment interface was carried out by SCUBA divers from early May, using a 450 ml syringe to collect water at approximately 3 cm above the sea bottom. Sampling was performed as far as possible at medium tidal coefficient and around mid-tide. Phytoplankton species composition and abundance were determined in samples both in the water column and at the water−sediment interface. A volume of 250 ml of each sample was fixed with acetic Lugol’s solution. Quantitative and qualitative analyses were carried out from settled cells using an inverted phase microscope. Vacuum filtration of seawater was conducted on GF/F filters (0.7 μm) previously heated for 6 h at 450°C. Between 500 ml and 1.5 l of sub-surface seawater were filtered at each sampling time. The volume of filtered bottom water ranged from 50 to 150 ml, depending on filter clogging. Two filtrations were carried out for water column samples and 2 for water−sediment interface samples, for pigment and lipid analysis. Filtrates were stored in sealed aluminium folds at −80°C until sample treatment. Simultaneous analyses of pigment composition of the seston from the water column and from the water−sediment interface were conducted whenever possible as they were not available for the first 2 mo of the study. Nevertheless, the occurrence, timing and intensity of spring phytoplankton at the bottom were well documented in a study carried out at the same time and the same location (Chatterjee et al. 2013). Pigment and lipid composition of all samples (DG content, DG tissue of scallops and filtrates) were analyzed as described below.
2.2. Pigment analysis
The procedure used to identify and quantify pigments in the filters and in the DG contents was the method described by Claustre & Ras (2009). The extraction of pigments was achieved from 200 μl of stomach contents, 50 μg of rectum contents and seawater filtrates from the 2 depths, in 100% methanol enriched with vitamin E acetate (used as internal standard; Sigma-Aldrich). To improve extraction yield, samples were disrupted by sonication using an S-4000 sonicator (Misonix) and stored at −20°C.
4 Sonication was repeated after 2 and 4 h of extraction. Samples were centrifuged for 10 min at 3000 rpm (805 × g; 4°C) and passed through 13 mm syringe filters (Puradisc, 0.2 μm, PTFE; Fischer). Pigment analyses were carried out on a complete Agilent Technologies 1200 series HPLC system, equipped with a ZORBAX Eclipse XDB-C8 silica column (3 × 150 mm, 3.5 mm particle size) and a diode array detector, which permits automatic pigment identification based on absorption spectra. The elution was run at a flow rate of 0.55 ml min−1 using solvent A (tetrabutylammonium acetate and methanol, 30:70 v/v) and solvent B (methanol) in the following elution procedure (min, solv. A, solv. B): (0, 90, 10), (22, 5, 95), (27, 5, 95), (28, 90, 10) and (33, 90, 10). Pigment optical densities were monitored at 450 nm (chloropigments and carotenoids) and at 667 nm (chlorophyll a [chl a] and derived pigments), and automatically compared to the retention times of 15 pigment standards (DHI and Sigma-Aldrich) previously calibrated. The injection precision of the method was estimated at 0.4%, and the effective limits of quantification for most pigments were rather low: 2.89 10−5 μg ml−1 for chl a and 3.98 10−5 μg ml−1 for carotenoids. Chemstation software was used for verification and eventual correction of the peak
integrations in each chromatogram. 2.3. Lipid analysis
2.3.1. Chemicals
HPLC-grade solvents were purchased from VWR International. Boron trifluoride (BF3; 14% by weight in methanol), tricosanoic acid (C23:0), cholestane and 37-component fatty acid methyl ester (FAME) mix were obtained from Sigma-Aldrich. Silica gel 60 (63–230 μm mesh) was purchased from Merck. Gas chromatography (GC) capillary column was a DBWAX (30 m × 0.25 mm i.d., 0.25 μm thickness) for FAME analysis and a Rtx65 (15 m × 0.25 mm i.d., 0.25 μm thickness) for sterol analysis and were obtained from Agilent and Restek, respectively.
2.3.2. Lipid extraction
Lipid extraction was conducted by resuspension of the filtrates or of 200 mg aliquots of DG previously grounded by ball milling under liquid nitrogen. Samples were then put in glass tubes containing 6 ml of chloroform-methanol (2:1, v/v) and stored at −20°C before analysis.
2.3.3. Separation
After centrifugation (2 min, 1000 rpm), lipid analyses were carried out on 1 ml of DG lipid extracts and on 5 ml of filtrate lipid extracts (due to the small amount of material in the seawater when compared to the DG). Lipid extracts were then evaporated to dryness under nitrogen, recovered with 3 chloroform-methanol (98:2, v/v) washings of 500 μl each and deposited at the top of a silica gel microcolumn (Pasteur pipette of 5 mm i.d., plugged with glass wool and filled with silica gel 60, both previously heated for 6 h at 450°C and deactivated with 6% water by weight). Neutral lipids (NL), including triglycerides, free FAs and sterols, were eluted with 10 ml of chloroform-methanol (98:2 v/v) and polar lipids (PL), containing glycolipids and phospholipids, were eluted with 20 ml of methanol; both were collected in 20 ml vials.
5
2.3.4. Transesterification
After evaporation to dryness under nitrogen, PL and NL fractions were recovered and transferred in 8 ml vials with 3 chloroform-methanol (98:2, v/v) washings of 1 ml each. The NL fraction was then equally divided into 2 vials. All of the PL fraction and half of NL fraction were dedicated to FA analysis; the other part of the NL fraction was dedicated to sterol analysis. As internal standards, 2.3 μg of C23:0 was added to the FA vials and 2.5 μg of cholestane to the sterols vials. After evaporation to dryness under nitrogen, FAMEs were obtained by adding 800 μl of methanol-BF3 to FA vials, vortexing and heating for 10 min at 100°C. For sterol analysis, 2 ml of a sodium methoxyde solution (NaOH, 27 μg μl−1 in methanol) was added to the sterol vials, which were maintained under agitation for 90 min at room temperature. Before GC analysis, organic phases containing FAME or sterols were washed 3 times with 1 ml of distilled water and 800 μl of hexane and centrifuged (1 min at 1000 rpm) before eliminating the aqueous phase each time. Finally, organic phases were transferred into tapering vials and stored at −20°C.
2.3.5. GC analysis
FAMEs were analyzed in an Agilent 6890 gas chromatograph equipped with an on-column injector and a flame-ionization detector, with hydrogen as a carrier gas. They were identified by their retention times with reference to those of a standard 37-component FAME mix and other known standard mixtures from marine bivalves (Soudant et al. 1995) and designated following the formula C:X(n-Y) where C is the number of carbon atoms, X is the number of double bonds and Y is the position of the first double bond counted from the CH terminal. The sterols were separated by GC, in a Chrompack 9002 equipped with an on-column injector and a flame-ionization detector, with hydrogen as a carrier gas. Sterols were identified by comparison of their retention time with standards as described in Soudant et al. (1998a).
2.4. Data analysis
As chl a is present in all marine algae species and because the goal of this study was to identify specific patterns in the dynamics of several algae classes, chl a was removed from the total amount of pigments; each pigment quantity was therefore expressed as its contribution to the total amount of pigment without chl a. This was applied to all samples (seawater and digestive tract contents).
Statistical analyses were carried out to determine significant temporal variations in the different food proxies, analyzed using R v.3.3.2 (R Core Team 2013). Potential correlations between pigment concentrations in the 2 water compartments and the stomach contents were investigated through simple linear regressions. A canonical correspondence analysis (CCA) integrating all food proxy variables in the environment (phytoplankton counts and pigments in the water column and at the water−sediment interface) and the proportion of pigments, FAs and sterols in the stomach contents over time was performed using the package ‘vegan’ (Oksanen et al. 2017). Degraded pigments (pheophytin and pheophorbide) as well as pigments, FAs and sterols whose proportions averaged less than 0.5% were excluded. Because no water samples were available at the water−sediment interface until May, the CCA was performed for sampling points after 2 May. First trials included all variables at the same time, and were not successful in identifying clear relationships, likely due to the elevated number of variables. Therefore 2 separate analyses were performed, both using phytoplankton counts
6 as variables and time series of pigment proportions in the water and the stomach contents or lipid proportions in the DG tissues.
3. Results
3.1. Seston pigment concentration and composition
A general pattern of phytoplankton abundance during the study period can be seen in Fig. 1, showing the dynamics of chl a concentration in the seston from the water column as well as at the water−sediment interface. The first sign of primary production recovery after winter in the water column occurred at the end of March, but the first significant phytoplankton bloom was observed at the water−sediment interface in mid-April. Microalgae grew in the water column in early May. In June, another bloom occurred in the water column while pigment concentrations in the bottom water de creased. During the summer, few blooms were recorded in the water column, while low pigment amounts were found at the bottom. In autumn, phytoplankton biomass increased in both water compartments. Pigment concentration in the water column seemed to decline rapidly in August, while bottom production reached high levels in September, comparable to those observed in spring.
Fig. 1. Chl a concentration in the water column (solid line, black squares) and in the water−sediment interface (dashed line,
black dots) in the Bay of Brest, France, in 2011. Additional data for chl a concentration (grey area, right axis) at the sea floor are from Chatterjee et al. (2013)
Detailed phytoplankton composition in the water column and the water−sediment interface are presented in Table 1. Although identification has been performed to species level, data are presented by microalgae classes. The water from the sea bottom was mainly composed of diatoms (Bacillariophyceae), of which the highest abundance was recorded in early March. In the water column, the first observed bloom occurred in late March and was mainly composed of Dinophyceae and Cryptophyceae, with 276 800 and 2 810 000 cells l−1 respectively (mostly Heterocapsa triquetra and
Gyrodinium flagellare). A synchronous elevation of alloxanthin and peridinin was observed in the water
column (Fig. 2b,e). The pigment composition of seston in late April showed increasing proportions of 19’-hexanoyloxyfucoxanthin (19’HF) and 19’-butanoyloxy-fucoxanthine (19’BF), up to 15 and 10% respectively in the water column (Fig. 2d,f). At the same time, the highest abundances of
7 Prymnesiophyceae and Chrysophyceae were recorded (Table 1). Diatoms were highly abundant from the beginning but showed a surge in early May (mostly Chaetoceros sp., Cerataulina pelagica and
Dactiliosolen fragilissima in the water column, and Navicula sp. and Fragillaria sp. at the
water−sediment interface), accompanied by peaks of fucoxanthin in both water compartments (Fig. 2a), contributing 77% of the total pigments. Almost all pigment proportions increased during this bloom, except for peridinin, which only showed several short peaks (around 10% of the total pigment) during the study period. The second major microalgae bloom was mostly due to diatoms, and occurred in early June with up to 2 747 400 cells l−1. A sharp increase of fucoxanthin concentration was again observed in the water. From then on, fucoxanthin concentrations remained at lower levels both in the water column and at the water−sediment interface, whereas the proportion of chlorophyll b (chl b) started to increase from about 10% to more than 20% in the water column in June (Fig. 2e). During this period, only trace amounts of green microalgae (Chlorophyceae) were observed. The same occurred at the bottom from July, also accompanied by a similar increase of peridinin and zeaxanthin concentrations. Alloxanthin and 19’HF accounted for about 5% of the total pigments from mid-summer until the end of the study. High numbers of Cryptophyceae and Prymnesiophyceae were observed during these last months. Finally, in October, a last bloom of diatoms was recorded at the water−sediment interface while seston pigment composition was dominated by fucoxanthin (up to 40%) and chl b (50%). Degradation pigments such as pheophorbide-a and pheophytin-a were detected at very low amounts in the water during the whole study period. Other pigments were detected in this study (probably degraded forms of the main pigments already described) but were not taken into account as we did not have the specific standards for their identification at our disposal.
Table 1. Phytoplankton composition of the water column (2 m under the surface) and at the water–sediment interface (3 cm
above bottom) in the Bay of Brest in 2011 (in no. of cells l-1) (table continued on next page)
Date (dd/mo) Bacillario-phyceae Dino-phyceae Chloro-phyceae Chryso-phyceae Crypto-phyceae Cyano-phyceae Prymnesio-phyceae Water column 10/03 26 950 23 300 0 0 0 0 25 750 17/03 21 260 53 130 0 5 000 236 100 0 2 500 25/03 11 370 276 800 0 0 2 810 000 0 16 100 31/03 138 635 24 920 0 2 700 122 000 0 0 08/04 184 940 35 740 0 0 171 000 0 600 14/04 17 630 18 750 0 16 900 143 200 0 15 800 23/04 116 560 115 060 0 12 050 211 000 0 91 530 29/04 601 820 48 960 0 75 400 27 630 0 32 950 05/05 956 290 54 800 7 780 9 540 105 500 0 47 480 13/05 640 910 76 891 0 0 291 060 0 0 23/05 7 225 124 000 47 730 2 500 445 450 0 7 500 30/05 91 220 10 330 0 0 13 190 0 0 06/06 2 747 400 32 780 0 0 55 260 0 13 190 13/06 232 060 86 780 0 4 900 82 900 0 0 21/06 28 230 46 120 0 1 900 231 100 0 5 200 30/06 789 730 55 720 9 100 1 000 226 080 0 40 250 08/07 126 310 18 810 0 0 30 140 0 15 500 12/07 627 150 79 980 0 0 105 500 2 080 12 560 21/07 19 120 90 930 0 0 288 900 0 12 640 28/07 158 690 4 590 0 0 37 680 0 0
8 Date (dd/mo) Bacillario-phyceae Dino-phyceae Chloro-phyceae Chryso-phyceae Crypto-phyceae Cyano-phyceae Prymnesio-phyceae 06/08 170 770 38 860 0 0 145 700 0 21 700 11/08 23 520 76 810 0 0 158 260 0 0 19/08 18 920 52 860 0 0 384 340 0 1 000 26/08 221 600 6 360 0 0 60 290 0 0 04/09 1 520 200 0 0 11 000 0 0 10/09 5 140 23 540 0 0 263 760 0 0 16/09 7 840 36 700 0 0 146 850 0 4 500 24/09 137 700 15 460 0 0 133 140 0 0 03/10 155 300 95 730 0 5 000 562 690 0 55 260 10/10 30 400 63 880 0 4 340 183 270 0 14 100 17/10 1 000 34 280 0 0 450 210 0 67 960 23/10 1 160 7 820 0 0 77 870 0 15 070 Water-sediment interface 10/03 3 042 490 0 0 0 0 0 0 21/03 0 40 0 0 0 0 0 24/03 1 080 0 0 2 100 75 500 0 0 28/03 127 110 20 0 0 0 0 0 31/03 63 540 240 0 0 10 100 0 0 04/04 59 190 280 0 0 4 050 0 0 07/04 23 520 0 0 0 4 000 0 0 11/04 124 140 4 110 0 0 8 050 0 0 14/04 19 170 80 0 0 0 0 0 18/04 74 760 120 0 0 1 000 0 0 21/04 113 050 20 500 0 4 000 217 510 0 0 26/04 34 910 2 280 0 0 12 100 0 0 28/04 89 860 40 0 0 33 720 0 0 02/05 75 400 600 0 0 0 0 0 09/05 301 860 600 0 0 0 0 0 12/05 176 870 1 240 0 0 0 0 0 16/05 250 460 12 780 0 0 16 900 0 0 19/05 1 760 400 0 0 0 0 0 23/05 69 020 800 0 0 2 000 0 0 26/05 600 2 100 0 0 0 0 0 30/05 76 085 1 280 0 0 0 0 0 06/06 720 1 280 0 0 0 0 0 14/06 40 2 280 0 0 1 000 0 0 20/06 23 460 10 300 0 0 10 100 0 0 27/06 180 20 0 0 500 0 0 19/07 0 0 0 0 0 0 0 27/07 0 0 0 0 0 0 0 01/08 3 120 40 0 0 0 0 0 09/08 5 800 100 0 0 0 0 0 16/08 3 480 440 0 0 12 100 0 0 22/08 9 600 200 0 0 0 0 0 30/08 61 500 0 0 0 0 0 0 05/09 2 800 0 0 0 0 0 0 13/09 2 000 0 0 0 0 0 0 19/09 57 550 0 0 90 630 0 0 0 26/09 49 060 0 0 20 130 0 0 0 03/10 51 620 6 040 0 20 140 10 000 0 0 10/10 889 770 3 200 2 000 6 050 0 0 0 17/10 78 410 4 500 0 2 000 0 0 0 24/10 2 000 2 000 0 0 0 0 0
9 Fig. 2. Proportions of (a) fucoxanthin, (b) peridinin, (c) chl b, (d) 19'HF, (e) alloxanthin and (f) 19'BF in the water column (light
grey area) and at the water–sediment interface (dark grey area) and in the stomach (dashed dark line, black dots) and the rectum content (solid dark line, black squares) of Pecten maximus in the Bay of Brest in 2011. Chl a quantity was removed from
total pigment amount before calculating the proportion of each pigment. Standard deviations are indicated by vertical grey lines
3.2. Pigment composition of the digestive tract contents
Over the duration of the study, the quantity of pigments measured in the stomach content seemed to match the quantity found in the seston only during certain periods of the study (Fig. 3). This is reflected by a weak correlation between the pigment concentration in the stomach content and the pigment concentration in the seston from both the water column and the water−sediment interface (𝑟2 = 0.3074 and 𝑟2 = 0.1322 respectively; 𝑝 < 0.01) when considering the whole sampling period.
However, these correlations are greatly improved when the time series is split into 2 periods (spring and summer/fall). A very strong correlation between the concentration in the stomach contents and in the water column was found from June until the end of the study (𝑟2 = 0.9394, 𝑝 < 0.01). On the other hand, the correlation between the concentration in the stomach contents and in the water−sediment interface was stronger before June (𝑟2= 0.4943, 𝑝 < 0.01).
10 Fig. 3. (a,b) Total quantity of pigment, including chl a, measured in the stomach content of Pecten maximus (dark line in [a,b]),
in the water column (light grey area in [a]), and at the water–sediment interface (grey area in [b]) in the Bay of Brest in 2011. Standard deviations are indicated by vertical grey lines. Data from the water–sediment interface from the study of Chatterjee et
al. (2013) are also plotted (dark grey area in [b]) to complete the present data set
Fucoxanthin was, after chl a, the major pigment found both in stomach and rectum (up to 55 and 50% respectively; Table 2). Peridinin had a maximum occurrence of 43% in the stomach and 28% in the rectum. The dynamics of these 2 predominant pigments varied in an opposite manner, as shown in Fig. 4. Fucoxanthin in the stomach fluctuated strongly during spring (Fig. 2a), with sharp increases from 10−20% up to 50−55% in late April, mid-May, late May and early June. The minimum was observed on 30 May (11.4%) and the maximum on 28 April at 53.6%. As observed in the water, a significant increase was registered in autumn. The proportion of fucoxanthin in the rectum was very similar to what was observed in the stomach, as shown by a linear regression coefficient of 𝑟2 = 0.82 (𝑝 < 0.01). Peridinin showed a similar pattern, with a fluctuating spring period followed by low proportions in early summer and medium levels until autumn, when it dropped to its minimum (2.4%) on 3 October. The maximum was reached on 2 May at 42.3%. Compared to fucoxanthin, the linear regression between the proportion of peridinin in the rectum and in the stomach was less significant (𝑟2= 0.52, 𝑝 < 0.01). For instance, at the end of May as well as in July and August, the discrepancy between the two compartments was 20% between the entrance and the exit of the digestive tract (Fig. 2b).
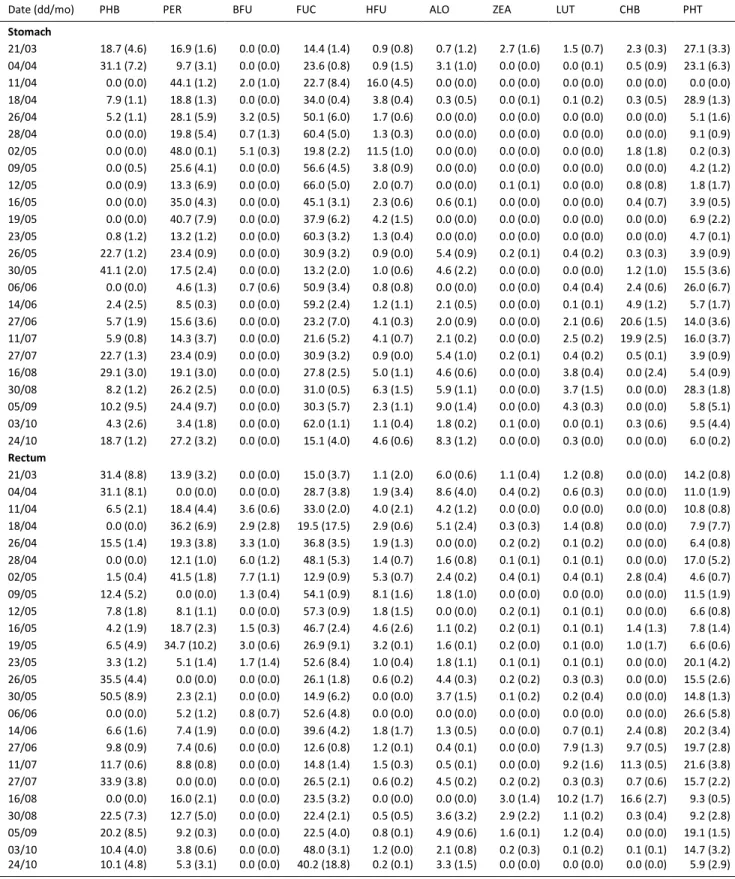
11 Table 2. Pigments proportion expressed as pigment percentage of total in the stomach and the rectum of Pecten maximus in
the Bay of Brest in 2011. Chl a quantity was removed from total pigment amount before calculating the proportion of each pigment. PHB: pheophorbide-a, PER: peridinin, BFU: 19'BF, FUC: fucoxanthin, HFU: 19'HF, ALO: alloxanthin, ZEA: zeaxanthin,
LUT: lutein, CHB: chlorophyll-b, PHT: pheophytin-a. Standard deviations are in brackets
Date (dd/mo) PHB PER BFU FUC HFU ALO ZEA LUT CHB PHT
Stomach 21/03 18.7 (4.6) 16.9 (1.6) 0.0 (0.0) 14.4 (1.4) 0.9 (0.8) 0.7 (1.2) 2.7 (1.6) 1.5 (0.7) 2.3 (0.3) 27.1 (3.3) 04/04 31.1 (7.2) 9.7 (3.1) 0.0 (0.0) 23.6 (0.8) 0.9 (1.5) 3.1 (1.0) 0.0 (0.0) 0.0 (0.1) 0.5 (0.9) 23.1 (6.3) 11/04 0.0 (0.0) 44.1 (1.2) 2.0 (1.0) 22.7 (8.4) 16.0 (4.5) 0.0 (0.0) 0.0 (0.0) 0.0 (0.0) 0.0 (0.0) 0.0 (0.0) 18/04 7.9 (1.1) 18.8 (1.3) 0.0 (0.0) 34.0 (0.4) 3.8 (0.4) 0.3 (0.5) 0.0 (0.1) 0.1 (0.2) 0.3 (0.5) 28.9 (1.3) 26/04 5.2 (1.1) 28.1 (5.9) 3.2 (0.5) 50.1 (6.0) 1.7 (0.6) 0.0 (0.0) 0.0 (0.0) 0.0 (0.0) 0.0 (0.0) 5.1 (1.6) 28/04 0.0 (0.0) 19.8 (5.4) 0.7 (1.3) 60.4 (5.0) 1.3 (0.3) 0.0 (0.0) 0.0 (0.0) 0.0 (0.0) 0.0 (0.0) 9.1 (0.9) 02/05 0.0 (0.0) 48.0 (0.1) 5.1 (0.3) 19.8 (2.2) 11.5 (1.0) 0.0 (0.0) 0.0 (0.0) 0.0 (0.0) 1.8 (1.8) 0.2 (0.3) 09/05 0.0 (0.5) 25.6 (4.1) 0.0 (0.0) 56.6 (4.5) 3.8 (0.9) 0.0 (0.0) 0.0 (0.0) 0.0 (0.0) 0.0 (0.0) 4.2 (1.2) 12/05 0.0 (0.9) 13.3 (6.9) 0.0 (0.0) 66.0 (5.0) 2.0 (0.7) 0.0 (0.0) 0.1 (0.1) 0.0 (0.0) 0.8 (0.8) 1.8 (1.7) 16/05 0.0 (0.0) 35.0 (4.3) 0.0 (0.0) 45.1 (3.1) 2.3 (0.6) 0.6 (0.1) 0.0 (0.0) 0.0 (0.0) 0.4 (0.7) 3.9 (0.5) 19/05 0.0 (0.0) 40.7 (7.9) 0.0 (0.0) 37.9 (6.2) 4.2 (1.5) 0.0 (0.0) 0.0 (0.0) 0.0 (0.0) 0.0 (0.0) 6.9 (2.2) 23/05 0.8 (1.2) 13.2 (1.2) 0.0 (0.0) 60.3 (3.2) 1.3 (0.4) 0.0 (0.0) 0.0 (0.0) 0.0 (0.0) 0.0 (0.0) 4.7 (0.1) 26/05 22.7 (1.2) 23.4 (0.9) 0.0 (0.0) 30.9 (3.2) 0.9 (0.0) 5.4 (0.9) 0.2 (0.1) 0.4 (0.2) 0.3 (0.3) 3.9 (0.9) 30/05 41.1 (2.0) 17.5 (2.4) 0.0 (0.0) 13.2 (2.0) 1.0 (0.6) 4.6 (2.2) 0.0 (0.0) 0.0 (0.0) 1.2 (1.0) 15.5 (3.6) 06/06 0.0 (0.0) 4.6 (1.3) 0.7 (0.6) 50.9 (3.4) 0.8 (0.8) 0.0 (0.0) 0.0 (0.0) 0.4 (0.4) 2.4 (0.6) 26.0 (6.7) 14/06 2.4 (2.5) 8.5 (0.3) 0.0 (0.0) 59.2 (2.4) 1.2 (1.1) 2.1 (0.5) 0.0 (0.0) 0.1 (0.1) 4.9 (1.2) 5.7 (1.7) 27/06 5.7 (1.9) 15.6 (3.6) 0.0 (0.0) 23.2 (7.0) 4.1 (0.3) 2.0 (0.9) 0.0 (0.0) 2.1 (0.6) 20.6 (1.5) 14.0 (3.6) 11/07 5.9 (0.8) 14.3 (3.7) 0.0 (0.0) 21.6 (5.2) 4.1 (0.7) 2.1 (0.2) 0.0 (0.0) 2.5 (0.2) 19.9 (2.5) 16.0 (3.7) 27/07 22.7 (1.3) 23.4 (0.9) 0.0 (0.0) 30.9 (3.2) 0.9 (0.0) 5.4 (1.0) 0.2 (0.1) 0.4 (0.2) 0.5 (0.1) 3.9 (0.9) 16/08 29.1 (3.0) 19.1 (3.0) 0.0 (0.0) 27.8 (2.5) 5.0 (1.1) 4.6 (0.6) 0.0 (0.0) 3.8 (0.4) 0.0 (2.4) 5.4 (0.9) 30/08 8.2 (1.2) 26.2 (2.5) 0.0 (0.0) 31.0 (0.5) 6.3 (1.5) 5.9 (1.1) 0.0 (0.0) 3.7 (1.5) 0.0 (0.0) 28.3 (1.8) 05/09 10.2 (9.5) 24.4 (9.7) 0.0 (0.0) 30.3 (5.7) 2.3 (1.1) 9.0 (1.4) 0.0 (0.0) 4.3 (0.3) 0.0 (0.0) 5.8 (5.1) 03/10 4.3 (2.6) 3.4 (1.8) 0.0 (0.0) 62.0 (1.1) 1.1 (0.4) 1.8 (0.2) 0.1 (0.0) 0.0 (0.1) 0.3 (0.6) 9.5 (4.4) 24/10 18.7 (1.2) 27.2 (3.2) 0.0 (0.0) 15.1 (4.0) 4.6 (0.6) 8.3 (1.2) 0.0 (0.0) 0.3 (0.0) 0.0 (0.0) 6.0 (0.2) Rectum 21/03 31.4 (8.8) 13.9 (3.2) 0.0 (0.0) 15.0 (3.7) 1.1 (2.0) 6.0 (0.6) 1.1 (0.4) 1.2 (0.8) 0.0 (0.0) 14.2 (0.8) 04/04 31.1 (8.1) 0.0 (0.0) 0.0 (0.0) 28.7 (3.8) 1.9 (3.4) 8.6 (4.0) 0.4 (0.2) 0.6 (0.3) 0.0 (0.0) 11.0 (1.9) 11/04 6.5 (2.1) 18.4 (4.4) 3.6 (0.6) 33.0 (2.0) 4.0 (2.1) 4.2 (1.2) 0.0 (0.0) 0.0 (0.0) 0.0 (0.0) 10.8 (0.8) 18/04 0.0 (0.0) 36.2 (6.9) 2.9 (2.8) 19.5 (17.5) 2.9 (0.6) 5.1 (2.4) 0.3 (0.3) 1.4 (0.8) 0.0 (0.0) 7.9 (7.7) 26/04 15.5 (1.4) 19.3 (3.8) 3.3 (1.0) 36.8 (3.5) 1.9 (1.3) 0.0 (0.0) 0.2 (0.2) 0.1 (0.2) 0.0 (0.0) 6.4 (0.8) 28/04 0.0 (0.0) 12.1 (1.0) 6.0 (1.2) 48.1 (5.3) 1.4 (0.7) 1.6 (0.8) 0.1 (0.1) 0.1 (0.1) 0.0 (0.0) 17.0 (5.2) 02/05 1.5 (0.4) 41.5 (1.8) 7.7 (1.1) 12.9 (0.9) 5.3 (0.7) 2.4 (0.2) 0.4 (0.1) 0.4 (0.1) 2.8 (0.4) 4.6 (0.7) 09/05 12.4 (5.2) 0.0 (0.0) 1.3 (0.4) 54.1 (0.9) 8.1 (1.6) 1.8 (1.0) 0.0 (0.0) 0.0 (0.0) 0.0 (0.0) 11.5 (1.9) 12/05 7.8 (1.8) 8.1 (1.1) 0.0 (0.0) 57.3 (0.9) 1.8 (1.5) 0.0 (0.0) 0.2 (0.1) 0.1 (0.1) 0.0 (0.0) 6.6 (0.8) 16/05 4.2 (1.9) 18.7 (2.3) 1.5 (0.3) 46.7 (2.4) 4.6 (2.6) 1.1 (0.2) 0.2 (0.1) 0.1 (0.1) 1.4 (1.3) 7.8 (1.4) 19/05 6.5 (4.9) 34.7 (10.2) 3.0 (0.6) 26.9 (9.1) 3.2 (0.1) 1.6 (0.1) 0.2 (0.0) 0.1 (0.0) 1.0 (1.7) 6.6 (0.6) 23/05 3.3 (1.2) 5.1 (1.4) 1.7 (1.4) 52.6 (8.4) 1.0 (0.4) 1.8 (1.1) 0.1 (0.1) 0.1 (0.1) 0.0 (0.0) 20.1 (4.2) 26/05 35.5 (4.4) 0.0 (0.0) 0.0 (0.0) 26.1 (1.8) 0.6 (0.2) 4.4 (0.3) 0.2 (0.2) 0.3 (0.3) 0.0 (0.0) 15.5 (2.6) 30/05 50.5 (8.9) 2.3 (2.1) 0.0 (0.0) 14.9 (6.2) 0.0 (0.0) 3.7 (1.5) 0.1 (0.2) 0.2 (0.4) 0.0 (0.0) 14.8 (1.3) 06/06 0.0 (0.0) 5.2 (1.2) 0.8 (0.7) 52.6 (4.8) 0.0 (0.0) 0.0 (0.0) 0.0 (0.0) 0.0 (0.0) 0.0 (0.0) 26.6 (5.8) 14/06 6.6 (1.6) 7.4 (1.9) 0.0 (0.0) 39.6 (4.2) 1.8 (1.7) 1.3 (0.5) 0.0 (0.0) 0.7 (0.1) 2.4 (0.8) 20.2 (3.4) 27/06 9.8 (0.9) 7.4 (0.6) 0.0 (0.0) 12.6 (0.8) 1.2 (0.1) 0.4 (0.1) 0.0 (0.0) 7.9 (1.3) 9.7 (0.5) 19.7 (2.8) 11/07 11.7 (0.6) 8.8 (0.8) 0.0 (0.0) 14.8 (1.4) 1.5 (0.3) 0.5 (0.1) 0.0 (0.0) 9.2 (1.6) 11.3 (0.5) 21.6 (3.8) 27/07 33.9 (3.8) 0.0 (0.0) 0.0 (0.0) 26.5 (2.1) 0.6 (0.2) 4.5 (0.2) 0.2 (0.2) 0.3 (0.3) 0.7 (0.6) 15.7 (2.2) 16/08 0.0 (0.0) 16.0 (2.1) 0.0 (0.0) 23.5 (3.2) 0.0 (0.0) 0.0 (0.0) 3.0 (1.4) 10.2 (1.7) 16.6 (2.7) 9.3 (0.5) 30/08 22.5 (7.3) 12.7 (5.0) 0.0 (0.0) 22.4 (2.1) 0.5 (0.5) 3.6 (3.2) 2.9 (2.2) 1.1 (0.2) 0.3 (0.4) 9.2 (2.8) 05/09 20.2 (8.5) 9.2 (0.3) 0.0 (0.0) 22.5 (4.0) 0.8 (0.1) 4.9 (0.6) 1.6 (0.1) 1.2 (0.4) 0.0 (0.0) 19.1 (1.5) 03/10 10.4 (4.0) 3.8 (0.6) 0.0 (0.0) 48.0 (3.1) 1.2 (0.0) 2.1 (0.8) 0.2 (0.3) 0.1 (0.2) 0.1 (0.1) 14.7 (3.2) 24/10 10.1 (4.8) 5.3 (3.1) 0.0 (0.0) 40.2 (18.8) 0.2 (0.1) 3.3 (1.5) 0.0 (0.0) 0.0 (0.0) 0.0 (0.0) 5.9 (2.9)
12 Fig. 4. Proportions of fucoxanthin (dots, dashed line) and peridinin (squares, solid line) in the stomach content of Pecten maximus in the Bay of Brest in 2011. Chl a quantity was removed from total pigment amount before calculating the proportion
of each other pigment. Standard deviations are indicated by vertical grey lines
The occurrence of chl b was not observed in the digestive tract of the scallops before an important peak of 13.5% during June and July and a shorter one in mid-August (12%; Fig. 2c). In the rectum, proportions of chl b were found to be lower during the first increase (10.5%) and higher during the second peak (16%). Nevertheless, the correlation between the 2 compartments was rather elevated (𝑟2= 0.76). Two smaller 19'HF peaks of 16 and 11% were recorded in the stomach on 11 April and 2 May, respectively; another increase was reported during August, although this only reached 5% (Fig. 2d). During the first peak and the late summer increase, the proportion of this pigment in the rectum did not change, whereas it increased up to 8% just after the second spring peak. A higher proportion of alloxanthin was present in the rectum than in the stomach until mid-May (Fig. 2e). The proportion of this pigment then increased up to 5% in the stomach in late May. From June to October a regular increase was registered in the digestive tract of Pecten maximus. Finally, several events of increased proportions of 19’BF up to 5% were observed in the stomach as well as in the rectum during April and the first week of May, whereas only one significant peak occurred in the seawater at the end of April (Fig. 2f).
Degraded pigments, namely pheophorbide-a and pheophytin-a, were also observed in both stomach and rectum (Fig. 5). High proportions (17 to 24%) of these 2 pigments were already present in the stomach at the beginning of the study and dropped down to zero on 11 April. A brief increase of pheophytin-a to 24% was noted on 18 April. A peak of degraded pigment was reached between 26 May and 6 June and a second event occurred between 27 July and 30 August. In the rectum, the level of degraded pigments very closely followed the pattern described for the stomach. Pheophytin-a, however, fluctuated less from June and varied between 6 and 16%. Moreover, when compared to the total pigment found in the stomach (Fig. 5b), the proportions of degraded pigments seemed rather disconnected from the periods of increased ingestion. During the 4 periods of high total pigment concentration in the digestive tract, proportions of degraded pigments did not show any strong dynamics. Conversely, the 3 periods of high levels of degraded pigments identified in the gut of the scallops occurred after periods of low feeding activity and just before the ingestion peaks.
13 Figure 5. Total pigment concentration, including chlorophyll-a, in the stomach content of P. maximus (grey area, right axis) and
proportions of (a) pheophorbide-a and (b) pheophytin-a in the stomach content (solid line, full squares) and the rectum content (dashed lines, full dots) of P. maximus in the Bay of Brest in 2011. Standard deviations are indicated by vertical grey lines.
3.3. Fatty acid and sterol composition of the digestive gland
First of all, the GC analysis of FAs and sterols in the seawater filters revealed extremely low quantities in the samples. Only the most prominent FAs could be detected, showing only small peaks which could not be accurately quantified. Several trials to concentrate the samples did not solve this detection threshold issue. Nevertheless, the absence of usable FA and sterol data for water samples should not be crippling for the study, as FA markers of microalgae classes observed here are well established in the literature. Moreover, data on quantitative microalgae compositions from optical and/or pigment analyses should constitute a sufficiently robust base for deciphering scallop FA profiles (see ‘Discussion’ for details).
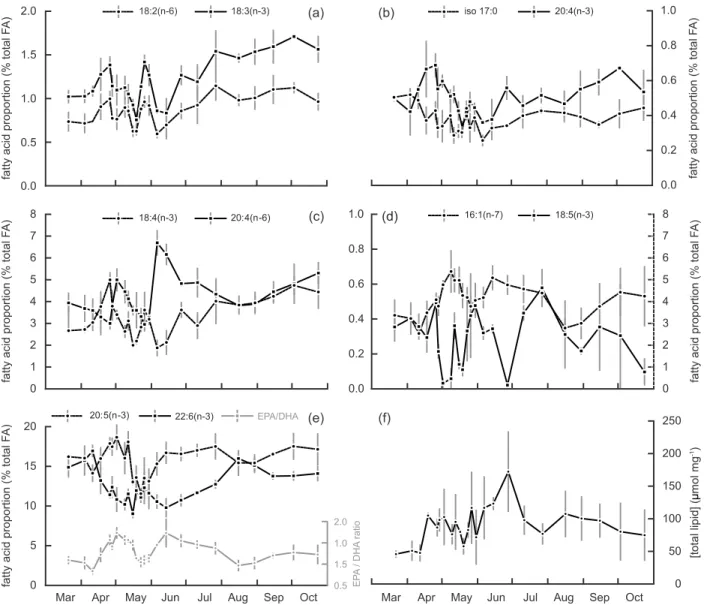
The total amount of FAs and sterols in the DG of P. maximus showed particularly high variations during spring (Fig. 6f). Total FA content of the DG increased from 45 to 75 μmol mg−1 between the start and end of the study, with the highest value of 172 μmol mg−1 reached in mid-June (Fig. 6f). The main FAs found in the polar fraction were 20:5(n-3) (eicosapentaenoic acid; EPA), 22:6(n-3) (docosahexaenoic acid; DHA) and 16:0, each accounting for about 15% of total FAs (Table 3), 18:4(n-3), 20:4(n-6), around 5% and to a lesser extent 18:2(n-6), 18:3(n-3), 18:1(n-9), 20:4(n-3) and iso17:0, which accounted for less than 2%. In the neutral fraction, 20:5(n-3) was the main FA (25%; Table 4), 16:0 accounted for about 15%, 14:0, 16:1(n-7) and 22:6(n-3) ranged between 6 and 12%, 20:4(n-6) was found around 3.5% and
14 18:1(n-9), 18:3(n-3), 18:4(n-3) and 18:5(n-3) each accounted for about 2%. Within the polar fraction, the ratio between EPA and DHA showed 2 periods of increase in late April/early May and at the beginning of June (Fig. 6e). Lower levels were observed at the beginning of April, at the end of May and in August. An analogous tendency was observed when comparing the proportions of 16:1(n-7) and 18:5(n-3) (in the neutral fraction). A peak of 18:4(n-3) was observed at the end of April, its proportion reaching 5% of total FA and increasing regularly from June to October (Fig. 6c). Similar patterns were observed for 18:2(n-6) and 18:3(n-3), which also exhibited an important increase of twice their initial percentage in late May (Fig. 6a). The proportion of 20:4(n-3) only varied between 0.3 and 0.7%, but presented 2 important peaks in April and in late May and gradually increased throughout the summer until the end
Fig. 6. Proportions of 10 major fatty acids in the digestive gland of Pecten maximus (expressed as fatty acid molar percentage of
total) in the Bay of Brest in 2011. (a) 18:2(n-6) (dashed line, black dots), 18:3(n-3) (solid line, black squares) in polar lipids; (b) iso17:0 (dashed line, black dots) and 20:4(n-3) (solid line, black squares) in polar lipids; (c) 18:4(n-3) (solid line, black dots) and 20:4(n-6) (solid line, black squares) in polar lipids; (d) 16:1(n-7) (dashed line, black dots) in polar lipids and 18:5(n-3) (solid line, black squares) in neutral lipids; (e): 20:5(n-3) (dashed line, black dots), 22:6(n-3) (solid line, black squares) in polar lipids and their ratio (grey line, grey dots): 20:5(n-3)(EPA):22:6(n-3)(DHA); (f) total fatty acid concentration (polar plus neutral fractions,
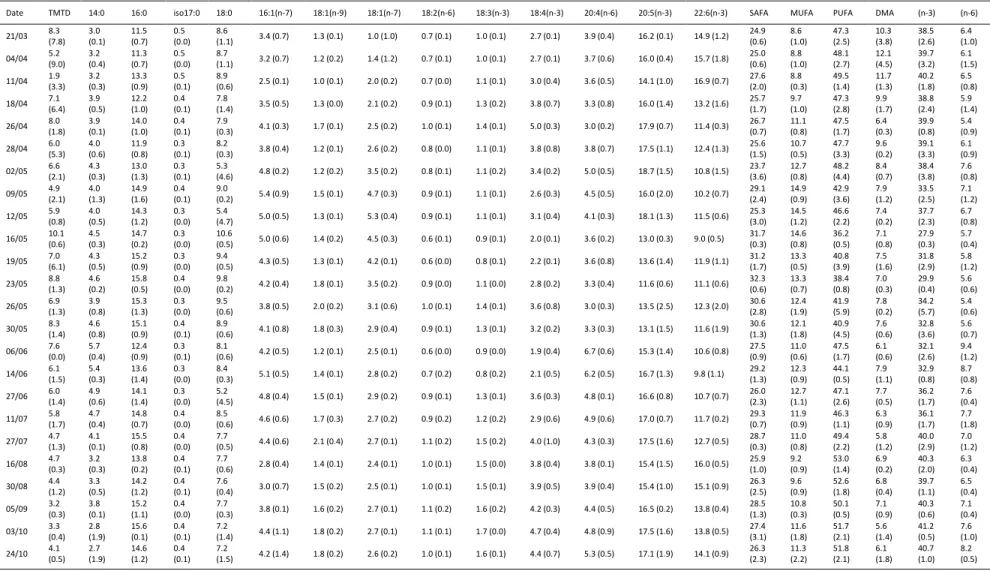
15 Table 3. Fatty acids (FA) composition of the polar lipids in the digestive gland of Pecten maximus (expressed as FA molar percentage of total) in the Bay of Brest in 2011.
Standard deviations are in brackets. TMTD: 4,8,12-trimethyltridecanoic acid; SAFA: sum of saturated FA; MUFA: sum of monounsaturated FA; PUFA: sum of polyunsaturated FA; DMA: dimethyl acetals; (n-3): sum of n-3 polyunsaturated FA, (n-6): sum of n-6 polyunsaturated FA.
Date TMTD 14:0 16:0 iso17:0 18:0 16:1(n-7) 18:1(n-9) 18:1(n-7) 18:2(n-6) 18:3(n-3) 18:4(n-3) 20:4(n-6) 20:5(n-3) 22:6(n-3) SAFA MUFA PUFA DMA (n-3) (n-6) 21/03 8.3 (7.8) 3.0 (0.1) 11.5 (0.7) 0.5 (0.0) 8.6 (1.1) 3.4 (0.7) 1.3 (0.1) 1.0 (1.0) 0.7 (0.1) 1.0 (0.1) 2.7 (0.1) 3.9 (0.4) 16.2 (0.1) 14.9 (1.2) 24.9 (0.6) 8.6 (1.0) 47.3 (2.5) 10.3 (3.8) 38.5 (2.6) 6.4 (1.0) 04/04 5.2 (9.0) 3.2 (0.4) 11.3 (0.7) 0.5 (0.0) 8.7 (1.1) 3.2 (0.7) 1.2 (0.2) 1.4 (1.2) 0.7 (0.1) 1.0 (0.1) 2.7 (0.1) 3.7 (0.6) 16.0 (0.4) 15.7 (1.8) 25.0 (0.6) 8.8 (1.0) 48.1 (2.7) 12.1 (4.5) 39.7 (3.2) 6.1 (1.5) 11/04 1.9 (3.3) 3.2 (0.3) 13.3 (0.9) 0.5 (0.1) 8.9 (0.6) 2.5 (0.1) 1.0 (0.1) 2.0 (0.2) 0.7 (0.0) 1.1 (0.1) 3.0 (0.4) 3.6 (0.5) 14.1 (1.0) 16.9 (0.7) 27.6 (2.0) 8.8 (0.3) 49.5 (1.4) 11.7 (1.3) 40.2 (1.8) 6.5 (0.8) 18/04 7.1 (6.4) 3.9 (0.5) 12.2 (1.0) 0.4 (0.1) 7.8 (1.4) 3.5 (0.5) 1.3 (0.0) 2.1 (0.2) 0.9 (0.1) 1.3 (0.2) 3.8 (0.7) 3.3 (0.8) 16.0 (1.4) 13.2 (1.6) 25.7 (1.7) 9.7 (1.0) 47.3 (2.8) 9.9 (1.7) 38.8 (2.4) 5.9 (1.4) 26/04 8.0 (1.8) 3.9 (0.1) 14.0 (1.0) 0.4 (0.1) 7.9 (0.3) 4.1 (0.3) 1.7 (0.1) 2.5 (0.2) 1.0 (0.1) 1.4 (0.1) 5.0 (0.3) 3.0 (0.2) 17.9 (0.7) 11.4 (0.3) 26.7 (0.7) 11.1 (0.8) 47.5 (1.7) 6.4 (0.3) 39.9 (0.8) 5.4 (0.9) 28/04 6.0 (5.3) 4.0 (0.6) 11.9 (0.8) 0.3 (0.1) 8.2 (0.3) 3.8 (0.4) 1.2 (0.1) 2.6 (0.2) 0.8 (0.0) 1.1 (0.1) 3.8 (0.8) 3.8 (0.7) 17.5 (1.1) 12.4 (1.3) 25.6 (1.5) 10.7 (0.5) 47.7 (3.3) 9.6 (0.2) 39.1 (3.3) 6.1 (0.9) 02/05 6.6 (2.1) 4.3 (0.3) 13.0 (1.3) 0.3 (0.1) 5.3 (4.6) 4.8 (0.2) 1.2 (0.2) 3.5 (0.2) 0.8 (0.1) 1.1 (0.2) 3.4 (0.2) 5.0 (0.5) 18.7 (1.5) 10.8 (1.5) 23.7 (3.6) 12.7 (0.8) 48.2 (4.4) 8.4 (0.7) 38.4 (3.8) 7.6 (0.8) 09/05 4.9 (2.1) 4.0 (1.3) 14.9 (1.6) 0.4 (0.1) 9.0 (0.2) 5.4 (0.9) 1.5 (0.1) 4.7 (0.3) 0.9 (0.1) 1.1 (0.1) 2.6 (0.3) 4.5 (0.5) 16.0 (2.0) 10.2 (0.7) 29.1 (2.4) 14.9 (0.9) 42.9 (3.6) 7.9 (1.2) 33.5 (2.5) 7.1 (1.2) 12/05 5.9 (0.8) 4.0 (0.5) 14.3 (1.2) 0.3 (0.0) 5.4 (4.7) 5.0 (0.5) 1.3 (0.1) 5.3 (0.4) 0.9 (0.1) 1.1 (0.1) 3.1 (0.4) 4.1 (0.3) 18.1 (1.3) 11.5 (0.6) 25.3 (3.0) 14.5 (1.2) 46.6 (2.2) 7.4 (0.2) 37.7 (2.3) 6.7 (0.8) 16/05 10.1 (0.6) 4.5 (0.3) 14.7 (0.2) 0.3 (0.0) 10.6 (0.5) 5.0 (0.6) 1.4 (0.2) 4.5 (0.3) 0.6 (0.1) 0.9 (0.1) 2.0 (0.1) 3.6 (0.2) 13.0 (0.3) 9.0 (0.5) 31.7 (0.3) 14.6 (0.8) 36.2 (0.5) 7.1 (0.8) 27.9 (0.3) 5.7 (0.4) 19/05 7.0 (6.1) 4.3 (0.5) 15.2 (0.9) 0.3 (0.0) 9.4 (0.5) 4.3 (0.5) 1.3 (0.1) 4.2 (0.1) 0.6 (0.0) 0.8 (0.1) 2.2 (0.1) 3.6 (0.8) 13.6 (1.4) 11.9 (1.1) 31.2 (1.7) 13.3 (0.5) 40.8 (3.9) 7.5 (1.6) 31.8 (2.9) 5.8 (1.2) 23/05 8.8 (1.3) 4.6 (0.2) 15.8 (0.5) 0.4 (0.0) 9.8 (0.2) 4.2 (0.4) 1.8 (0.1) 3.5 (0.2) 0.9 (0.0) 1.1 (0.0) 2.8 (0.2) 3.3 (0.4) 11.6 (0.6) 11.1 (0.6) 32.3 (0.6) 13.3 (0.7) 38.4 (0.8) 7.0 (0.3) 29.9 (0.4) 5.6 (0.6) 26/05 6.9 (1.3) 3.9 (0.8) 15.3 (1.3) 0.3 (0.0) 9.5 (0.6) 3.8 (0.5) 2.0 (0.2) 3.1 (0.6) 1.0 (0.1) 1.4 (0.1) 3.6 (0.8) 3.0 (0.3) 13.5 (2.5) 12.3 (2.0) 30.6 (2.8) 12.4 (1.9) 41.9 (5.9) 7.8 (0.2) 34.2 (5.7) 5.4 (0.6) 30/05 8.3 (1.4) 4.6 (0.8) 15.1 (0.9) 0.4 (0.1) 8.9 (0.6) 4.1 (0.8) 1.8 (0.3) 2.9 (0.4) 0.9 (0.1) 1.3 (0.1) 3.2 (0.2) 3.3 (0.3) 13.1 (1.5) 11.6 (1.9) 30.6 (1.3) 12.1 (1.8) 40.9 (4.5) 7.6 (0.6) 32.8 (3.6) 5.6 (0.7) 06/06 7.6 (0.0) 5.7 (0.4) 12.4 (0.9) 0.3 (0.1) 8.1 (0.6) 4.2 (0.5) 1.2 (0.1) 2.5 (0.1) 0.6 (0.0) 0.9 (0.0) 1.9 (0.4) 6.7 (0.6) 15.3 (1.4) 10.6 (0.8) 27.5 (0.9) 11.0 (0.6) 47.5 (1.7) 6.1 (0.6) 32.1 (2.6) 9.4 (1.2) 14/06 6.1 (1.5) 5.4 (0.3) 13.6 (1.4) 0.3 (0.0) 8.4 (0.3) 5.1 (0.5) 1.4 (0.1) 2.8 (0.2) 0.7 (0.2) 0.8 (0.2) 2.1 (0.5) 6.2 (0.5) 16.7 (1.3) 9.8 (1.1) 29.2 (1.3) 12.3 (0.9) 44.1 (0.5) 7.9 (1.1) 32.9 (0.8) 8.7 (0.8) 27/06 6.0 (1.4) 4.9 (0.6) 14.1 (1.4) 0.3 (0.0) 5.2 (4.5) 4.8 (0.4) 1.5 (0.1) 2.9 (0.2) 0.9 (0.1) 1.3 (0.1) 3.6 (0.3) 4.8 (0.1) 16.6 (0.8) 10.7 (0.7) 26.0 (2.3) 12.7 (1.1) 47.1 (2.6) 7.7 (0.5) 36.2 (1.7) 7.6 (0.4) 11/07 5.8 (1.7) 4.7 (0.4) 14.8 (0.7) 0.4 (0.0) 8.5 (0.6) 4.6 (0.6) 1.7 (0.3) 2.7 (0.2) 0.9 (0.2) 1.2 (0.2) 2.9 (0.6) 4.9 (0.6) 17.0 (0.7) 11.7 (0.2) 29.3 (0.7) 11.9 (0.9) 46.3 (1.1) 6.3 (0.9) 36.1 (1.7) 7.7 (1.8) 27/07 4.7 (1.3) 4.1 (0.1) 15.5 (0.8) 0.4 (0.0) 7.7 (0.5) 4.4 (0.6) 2.1 (0.4) 2.7 (0.1) 1.1 (0.2) 1.5 (0.2) 4.0 (1.0) 4.3 (0.3) 17.5 (1.6) 12.7 (0.5) 28.7 (0.3) 11.0 (0.8) 49.4 (2.2) 5.8 (1.2) 40.0 (2.9) 7.0 (1.2) 16/08 4.7 (0.3) 3.2 (0.3) 13.8 (0.2) 0.4 (0.1) 7.7 (0.6) 2.8 (0.4) 1.4 (0.1) 2.4 (0.1) 1.0 (0.1) 1.5 (0.0) 3.8 (0.4) 3.8 (0.1) 15.4 (1.5) 16.0 (0.5) 25.9 (1.0) 9.2 (0.9) 53.0 (1.4) 6.9 (0.2) 40.3 (2.0) 6.3 (0.4) 30/08 4.4 (1.2) 3.3 (0.5) 14.2 (1.2) 0.4 (0.1) 7.6 (0.4) 3.0 (0.7) 1.5 (0.2) 2.5 (0.1) 1.0 (0.1) 1.5 (0.1) 3.9 (0.5) 3.9 (0.4) 15.4 (1.0) 15.1 (0.9) 26.3 (2.5) 9.6 (0.9) 52.6 (1.8) 6.8 (0.4) 39.7 (1.1) 6.5 (0.4) 05/09 3.2 (0.3) 3.8 (0.1) 15.2 (1.1) 0.4 (0.0) 7.7 (0.3) 3.8 (0.1) 1.6 (0.2) 2.7 (0.1) 1.1 (0.2) 1.6 (0.2) 4.2 (0.3) 4.4 (0.5) 16.5 (0.2) 13.8 (0.4) 28.5 (1.3) 10.8 (0.3) 50.1 (0.5) 7.1 (0.9) 40.3 (0.6) 7.1 (0.4) 03/10 3.3 (0.4) 2.8 (1.9) 15.6 (0.1) 0.4 (0.1) 7.2 (1.4) 4.4 (1.1) 1.8 (0.2) 2.7 (0.1) 1.1 (0.1) 1.7 (0.0) 4.7 (0.4) 4.8 (0.9) 17.5 (1.6) 13.8 (0.5) 27.4 (3.1) 11.6 (1.8) 51.7 (2.1) 5.6 (1.4) 41.2 (0.5) 7.6 (1.0) 24/10 4.1 (0.5) 2.7 (1.9) 14.6 (1.2) 0.4 (0.1) 7.2 (1.5) 4.2 (1.4) 1.8 (0.2) 2.6 (0.2) 1.0 (0.1) 1.6 (0.1) 4.4 (0.7) 5.3 (0.5) 17.1 (1.9) 14.1 (0.9) 26.3 (2.3) 11.3 (2.2) 51.8 (2.1) 6.1 (1.8) 40.7 (1.0) 8.2 (0.5)
16 Table 4. Fatty acids (FA) composition of the neutral lipids in the digestive gland of Pecten maximus (expressed as FA molar percentage of total) in the Bay of Brest in 2011.
Standard deviations are in brackets. TMTD: 4,8,12-trimethyltridecanoic acid; SAFA: sum of saturated FA; MUFA: sum of monounsaturated FA; PUFA: sum of polyunsaturated FA; DMA: dimethyl acetals; (n-3): sum of n-3 polyunsaturated FA; (n-6): sum of n-6 polyunsaturated FA.
Date TMTD 14:0 16:0 16:1(n-7) 18:1(n-9) 18:1(n-7) 18:2(n-6) 18:3(n-3) 18:4(n-3) 18:5(n-3) 20:4(n-6) 20:4(n-3) 20:5(n-3) 22:6(n-3) SAFA MUFA PUFA DMA (n-3) (n-6)
21/03 1.5 (0.2) 2.1 (0.4) 6.5 (2.5) 8.8 (0.4) 2.8 (0.0) 3.8 (0.1) 2.1 (0.0) 2.2 (0.0) 6.5 (0.0) 0.4 (0.1) 3.3 (0.0) 1.0 (0.5) 23.0 (0.0) 6.8 (0.0) 26.5 (0.0) 18.4 (0.6) 51.1 (0.0) 1.5 (0.0) 41.7 (0.2) 6.8 (0.1) 04/04 2.0 (0.4) 2.1 (0.1) 7.9 (2.3) 8.0 (0.8) 2.5 (0.0) 4.0 (0.1) 2.1 (0.0) 2.5 (0.0) 7.9 (0.0) 0.4 (0.1) 2.4 (0.0) 1.1 (1.3) 21.5 (0.0) 6.6 (0.0) 27.1 (0.0) 18.1 (0.3) 50.4 (0.1) 1.4 (0.0) 41.9 (0.3) 6.0 (0.2) 11/04 1.6 (0.4) 2.3 (0.4) 9.9 (0.9) 7.5 (0.8) 2.1 (0.3) 3.3 (0.0) 2.3 (0.2) 2.8 (0.4) 9.9 (2.3) 0.4 (0.1) 1.5 (1.1) 1.2 (0.2) 21.6 (0.8) 6.6 (0.2) 27.0 (1.5) 15.7 (1.0) 53.1 (2.1) 2.2 (0.4) 44.9 (2.3) 5.2 (0.8) 18/04 1.8 (0.2) 7.5 (0.5) 16.5 (0.2) 8.1 (0.6) 1.8 (1.3) 3.6 (0.1) 1.9 (0.4) 2.1 (0.7) 8.3 (1.2) 0.3 (0.1) 2.5 (0.3) 1.3 (0.2) 21.8 (1.3) 6.6 (0.4) 28.1 (0.9) 17.2 (1.2) 51.5 (0.9) 0.7 (0.8) 42.9 (1.3) 5.9 (0.7) 26/04 1.8 (0.2) 8.1 (0.7) 14.3 (4.2) 8.2 (1.7) 2.8 (0.2) 2.9 (0.1) 2.2 (0.2) 2.8 (0.2) 8.4 (0.8) 0.5 (0.0) 2.8 (0.4) 1.0 (0.4) 23.6 (3.2) 6.2 (0.6) 26.3 (4.0) 17.5 (2.7) 53.4 (6.2) 0.2 (0.1) 44.7 (5.1) 6.4 (0.6) 28/04 1.8 (0.3) 7.6 (0.9) 14.2 (2.2) 9.4 (0.4) 1.7 (1.0) 3.8 (0.2) 2.4 (0.3) 2.3 (1.0) 8.9 (2.9) 0.2 (0.0) 2.6 (1.1) 1.3 (0.4) 24.6 (0.7) 6.6 (0.9) 25.0 (2.6) 18.2 (1.5) 54.4 (4.0) 0.1 (0.1) 46.2 (5.0) 6.4 (0.6) 02/05 1.6 (1.4) 10.4 (1.6) 11.7 (4.8) 7.2 (3.2) 2.8 (0.2) 3.6 (0.2) 1.6 (0.2) 2.6 (0.4) 7.7 (1.4) 0.0 (0.0) 3.2 (0.4) 0.7 (0.2) 25.8 (5.5) 6.4 (1.6) 26.5 (3.8) 16.8 (4.3) 54.2 (7.6) 0.5 (0.8) 45.3 (8.2) 6.2 (0.5) 09/05 1.1 (1.0) 10.5 (3.2) 13.4 (3.4) 9.8 (3.5) 2.5 (0.5) 3.3 (0.2) 2.0 (1.0) 2.0 (0.6) 7.5 (1.8) 0.1 (0.0) 2.4 (0.7) 1.0 (0.4) 19.9 (3.2) 6.7 (2.2) 29.5 (4.3) 19.7 (5.7) 48.3 (1.8) 0.7 (0.8) 39.5 (1.5) 5.9 (1.0) 12/05 1.8 (0.0) 8.3 (0.3) 15.8 (0.6) 11.2 (0.5) 2.1 (0.1) 4.4 (0.0) 1.9 (0.2) 2.4 (0.2) 8.2 (0.4) 0.4 (0.1) 2.2 (0.2) 1.2 (0.0) 22.5 (1.3) 4.9 (0.5) 28.0 (0.9) 20.7 (0.7) 48.0 (1.6) 0.2 (0.0) 41.4 (1.5) 5.4 (0.1) 16/05 1.8 (0.1) 8.6 (0.3) 17.7 (0.2) 10.5 (0.3) 2.4 (0.1) 4.7 (0.0) 1.8 (0.1) 2.1 (0.0) 6.1 (0.3) 0.1 (0.1) 2.8 (0.1) 1.0 (0.1) 20.1 (0.1) 5.0 (0.5) 31.3 (0.1) 21.3 (0.5) 44.6 (0.5) 0.2 (0.0) 36.2 (0.5) 5.9 (0.0) 19/05 2.5 (0.2) 9.3 (0.3) 18.1 (0.3) 10.3 (0.2) 2.4 (0.2) 5.0 (0.0) 1.7 (0.2) 1.9 (0.1) 5.5 (0.6) 0.1 (0.0) 2.6 (0.6) 0.9 (0.1) 17.8 (0.4) 5.7 (0.3) 32.7 (0.2) 21.7 (0.6) 42.3 (0.8) 0.2 (0.1) 34.0 (0.5) 5.7 (0.9) 23/05 2.4 (0.6) 7.0 (3.1) 18.8 (2.8) 12.0 (1.5) 3.0 (1.1) 1.5 (0.1) 2.3 (0.0) 2.4 (0.2) 6.1 (0.2) 0.3 (0.2) 2.8 (1.0) 0.9 (0.3) 18.5 (4.3) 5.9 (1.1) 31.1 (5.5) 21.7 (1.9) 44.0 (6.4) 0.1 (0.1) 35.8 (5.0) 6.7 (1.1) 26/05 2.2 (0.3) 6.4 (3.2) 16.7 (3.2) 13.2 (3.2) 2.2 (0.8) 4.9 (0.1) 2.3 (0.4) 2.0 (0.6) 5.9 (1.4) 0.4 (0.2) 2.4 (0.8) 1.1 (0.2) 19.1 (7.0) 7.2 (2.5) 27.1 (7.1) 23.5 (3.0) 46.1 (10.0) 0.1 (0.1) 37.8 (9.6) 6.3 (1.6) 30/05 2.9 (0.8) 9.3 (0.5) 20.2 (3.3) 9.2 (0.4) 3.2 (0.9) 4.0 (0.3) 1.2 (1.3) 1.7 (1.1) 8.4 (3.8) 0.5 (0.2) 2.5 (1.0) 0.7 (0.2) 13.4 (0.4) 6.6 (2.2) 35.2 (4.2) 21.2 (2.3) 39.5 (5.0) 0.4 (0.3) 32.5 (5.0) 4.8 (0.0) 06/06 2.3 (0.6) 10.1 (0.6) 12.4 (4.1) 8.8 (3.3) 1.9 (0.8) 4.0 (0.1) 1.6 (0.1) 1.9 (0.2) 5.3 (1.2) 0.3 (0.0) 4.9 (0.9) 0.7 (0.2) 25.6 (2.7) 5.6 (1.7) 26.8 (4.0) 18.1 (5.3) 52.0 (4.5) 0.1 (0.0) 41.6 (4.9) 8.2 (1.0) 14/06 2.5 (0.5) 10.0 (0.4) 16.3 (1.9) 11.3 (0.3) 2.6 (0.3) 1.5 (0.0) 1.0 (0.3) 2.4 (0.4) 6.2 (0.9) 0.3 (0.0) 3.8 (0.5) 0.9 (0.1) 22.7 (1.2) 5.4 (0.6) 30.3 (2.1) 17.7 (0.7) 48.5 (1.1) 0.2 (0.0) 39.7 (2.1) 6.0 (0.8) 27/06 2.9 (0.3) 10.4 (0.2) 14.0 (0.7) 10.4 (3.0) 2.2 (0.6) 2.2 (0.0) 0.8 (0.5) 2.2 (1.0) 8.7 (0.6) 0.0 (0.0) 3.4 (0.4) 0.7 (0.1) 23.0 (0.5) 6.8 (0.7) 27.3 (0.8) 18.0 (1.7) 50.8 (2.3) 0.2 (0.1) 43.4 (1.6) 5.5 (0.5) 11/07 3.9 (3.3) 9.3 (0.9) 13.5 (2.4) 9.6 (1.4) 1.6 (0.8) 3.2 (0.1) 1.7 (0.4) 2.3 (0.2) 6.5 (0.4) 0.4 (0.0) 3.7 (0.6) 1.0 (0.1) 24.3 (2.1) 6.8 (0.6) 25.7 (3.0) 17.4 (2.2) 51.6 (2.6) 0.5 (0.5) 42.6 (1.9) 6.9 (0.3) 27/07 1.9 (0.4) 5.8 (3.3) 12.6 (3.2) 10.0 (0.9) 3.0 (0.4) 3.9 (0.2) 2.2 (0.3) 2.6 (0.1) 7.2 (0.5) 0.6 (0.1) 3.5 (0.6) 0.9 (0.1) 22.3 (2.2) 7.7 (0.3) 22.9 (6.3) 20.8 (2.0) 52.8 (4.1) 0.3 (0.1) 43.3 (2.7) 7.4 (1.1) 16/08 2.2 (0.5) 8.3 (0.6) 13.8 (0.9) 9.4 (2.2) 1.6 (0.1) 3.0 (0.1) 1.7 (0.9) 2.9 (0.3) 7.4 (0.2) 0.3 (0.2) 2.8 (1.0) 1.2 (0.1) 24.0 (1.2) 7.4 (2.3) 25.9 (0.7) 18.0 (1.6) 53.5 (2.6) 0.1 (0.1) 44.9 (0.6) 6.0 (1.6) 30/08 1.8 (0.1) 8.5 (0.3) 15.2 (2.6) 8.0 (1.0) 1.8 (0.5) 4.0 (0.0) 2.4 (0.4) 2.9 (0.4) 7.3 (0.2) 0.2 (0.0) 3.1 (0.2) 1.0 (0.0) 21.9 (1.2) 7.3 (1.3) 27.9 (3.2) 17.3 (0.3) 52.3 (3.7) 0.2 (0.0) 42.4 (2.8) 6.7 (0.6) 05/09 1.6 (0.3) 7.9 (0.9) 17.0 (4.2) 7.9 (1.3) 2.2 (1.1) 2.7 (0.1) 2.4 (0.5) 2.9 (0.5) 7.8 (1.3) 0.4 (0.3) 3.0 (0.3) 1.1 (0.2) 21.9 (3.0) 7.5 (1.8) 28.6 (4.6) 15.9 (2.2) 53.2 (7.2) 0.2 (0.0) 43.7 (6.6) 6.7 (0.7) 03/10 3.0 (2.5) 7.1 (2.7) 13.0 (1.6) 5.5 (1.3) 1.9 (1.3) 2.6 (0.2) 2.1 (1.1) 2.5 (1.6) 7.4 (3.0) 0.3 (0.3) 4.4 (1.7) 0.8 (0.5) 22.9 (3.5) 11.0 (3.8) 26.1 (3.5) 12.3 (3.2) 58.0 (3.6) 0.3 (0.2) 47.3 (4.5) 7.9 (0.7) 24/10 3.0 (2.2) 6.8 (2.8) 11.1 (3.2) 6.3 (2.7) 2.6 (1.3) 1.9 (0.4) 2.0 (1.1) 2.5 (1.7) 7.5 (3.3) 0.1 (0.1) 4.4 (1.3) 0.7 (0.5) 22.3 (4.0) 10.5 (3.4) 23.6 (5.2) 14.3 (6.0) 56.0 (4.6) 2.8 (3.7) 46.0 (5.5) 7.9 (0.3)
17 of the study (Fig. 6b). Finally, iso17:0 FA found in the PLs presented interesting dynamics as it decreased from March to the end of May before rising again during summer and reaching a median value at the end of monitoring. Interestingly, our results suggest that most FAs assimilated as reserve compounds (neutral fraction), except 18:5(n-3), were hardly related to the short-term seasonal patterns observed through the analysis of pigments and PLs.
Fig. 7. Proportion of cholesterol (dotted line, black dots), 24 methylene cholesterol (dashed line, black squares) and
brassicasterol (solid line, black triangles) in the digestive gland of Pecten maximus (expressed as sterol percentage of total) in the Bay of Brest in 2011. Standard deviations are indicated by vertical grey lines
Sterol content in the DG increased from 35.9 to 105.3 μg g−1 with a peak at 183.0 μg g−1 on 19 May (Table 5). Cholesta-5-e(n-3)β-ol (cholesterol) was, on average, the most common sterolic compound (24%), followed by 5β-cholesta(n-3)β-ol (coprostanol; 21.6%), 24β-methylenecholesta-5,24(28)-die(n-3)β-ol (24 methylene cholesterol; 15.8%), 24β-methylcholesta-5,22-die(n-3)β-ol (brassicasterol; 11.8%) and 24β-ethylenecholesta-5-e(n-3)β-ol (β-sitosterol; 5.4%). Cholesterol de creased slowly from 29.5 to 20.5% during the study period, without any strong variation (Fig. 7). The evolution of 24 methylene cholesterol followed the same dynamics as fucoxanthin in the stomach content, and EPA or 16:1(n-7) in the DG. A first increase was observed in May, lasting for 2 wk with a maximum at 22%. It was followed by a second, more intense peak in early June, up to 24%, and a final increase in late September to about the same level as the first spring peak. Brassicasterol showed an inverse dynamic: it decreased to 10% from mid-April to mid-May, then increased at the end of the month before reaching a plateau in summer and finally slightly decreasing again from mid-August until the end of the study.
18 Table 5. Sterol composition of the digestive gland of Pecten maximus (expressed as sterol percentage of total) in the Bay of Brest in 2011. NOR: norcholesterol; CHO: cholesterol;
BRA: brassicasterol; DES: desmosterol; CAM: campesterol; 24M: 24 methylene; STI: stigmasterol; BSI: β-sitosterol; FUS: fucosterol; OTH: other sterols; TOT: total sterol concentration (in μmol g-1). Standard deviations are in brackets
Date (dd/mo) NOR CHO BRA DES CAM 24M STI BSI FUC OTH TOT 21/03 4.0 (0.4) 29.6 (2.1) 15.8 (1.1) 4.6 (0.3) 2.5 (0.2) 12.4 (1.0) 3.3 (0.6) 6.9 (0.4) 1.7 (0.2) 19.2 (1.3) 46.77 (3.74) 04/04 4.3 (0.2) 29.8 (1.9) 13.6 (3.3) 4.0 (1.3) 2.3 (0.5) 11.6 (0.4) 3.0 (1.0) 5.9 (1.4) 1.5 (0.4) 23.9 (0.8) 50.85 (10.28) 11/04 4.1 (0.5) 28.1 (3.8) 14.7 (2.3) 3.7 (0.3) 2.5 (0.3) 13.3 (1.5) 2.9 (0.3) 5.9 (0.8) 1.7 (0.3) 23.5 (1.3) 35.92 (10.31) 18/04 4.3 (0.2) 29.1 (2.2) 15.4 (1.0) 2.9 (0.2) 2.1 (0.1) 14.4 (0.8) 2.9 (0.4) 6.1 (0.6) 1.6 (0.2) 21.8 (0.6) 55.65 (5.89) 26/04 3.6 (0.5) 25.4 (0.4) 12.1 (0.7) 2.2 (0.8) 1.9 (0.1) 15.7 (0.7) 2.1 (0.3) 5.3 (0.8) 1.9 (0.2) 29.8 (0.4) 58.81 (1.80) 28/04 2.7 (0.1) 24.3 (1.8) 10.7 (0.4) 2.8 (0.6) 1.7 (0.1) 18.5 (2.2) 2.5 (0.3) 5.6 (1.1) 1.6 (0.2) 30.1 (0.7) 53.73 (6.10) 02/05 3.3 (0.4) 23.9 (2.8) 9.9 (0.9) 2.2 (0.2) 1.9 (0.1) 21.7 (3.8) 2.5 (0.4) 5.0 (0.9) 1.3 (0.0) 28.5 (0.4) 50.75 (9.01) 09/05 3.6 (0.3) 24.5 (0.4) 10.0 (0.9) 1.8 (0.2) 1.7 (0.2) 21.6 (3.7) 2.5 (0.5) 5.0 (0.2) 1.3 (0.1) 27.9 (0.6) 49.75 (3.02) 12/05 3.2 (0.1) 23.6 (1.4) 10.4 (0.6) 2.9 (0.3) 1.8 (0.3) 21.9 (1.1) 3.0 (0.5) 6.4 (0.3) 1.3 (0.5) 25.4 (0.3) 47.28 (3.71) 16/05 3.4 (0.3) 24.4 (1.4) 10.2 (0.1) 2.9 (0.7) 1.7 (0.5) 16.5 (1.2) 3.1 (0.3) 6.2 (0.6) 1.4 (0.1) 30.1 (0.4) 44.42 (3.44) 19/05 0.0 (0.0) 26.4 (0.6) 12.6 (1.1) 3.9 (0.5) 2.3 (0.1) 20.4 (1.0) 4.1 (0.7) 7.3 (0.8) 2.0 (0.4) 20.9 (1.2) 41.18 (6.64) 23/05 3.7 (0.2) 24.4 (1.9) 12.6 (1.1) 2.9 (0.4) 2.2 (0.1) 15.4 (0.9) 3.3 (0.2) 6.2 (0.6) 1.7 (0.3) 27.6 (1.6) 48.88 (7.28) 26/05 3.6 (0.1) 22.6 (1.7) 13.5 (2.3) 2.7 (0.5) 2.3 (0.2) 12.9 (2.0) 3.4 (0.7) 6.3 (1.0) 2.0 (0.3) 30.7 (0.7) 52.73 (8.72) 30/05 3.0 (0.4) 21.7 (2.4) 12.1 (1.7) 3.2 (0.6) 2.0 (0.2) 12.6 (0.9) 3.0 (1.0) 5.7 (1.4) 1.7 (0.4) 34.9 (1.1) 73.73 (9.28) 06/06 3.4 (0.2) 23.8 (1.9) 10.5 (0.7) 2.2 (0.1) 2.4 (0.4) 24.0 (2.9) 2.5 (0.3) 4.8 (0.6) 1.1 (0.0) 26.5 (0.5) 183.08 (4.59) 14/06 2.6 (0.1) 21.4 (0.6) 12.9 (1.2) 2.8 (0.4) 3.2 (0.4) 17.9 (1.4) 2.0 (0.4) 4.9 (0.8) 1.2 (0.2) 31.1 (0.4) 66.02 (5.00) 27/06 3.3 (0.1) 23.4 (1.3) 12.4 (0.9) 2.4 (0.1) 2.2 (0.2) 13.9 (0.9) 2.7 (0.2) 4.7 (0.1) 1.4 (0.1) 33.6 (0.8) 62.34 (4.91) 11/07 2.5 (0.3) 22.4 (1.3) 11.1 (0.3) 3.5 (0.7) 1.9 (0.2) 16.0 (0.6) 2.4 (0.3) 4.9 (0.3) 0.9 (0.5) 34.3 (1.2) 63.79 (2.78) 27/07 2.4 (0.1) 22.4 (2.6) 11.3 (0.8) 2.8 (1.2) 2.3 (0.2) 12.9 (1.3) 2.6 (0.4) 4.9 (0.5) 1.8 (0.5) 37.4 (1.7) 54.35 (9.16) 16/08 2.8 (0.6) 22.7 (4.7) 11.4 (2.4) 2.3 (1.1) 2.3 (0.1) 9.8 (0.5) 2.7 (0.2) 6.4 (2.2) 2.0 (0.1) 42.4 (1.5) 42.89 (4.49) 30/08 2.4 (0.3) 19.7 (0.6) 9.6 (0.0) 2.7 (0.3) 2.1 (0.1) 9.3 (0.1) 2.6 (0.3) 4.5 (0.3) 1.6 (0.4) 45.2 (0.5) 91.12 (0.88) 05/09 2.9 (0.2) 21.1 (2.7) 10.3 (1.7) 1.5 (0.9) 2.2 (0.4) 10.2 (1.4) 2.5 (0.7) 3.2 (1.5) 1.5 (0.4) 44.7 (0.8) 98.50 (6.42) 03/10 1.9 (0.3) 22.0 (0.4) 8.7 (2.1) 1.3 (0.9) 1.8 (0.3) 22.0 (5.6) 2.3 (0.5) 2.6 (1.7) 1.3 (0.2) 36.2 (1.4) 65.43 (3.47) 24/10 3.0 (0.4) 20.5 (0.8) 10.6 (1.8) 2.0 (0.6) 2.2 (0.3) 14.8 (5.2) 2.1 (0.1) 4.4 (0.6) 1.6 (0.2) 39.5 (0.5) 105.31 (8.02)
19 3.4. Multivariate analysis
The CCA shown in Fig. 8 validates the observations made through the analyses of the different biochemical markers used in this study, even though the eigenvalues of the CCA axes are not very high (10 to 40.8% of variance explained). Only the most prominent markers identified previously were selected and used in this analysis, since the high number of markers, their variability and the fact that some are less specific of certain microalgae produced results that were hardly interpretable in early trials. The best explained dispersion occurs along the first axis in the pigment analysis (Fig. 8a), differentiating between diatom markers on the left-hand side of the axis and markers of other food sources on the opposite side. Another distinction arises along the second axis, showing markers for diatoms and Dinophyceae in the upper part and other microalgae markers in the lower part. The same trend emerged from the CCA conducted on lipid markers (Fig. 8b), with diatom markers, as well as, to a lesser extent Dinophyceae, clearly distributed away from others. Another observation common to both plots is the clear distinction between microalgae from the water column and those from the water−sediment interface, again confirming the temporal shift reported earlier.
Fig. 8. Triplots from the canonical correspondence analysis performed on pigment and lipid data. Plots include phytoplankton
counts in the water column (wc; blue vectors) and the water−sediment interface (wsi; red vectors) and (a) proportions of pigments in the water column (blue dots), the water−sediment interface (red dots) and the stomach contents of Pecten maximus (s; black dots) and (b) proportions of fatty acids from the polar fraction (black dots), the neutral fraction (white dot)
20
4. Discussion
4.1. Validation of pigments as biomarkers
To our knowledge, the present study is the first to combine the use of pigments, FAs and sterols as food source biomarkers in a seasonal trophic study of a marine suspension-feeding invertebrate. The only other study presenting similar data is by Hurtado et al. (2012), who focused on seasonal dynamics of pigments, FAs and sterols in relation to the reproductive activity of female Crassostrea corteziensis. They concluded that these indicators were relevant when trying to infer energy reserve dynamics, because they are essential membrane components provided by diet and food availability.
There was a clear relationship between pigment concentration and composition in the water and the phytoplankton cell microscopic observations (Fig. 8). The variation of the fucoxanthin proportion corresponded well to each diatom bloom in early May, early June and late September (Fig. 2). Indeed, this pigment has often been reported to highlight the presence of diatoms (Jeffrey 1974, 1997, Mackey et al. 1996, Lampert 2001, Wright & Jeffrey 2006, Sanz et al. 2015), which contain the most important proportions of this pigment (Lampert 2001). Likewise, the highly variable dynamics of Dinophyceae blooms were very well reproduced by the proportion of peridinin in the water. Alloxanthin proportions recorded in both water compartments precisely matched the identification of Cryptophyceae, which is also in accordance with previous observations (Jeffrey 1974, 1997, Mackey et al. 1996, Lampert 2001, Wright & Jeffrey 2006, Sanz et al. 2015). The Prymnesiophyceae algae class has been reported to especially contain 19’HF (Jeffrey 1974, 1997, Mackey et al. 1996, Lampert 2001, Wright & Jeffrey 2006, Sanz et al. 2015), which in the present study seemed to be well correlated with the development of these microalgae. However, cell identification did not fit well with measurements of chl
b, a pigment usually linked to Chlorophyceae (Jeffrey 1974, 1997, Mackey et al. 1996, Lampert 2001,
Wright & Jeffrey 2006, Sanz et al. 2015). While the proportion of chl b in the filtered water was rather high during the study (up to 15% in the water column and 25% at the bottom, especially during summer), only one bloom of Chlorophyceae was registered in late May. This pigment also constitutes a major component of green macroalgae, which are often observed in the Bay of Brest (Ménesguen et al. 2006). The high concentrations of this pigment in our filtrates could be attributed to discarded pieces of macroalgae in the water (Lampert 2001). The microalgae Lepidodinium chlorophorum, which bloomed between mid-July and mid-August, is also the only known Dinophyceae to contain chl b (Zapata et al. 2012), which is likely to explain the presence of this pigment in the water at this time.
Lipid proportions in the DG fluctuated less than pigment concentrations in the digestive tract content. The incorporation of lipids in the tissues of the organism is a regulated process, smoothed by homeostatic processes and selective incorporation mechanisms (Soudant et al. 1996). On the other hand, pigments are not edible compounds to be assimilated by the scallops (Shuman & Lorenzen 1975). Most of them are egested within faeces in a more or less degraded form. Considering the properties of these 2 biochemical compounds, the strong changes observed in both FAs from the PLs and sterols were important and indicated critical modifications of the cell membrane of DG tissue, notwithstanding the rather strong homeostasis that would be expected for these structural compounds. Our results indicated stronger variations of FAs from the polar fraction compared to those of the neutral fraction in the DG. In
21 this organ, reserve lipids (i.e. NLs) remain relatively unmodified by the diet (Nérot et al. 2015). Measurement of FA composition in other tissues such as the muscle usually focuses on reserve lipids, as dietary FAs are more selectively incorporated into the muscle due to its longer turnover rate (Nérot et al. 2015). Finally, the difference in turnover rate between pigments and lipids in organisms is an advantage which helps overcome the change in sampling frequency (twice a week in April and May, once every 2 wk for the rest of the study), which might impact the temporal variability of data.
4.2. Feeding ecology
4.2.1. Importance of Dinophyceae in the diet of P. maximus
This study highlights the complexity of the diet of P. maximus, both temporally and in terms of composition. During monitoring, the proportion of DHA, representative of Dinophyceae (Parrish et al. 1995, Dalsgaard et al. 2003, Parrish 2013), in the PLs of the DG showed rather important variations. Another FA usually found in some Dinophyceae species is 18:5(n-3) (Dijkman & Kromkamp 2006), which displayed variations that were very similar to the dynamics of peridinin and DHA. The level of peridinin, a specific pigment of the Dinophyceae (Jeffrey, 1974, 1997, Mackey et al. 1996, Lampert 2001, Wright & Jeffrey 2006, Sanz et al. 2015), in the digestive tract of P. maximus averaged 18% in the stomach, indicating a significant ingestion of this microalgae class. This is rather surprising as the proportion of peridinin in the water did not exceed 13%. Loret et al. (2000) observed similar results with the oyster
Pinctada margaritifera, which actively selected Cryptophyceae despite their relatively low presence in
the water. Dinophyceae did not dominate phytoplankton composition in the water, yet biomarkers of this phylum were high in the scallop and showed clear covariation between scallop tissues and the environment (Fig. 8). This suggests that P. maximus could be actively selecting Dinophyceae out of the available microalgae mix. DHA and EPA are 2 essential FAs for bivalves (Soudant et al. 1996, 1998b), and DHA is largely present in Dinophyceae and also found in some Prymnesiophyceae (Parrish et al. 1995, Volkman et al. 1998, Dalsgaard et al. 2003, Mansour et al. 2005, Parrish 2013). Foraging on Dinophyceae, even when they are not dominant in the water, could be a way for scallops to get this essential component into their diet. However, these findings conflict with the fact that many Dinophyceae species (not observed during this study) are known for their toxicity. Several studies have reported the negative impacts of blooming events of such microalgae on the physiology of P. maximus (Erard-LeDenn et al. 1990, Lorrain et al. 2000, Chauvaud et al. 2001). Not all species of Dinophyceae produce toxins, but they have long been considered as more of a threat than an essential food source for the great scallop (Smolowitz & Shumway 1997, Lorrain et al. 2000, Chauvaud et al. 2001, Bougrier et al. 2003). P. maximus might be able to select and sort ingested food on a qualitative basis. Suggestions have been made in this way to explain the active selection of food particles in suspension-feeding bivalves, involving ctenidia retention, labial palps sorting and physico-chemical interactions with algal cell surface (Shumway et al. 1985, Ward & Shumway 2004, Espinosa et al. 2010, Rosa et al. 2013).
Moreover, the great scallop seemed to be able to switch from one source to another depending on the season. Indeed, despite the predominant proportion of diatoms as a food source for scallops, there is an alternation in the stomach content of fucoxanthin, found mainly in diatoms, and peridinin, found exclusively in Dinophyceae (Fig. 4). These shifts are also observed in the FA dynamics (Fig. 6), the


![Fig. 3. (a,b) Total quantity of pigment, including chl a, measured in the stomach content of Pecten maximus (dark line in [a,b]), in the water column (light grey area in [a]), and at the water–sediment interface (grey area in [b]) in the Bay of Brest in 2](https://thumb-eu.123doks.com/thumbv2/123doknet/13753065.437878/11.918.176.750.101.592/quantity-pigment-including-measured-stomach-content-sediment-interface.webp)