HAL Id: hal-01169974
https://hal-brgm.archives-ouvertes.fr/hal-01169974
Submitted on 30 Jun 2015
HAL is a multi-disciplinary open access archive for the deposit and dissemination of sci-entific research documents, whether they are pub-lished or not. The documents may come from teaching and research institutions in France or abroad, or from public or private research centers.
L’archive ouverte pluridisciplinaire HAL, est destinée au dépôt et à la diffusion de documents scientifiques de niveau recherche, publiés ou non, émanant des établissements d’enseignement et de recherche français ou étrangers, des laboratoires publics ou privés.
Evidence for TiO2 nanoparticle transfer in a hard-rock
aquifer
Lise Cary, Hélène Pauwels, Patrick Ollivier, Géraldine Picot-Colbeaux,
Philippe Leroy, Bruno Mougin, Gilles Braibant, Jérôme Labille
To cite this version:
Lise Cary, Hélène Pauwels, Patrick Ollivier, Géraldine Picot-Colbeaux, Philippe Leroy, et al.. Evidence for TiO2 nanoparticle transfer in a hard-rock aquifer. Journal of Contaminant Hydrology, Elsevier, 2015, 179, pp.148-159. �10.1016/j.jconhyd.2015.06.007�. �hal-01169974�
1
Evidence for TiO2 nanoparticle transfer in a hard-rock aquifer
Lise Cary1,*, Hélène Pauwels1, Patrick Ollivier1, Géraldine Picot1, Philippe Leroy1, Bruno Mougin2, Gilles Braibant1, Jérôme Labille3
1BRGM, 3 avenue C. Guillemin, BP 6009, 45060 Orléans, France
2BRGM Service Géologique Régional Bretagne, 2 rue de Jouanet, 35700 Rennes, France 3 Aix-Marseille Université,CNRS, IRD, CEREGE UM 34, Aix-en-Provence 13545, France
*Corresponding author: Phone number: 00 33 2 38 64 32 60; e-mail: [email protected]
Intended for publication in Journal of Contaminant Hydrology
Abstract
Water flow and TiO2 nanoparticle (NP) transfer in a fractured hard-rock aquifer were studied
in a tracer test experiment at a pilot site in Brittany, France. Results from the Br tracer test
show that the schist aquifer can be represented by a two-layermedium comprising i) fractures
with low longitudinal dispersivity in which water and solute transport is relatively fast, and ii) a
network of small fissures with high longitudinal dispersivity in which transport is slower.
Although a large amount of NPs was retained within the aquifer, a significant TiO2
concentration was measuredin a well 15m downstream of the NP injection well, clearly
confirming the potential for TiO2 NPs to be transported in groundwater. The Ti concentration
profile in the downstream well was modelled using a two-layermedium approach. The delay
used for the TiO2 NPs simulation compared to the Br concentration profiles in the
downstream well indicate that the aggregated TiO2 NPs interacted with the rock. Unlike Br,
NPs do not penetrate the entire pore network during transfer because of electrostatic
2
hydrodynamic conditions, especially where the porosity is very low;NPs with a weak negative
charge can be attachedonto the rock surface, and more particularly onto the positively
charged iron oxyhydroxides coating the main pathways due to natural denitrification.
Nevertheless, TiO2 NPs are mobile and transfer within fracture and fissure media. Any
modification of the aquifer’s chemical conditions is likely to impact the groundwater pH and, the nitrate content and the denitrification process, and thus affect NP aggregation and
attachment.
Highlights
A study of TiO2 NP transfer at a pilot site in a hard-rock aquifer.
The TiO2 NPs were mobile in the schist aquifer and transferred in aggregate form.
Unlike Br, NPs do not penetrate the entire pore network during transfer.
A large amount of NPs was deposited on the aquifer walls in the flow pathways.
Any modification of the aquifer’s chemical condition will impact NP aggregation and sorption.
Keywords: TiO2 nanoparticles, groundwater, hard-rock aquifer, transfer, zeta potential,
3
1. Introduction
Not only are TiO2 nanoparticles (NPs) nowadays one of the most widely produced NPs by
weight with,for example, 4 million metric tons of TiO2 NPs being manufactured worldwide in
2006 (Robichaud et al., 2009), butthe range of their application has expanded very rapidly
over the past decade. Due to their photocatalytic activity (Gaya and Abdullaha, 2008), high
refractive index, high specific surface area and sorption capacity for ionic and non-ionic
species, TiO2 NPs are currently used for industrial and household purposes such as
photovoltaics, ultraviolet blocking sunscreens, self-cleaning surfaces (such as glass), and
antimicrobial, antibiotic and antifungal agents. They are also used as a scavenger of
inorganic and organic contaminants in water treatment plants and for the remediation of
polluted subsurface environments (Pena et al., 2006).
The increasing use of TiO2 NPs is inevitably leading to its introduction into different
environmental compartments, including soil, surface water and groundwater (Ben-Moshe et
al., 2010; Chen et al., 2011; Fang et al., 2013; Holbrook et al., 2013; Johnson et al., 2011;
Lin et al., 2010; Lowry et al., 2010; Reijnders, 2009).Anticipated groundwater contamination
by NPs and their related by-products is expected to occur in different ways, including
accidental events, inappropriate storage of nano-waste, normal aging during regular use, soil
leaching and infiltration after spreading sludge from wastewater treatment, during
groundwater/surface water exchanges and even by direct injection as for remediation
purposes (Bennett et al., 2010; Elliott and Zhang, 2001; Gondikas et al., 2014; Holbrook et
al., 2013; Su et al., 2013). The spread of makeup and sunscreens into surface waters and
swimming pools has been observed to be responsible for the presence of significant
concentrations of manufactured TiO2 NPs in the water (typically >1 g NP per litre of water
[Kaegi et al., 2008]). TiO2 NPs, however, have been classified as potentially cancerous for
humans by the International Agency for Research on Cancer (IARC, 2006), so where
groundwater is widely used for drinking water, any contamination could have an adverse
4
bacteria (Santaella et al., 2014), crustaceans (Fouqueray et al., 2013), mice (Liu et al., 2009;
Ma et al., 2009), plants and human lymphocytes (Ghosh et al., 2010). Consequently, the
potential exposure of TiO2 NPs through groundwater contamination needs to be studied and
assessed.
NPs are characterized by a high surface charge density and a very high surface area to
volume ratio (Leroy et al., 2011; Petosa et al., 2010; Wiesner et al., 2006), with the result that
electrostatic interactions between NPs themselves and between NPs and the surrounding
geogenic material control the complex processes that regulate NP transport and deposition
in natural water (Moore, 2006; Wiesner et al., 2006). Their environmental fate, however, is
highly dependent on their volume fraction in water, on their intrinsic properties such as
solubility, surface properties, zero point charge pH (pHzpc), surface area, crystallinity, shape
and size, as well as on the groundwater’s overall physical and chemical properties (Auffan et al., 2009; Brant et al., 2005; Chen et al., 2012; French et al., 2009; Godinez and Darnault,
2011; Guzman et al., 2006; Keller et al., 2010; Petosa et al., 2012; Shih et al., 2012; Zhang
et al., 2009). Since NPs are rarely in a perfectly dispersed state in natural water (Keller et al.,
2010), their transport behaviour is also dependent on the formation and eventual break-up of
NP aggregates,which are influenced by the flow velocity and interaction energies between
particles (Brant et al., 2005; Fang et al., 2013; Godinez and Darnault, 2011).
In porous media, NP mobility is controlled by the reactive transport properties that affect
NP-rock interactions (Petosa et al., 2010; Solovitch et al., 2010; Tufenkji and Elimelech,
2004); depending on the rock’s surface charge and the flow rate, dispersed nanoparticles can be adsorbed or repulsed in the vicinity of mineral grains. In addition, the rock’s permeability, plus the pore size and organization, will also affect aggregate transport and
deposition. TiO2 NPs aggregates are clearly shown to remain mobile in artificial porous
media despite their aggregation under a wide range of physical and chemical conditions
5
dedicated to TiO2 NP transfer in groundwater along with the wide range of natural physical
and chemical conditions.
Hard-rock aquifers contain major water resourcesand their vulnerability to pollutionis a
crucial issue (Ayraud et al., 2008; Jaunat et al., 2012; Guihéneuf et al., 2014;Pauwels et al.,
2015, among others). The purpose of our study is to investigate the potential transfer of TiO2
NPs in a hard-rock aquifer whosefracture connectivity determines the main pathways for
groundwater flow and whose low ionic strengthis expected to influence the NPs transport.
The groundwater’s low organic content at the study site is expected to limit NP aggregation,with the precipitation of Fe oxyhydroxides in the main pathways after natural
denitrification being the main process affecting NP transport. To the best of our knowledge,
there has so far been no attempt to quantify the mobility of TiO2 NPs in a hard-rock schist
aquifer through an experimental tracer test at a pilot site. Here, we studied the transfer of
TiO2 NPs through a schist aquifer, monitoring the NPs within both the injection and pumping
wells.
2. Site description
The pilot site, located in thesmall Naizincatchment 85 km west of Rennes in Brittany
(France), is underlain by a Precambrian (Brioverian, 530 Ma)schist aquifer (Pellerin and Van
Vliet-Lanoe, 1994). The basin’s hydrogeological system is influenced by the presence of two aquifer compartments,resulting in a variable hydraulic conductivity and porosity (Fig. 1): (1)
the saprolite, or weathered layerfrom the surface to 15 m depth and overlain by surficial
formations (soil and alluvial deposits), is a clay-rich facieswith a mostly interstitial porosity
ensuring the storage function of the aquifercompartment, and (2) the underlying
weathered-fissured zone, showing a lesser degree of weathering and with a dense horizontal
fissuring,grading down into the deep fresh and fractured rock ensuring the transmissive
function of the aquifer. The main permeability in this medium, which can be represented as a
6
regionally inherited from Hercynian and Alpine orogeneses, and it is the fracture connectivity
that mainly controls groundwater flow (Dewandel et al., 2006; Maréchal et al., 2004).
Groundwater abstraction in the catchmentconsists of rare agricultural pumpingand can be
considered negligible compared to the annual recharge (319 mm per year of effective
rainfall).The global groundwater flow direction is from the plateau to the river (from DNS1 to
F1) and is completed by a vertical component from the depth to the surface, and to the river.
In periods of low water levelssuch as the period of the test, water flows downward (Pauwels
et al., 2000).
The groundwater’s chemical composition at the site has been extensively described. Itshows a strong variability from the surface to 15 m depth due to intensive agricultural
activity (Pauwels et al., 2000), whilstin the underlying fissured schist it results from a mixing
between old water and recent denitrified groundwater from the overlying weathered layer
(Ayraud et al., 2008). The groundwater in the underlying fissured schistshows a weak
mineralization (ionic strength of 3
·
10-3 mol.L-1), near neutral pH conditions (6.5 to 7.0) and reductive conditions with a low oxygen content;itslow organic content originates from reactionwith oxygen during its passage through the upper soil and weathered layer. The groundwater
in the schist compartment also appears to be totally denitrified through microbial autotrophic
denitrification between nitrate and pyrite, leading to the production of Fe (II) and subsequent
precipitation of Fe (III) hydroxides or oxides (Boisson et al., 2013; Pauwels et al., 1998; Tarits
et al., 2006)thatcan strongly interact with NPs (Dzombak and Morel, 1990).
3. Material and methods
3.1 Aquifer characterization
The schist, in decreasing relative mass proportions, consists mainly of quartz, muscovite,
7
mineral below 7 m depth and varies between 0.3‰ and 5.0‰ of the dry rock weight. Secondary phases include illite, smectite, kaolinite and various Fe-oxyhydroxides (e.g.
hematite and goethite) and sulphate phases such as jarosite(Pauwels et al., 1998).
The apparent zeta potential (Bouhaik et al., 2013; Crespy et al., 2007; Leroy et al., 2011) of
the schist was measured in the laboratory using streaming potential measurements
(ZetaCad, CAD Instruments, France) at a pH and ionic strength (IS) close to the natural
conditions of the study site’s groundwater (i.e. pH6 and 7, and IS = 1.5
·
10-3 M), and using HCl or NaOH for pH adjustment. The NaCl and CaCl2concentrations were respectively 0.70and 0.28 mM. The measured apparent zeta potential was slightly negative (-6.3 mV at pH6
and -6.1 mV at pH7). Although the schist’smineral compositionis heterogeneous, its surface charge is controlled by the quartz and phyllosilicates. Note that the magnitude of the schist’s apparent zeta potential is low, probably because of the presence of ionized Ca at twice the
positive charge of the ionized Na.
3.2 TiO2 Nanoparticle characterization
The TiO2 NPs used in this study (stock number 39953, anatase, Alfa Aeasar, 32 nm; see
Solovitch et al., 2010)consistedofballs with diameters ranging from 10 to 50 nm,but capable
of forming aggregatesaround 100 nm in sizeas observed by TEM (Hitachi S4500, SEB) on
dry powdered TiO2. XRD analysis (automatized Siemens D5000 diffractometer) showed
anatase, a TiO2 mineral, with trace quantities of rutile. The specific surface area of the TiO2
NPs determined by BET analysis (Tristar 3000, Micromeritics) was 47.6 m2.g-1, consistent
with the 52 m2.g-1 value given by the supplier.
Aggregation tests were conducted in the laboratory to better foresee the NPs aggregation
rateaccording to their concentration in contact with MilliQ water and the schist’s groundwaterpreviously collected and kept in natural conditions (atmosphere-free) and with
ultrasonification or not. The pH corresponding to a TiO2 electrophoretic mobility of zero, pHIEP
8
were added to 30 L of groundwater. To prevent the NPs’ time-dependent aggregation phenomenon, the NP suspension was injected into Well F1 very shortly(~1h) after its
preparation. The size and zeta potential of the TiO2 NPs were measured on site immediately
after mixing with thegroundwater sample prior to injection, and also throughout the
experiment; the apparent zeta potentialwas determined by electrophoretic mobility
measurements using a zetasizerNanoZS (Malvern Instruments). The uncertainty was +/- 3
mV on 3 measures. The average hydrodynamic aggregate diameter was also measured on
site using a zetasizerNanoZSwith the Dynamic Light Scattering (DLS) method. The
polydispersity index (PdI) was used as an indicator of the distribution width. The derived
count rate indicating the intensity of light scattered by the particles was used to follow the
relative evolution of particle concentration in the sampled water.
3.3 Transfer test design
The test consisted in first injectinga conservative tracer solution (NaBr) and then the TiO2
NP suspension directly into the groundwater in order to compare their respective transfers.
The pilot test experiment,outlined in Fig. 1, was conducted using stabilized and continuous
pumping between the injection well, F1, and the downstream pumping well, DNS1, where the
flow rate was stabilized at 2.46
·
10-4 m3.s-1 (except during two short electricity cuts caused by thunderstorms).The upstream injection well F1 is 82 m deep and is screened between 32and 82 m depth, whichrepresentsthe fissured and unweathered part of the aquifer with a
more permeable fracture zone at 70 m depth. The pumping well DNS1, located 15 m
downstream from F1, is 97 m deep and screened between 1 and 97 m. The groundwater
level in DNS1 was first stabilized by pumping for four days at 2.44
·
10-4m3.s-1, after which the groundwater came mainly from fracture flow with a partial contribution through leaching fromthe surficial horizons (Pauwels et al., 2000). The natural Na and Br concentrations measured
in Well F1 before the injection of the NaBr solution were 0.7 and 3.0 µmol.L-1, respectively;
9
fromwell F1 –3kg of NaBr in 50L and 200 g of TiO2 NPs in 30L. To avoid any TiO2
aggregation due to the increased ionic strength induced by the presence of high Na+ and Br
-concentrations resulting from the NaBr injection, a six-day delay was applied between the
NaBrinjection and the TiO2 NP injection to ensure a Br concentration low enough not to
influence the groundwater’s ionic strength. Continuous mixing of the water within the injection well F1 throughout the test period was ensured by recirculation (pumping at 1.4
·
10-3m3.s-1 and re-injection) between 6 and 70 m depth so as to avoid sedimentation at the bottom of thepiezometer. According to the volume of water recirculating (0.63 m3) in the well between 6
and 70 m depth, and assuming that the mixing along the water column due to the pumping
and re-injection was instantaneous, the concentrations of Br and Ti just after their injection
were calculated to be 45 mmol.L-1 (3.6 g.L-1) and 3.8 mmol.L-1 (182 mg.L-1), respectively.
These concentrations correspond to a point-source pollution context (industrial accident
during production, accident during transportation...).
3.4 Water sampling and analysis
The groundwater chemistry was analysed in the injection and downstream wells before the
experiment for cations, anions and dissolved and total organic carbon (DOC and TOC), and
during the experiment for Br and Ti. The groundwater in the injection well was sampled 16 h
after the NP injection, whilst the physical and chemical parameters and the zeta potential and
electrophoretic mobility were monitored throughout the experiment to check the evolution of
the NP suspension. After each injection, the groundwater was sampled from the pumping
well DNS1;during the day this was done manually every hour for the first 4 hours of the
experiment, and then manually every 4 hours for the next 7 days, and at night byautomatic
sampler every 4 hours for the following 7 nights. A total of 74 samples was analysed for Br.
Sampling for the TiO2 NPs was undertaken every 12 h from day 6 to day 15 and then every
24 h from day 16 to day 30; a total of 40 samples was selected for Ti analysis.Measurements
10
oxidation- reduction potential, and dissolved oxygen) were made in situin the field,using
probes throughout the experimentjust after sampling.
For further chemical analysis, the groundwater samples were filtered in the field through
0.45 µm cellulose acetate filters. Those for cation analysis were then acidified by HNO3 at pH
2, whilst those for anion analysis were stored without acidification. The analyses for Ca2+,
Mg2+, Na+ and K+ were carried out by inductively coupled plasma-atomic emission
spectroscopy (ICP-AES, Ultima-2 model, JobinYvon), and those forCl-, SO42- and NO3- by ion
chromatography (model DX120, Dionex). The accuracy of both techniques was greater than5
%, depending upon the concentration. The alkalinity was measured on site by titration with
HCl, and the equivalent point was determined by the Gran method. Aliquots (50 mL) for Br
measurement were filtered through 0.2 µm filters, with the Br- concentration being
determined firstly on site with a Br-electrode, and later in the laboratory by ionic
chromatography (Dionex) with a 5 % uncertainty; the quantification limit (QL) was 1
·
10-3 mmol.L-1. Aliquots (50 mL) for Ti measurement were acidified to pH 2 with suprapurHNO3,the Ticoncentration being determined by ICP-MS ata detection limit of 0.004 µM. TiO2
NP standards were prepared using TiO2anatase NPs diluted with natural water from the
aquifer. The correlation line between the NP-defined standards and the measured Ti
concentrations was good (r2 =0.90). For total organic carbon (TOC) and dissolved organic
carbon (DOC) analyses, respectively, unfiltered and filtered water was collected in brown
glass bottles and acidified with H2SO4;the TOC and DOC were analysed by oxidation with
sodium persulphate.
Despite anaerobic conditions having been characterized in both wells, the pumping in
Well DNS1 induced mixing with oxygenated waterfrom the surficial weathered layer, thus
enhancing the natural partial contribution by leakage of the surficial horizons due to the
downward flow. It thus favored local transient aerobic conditions. Nevertheless, TiO2 NPs are
not affected by groundwater oxido-reductive conditions. Before the experiment, the
11
electricalconductivity was low (225 µS/cm in F1 and 210 µS/cm in DNS1, Table 1). The
dominant cations for wells F1 and DNS1, respectively, were Na+ (0.70and0.75 mmol.L-1)
followed by Mg2+ (0.40and0.38 mmol.L-1) and Ca2+ (0.31and0.24 mmol.L-1),with Cl
-(0.72and0.76 mmol.L-1) and SO42- (0.25 and 0.28 mmol.L-1)beingthe dominant anions;
alkalinity was low (0.7 to 1.0meq.L-1). The NO3- content was very low (respectively below the
quantification limit [QL] and 0.034 mmol.L-1) due to denitrification (Pauwels et al., 2000). The
Br- content was respectively 3.7 and 3.0 µmol.L-1for Well F1 and Well DNS1 (Table 1), with a
geochemical background value at 3.2 µmol.L-1. The ionic strength was 3
·
10-3 M, indicating a low mineralization of water as previously shown by Pauwels et al. (2000). The Ticoncentrations before the experiment were equal to the QL (0.002 µmol.L-1) in both wells.
TOC and DOC were generally low, although slightly higher in Well F1 (respectively 0.20 and
0.14 mmol C.L-1) than in Well DNS1 (<QL).
3.5 Modelling tool
Modelling the Br and TiO2 recovery was done using CATTI (Computer Aided Tracer Test
Interpretation) software (Sauty, 1989) and assuming radial convergent flow between the
upstream and downstream wells along withinstantaneous tracer injection and recirculation.
The flow and solute transports were modelled assuming that the aquifer was homogeneous
and horizontally infinite. In addition we considered that the tracer,under the predominant
influence of the hydraulic gradient imposed by pumping in Well DNS1, propagated through
two different media of contrasted porosities and dispersivities and that the flow rate was
constant.The two media will be hereafter referred to as the fissured medium with slow
12
The transport parameters, i.e. the effective porosity and the longitudinal dispersivity of
each medium, were estimated by fitting the calculated conservative solute breakthrough
curve to the Br experimental breakthrough curve (BTC) using the CATTI’s automatic identification tool based on non-linear least squares estimation methods. Different initial
values of parameters were tested to find the best fitted parameters. The selected ones were
the best we could find corresponding to the highest mass recovery. But because, in the case
of a radial converging flow and transport, no analytical solution existsto exactly calculate the
solute concentration in the downstream well at a given time after injection (Sauty, 1989), an
approximate solution can be used to estimate the solute concentration with time as long as
the Peclet number (Pe) is high enough (>2).
Here,
r
Pe which gives Pe9.4 for the fractured medium (F) and Pe6 for the fissured medium (f) (Sauty et al., 1992). The approximate solution, where the second and third terms
correspond to the concentration in the fractured and fissured media respectively, is:
t t D t u r t D Q r M t t D t u r t D Q r M C t r C Lf f Lf f f LF F LF F F i exp 4 exp 2 exp 4 exp 2 ) , ( 2 2 3 2 2 3where C is the solute concentration, Ci the solute geochemical background concentration
[kg.m3], r the radial distance between the injection and pumping wells [m], t the time [s], M the injected mass in each layer[kg],
Q the pumping rate of the downstream well passing through each layer (QFand Qffor the
fractured and fissured media respectively) [m3.s-1],, the decay rate [s-1] characterised as an exponential decrease function of the shape e-t,
DL the longitudinal dispersion coefficient [m2.s-1] where
D
L
Lu
, with L the longitudinaldispersivity [m] (LF and Lffor the fractured and fissured media respectively) and u the pore
velocity [m.s-1]expressed by h r n Q u
213
fractured and fissured media respectively)[-], and h the aquifer thickness [m](hFand hf, for the
fractured and fissured mediarespectively).
A recovery factor (RF) is used to take into account the unexplained mass losses, where
RF Minj
M *
with ΔMinj the injectedmass in the injection well.
The fate and transport of the TiO2 NPs were then estimated using the previously calculated
aquifer transport parameters (effective porosity, longitudinal dispersivity;Pauwels et al., 1998)
and the experimental results of the NP breakthrough curve. Two specific parameters, i.e. a
recovery factor and a delay term relative to Br behaviour, were used to characterize the TiO2
NP transfer through the schist aquiferand compared to the Br behavior.The concentration is
equal to 0 kg.m3whent trD0, with tr for the real time. Then the concentration is calculated by the equation.
4. Results and discussion
4.1 Hydrological characterization of the aquifer
Hard-rock aquifers are very complex systemsin which the role of fracture connectivity, which
affects both time transfer and chemical processes,isimportant for groundwater flow and
contaminant transport. In the present experiment, the test with Br aimed at a better
characterization of the aquifer medium for evaluating the NP transfer.
After the NaBr injection, the flow rate in Well DNS1 was globally 2.46
·
10-4m3.s-1. The recorded evolution of the Br concentration with time within the injection well is shown in Fig.2. Given that renewal of the entire water volume in the well takes 8 minutes with a
recirculation pumping rate of 1.4
·
10-3 m3.s-1, mixing is instantaneous and the Br concentrations rapidly became homogeneous in samples collected 65 m above the injection14
below the expected concentration, assuming instantaneous mixing (45 mmol.L-1),was most
probably because the Br transfer towards Well DNS1 started very rapidly in the vicinity of the
fracture at 70 m depth where the concentrated Brsolution was injected. The Br concentration
decreased with time, confirming the continuous transfer of the injected solutes within the
aquifer (Fig. 2). Two days after injection, the dilution factor ([Br]injected / [Br]at j+2 ) reached 18.
Fig. 2 also shows that the measured Br concentration and the EC of the water are well
correlated during the first week after Br injection. This confirms that the Br- concentration in
water overrides the natural geochemical background and that EC can be used to probe its
fate during this period (Revil and Glover, 1997). After 6 days, the Br concentration (1 mmol/L)
was still higher than the background level.
The measured Br (mmol.L-1) breakthrough curve in Well DNS1 is shown in Fig. 3; the
time axis at day 0 represents the injection. About 31.3% of the conservative Br tracer was
recovered at Well DNS1 over the total duration of the measurement, meaning that 68.7% of
the tracer was not captured by the applied pumping flow. A temporal flow change due to the pumping stops and rainstorms is supposed to be at the origin of the small second Br peak.
However, part of the missing Br could have arrived after the end of the experiment as a result
of diffusion through the non-active porosity, as indicated by the EC value which still remained
higher than the initial measurement after 30 days of test (270 > 225 µS.cm-1). Moreover,
although the surface charge of the schist is slightly negative, the Br- ions can interact with the
positive surface charges present in minor quantity such as iron oxides and oxyhydroxide. A
Br early breakthrough is therefore not expected. Ultimately, part of the missing Br must also
have been transported in pathways that do not converge towards Well DNS1.
The simulated BTC corresponds to the superposition of the transport rates through the
lesser and the more conductive zones, respectively. We took into account the distance
between Well F1 and Well DNS1 (15.20 m) and the entire aquifer thickness (50 m),
whichincludes two media of equal thickness (25 m)as defined by Pauwels et al. (1998);one
15
large fissures (fractures) in which solute transport would be relatively fast, as represented by
the major fracture at 70 m depthin Well F1. No solute exchange between the two media was
taken into account. The parameters were calibrated manually and the parameters giving the
best shape of the BTC and the best mass recovery are presented here. The final BTC is thus
the sum of each medium’s BTC. The superposition of the measured Br-BTC on the two breakthrough curves appears to be an adequate approximation of the general
behaviorconfirming that the two different pathways converge towards the downstream well
DNS1,which is in agreement with previous studies (Pauwels et al., 1998). The transport
parameters (effective porosity and dispersivityof each medium) were then fitted to the Br
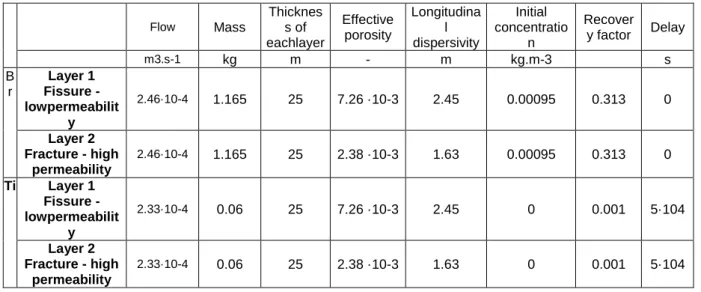
breakthrough curvesusing a recovery factor of 31.3% as previously described. The other
parameters described in Table 2 are taken from the simulation ofPauwels et al. (1998) and
defined by the experiment (i.e layer thickness, injected mass, flow rate, background
concentration).
Inthe Br-BTC, the estimated effective porosities in the simulated Br-BTCare low (<1%).
The calculated porosity of the slow transport medium (0.73%) isthree times higher than that
of the fast transport medium (0.24%), in agreement with representative data for schist (de
Marsilly, 1981). The longitudinal dispersivity calculated by the model for the slow transport
medium is also higher than for the fast transport medium, and thisby a factor of 1.5 (i.e. 2.5
vs. 1.6 m). The result can be explained by the textural heterogeneity of the schist which is
characterized by a set of more or less conductive fracture and fissure zones (Dewandel et
al., 2011; Maréchal et al., 2004) inducing a high heterogeneity of transport paths between the
two wells; in effect, water connectivity is dependent on the geometrical properties of the
fracture network. The hydraulic conductivity of the fissures in the weathered-fissured faciesis
lower than that of the fissures in the fresh rockfacies due to possible closure and filling with
clay materials or iron oxides. When the transport occurs through the connected fractures or
16
Conversely, transport within the small, poorly connectedand less conductive fissures is very
slow and dispersivity is high. This implies a long-term restitution of the Br within the pumping
well at very low concentrations that could remain in the range of the natural background
concentration (3 µmol.L-1).
4.2 Evolution of the TiO2 NP suspension in the injection well water (F1)
During laboratory tests, TiO2 NPs (0.035 mg.L-1) were diluted in MilliQ water and in
groundwater from well F1. A quick aggregation was pointed out after mixing with the natural
groundwater, i.e. an average size of 2780 to 4170 nm at pH 7, with a polydispersity index of
0.5-0.6. Similarly, the hydrodynamic size of the TiO2 NPs increased dramatically when
diluted in the water (50 L) just collected from Well F1 (Fig. 4) as opposed to MilliQ water, with
values between 1700 and 3500 nm (approximate mean of 3070 nm) anda weakly negative
zeta potential at -13.2 mV (electrophoretic mobility [EM] = -0.93 µm s-1
·
V-1 cm; Table 3). Because of the low Na concentration in the Well F1 groundwater, which is significantly lowerthan the critical coagulation concentration of 1-4
·
10-2 M for pH 8 (Solovitch et al., 2010), the rapid aggregation was probably related to the presence of significant concentrations ofdivalent counter-ions, in particular Ca2+ (0.31 mmol.L-1), and to the groundwater pH of
6.5-6.9,which is close to the 5.5 pHIEP of TiO2 NPs (Belen Romanello and Fidalgo de Cortalezzi,
2013; Liu et al., 2011; Praetorius et al., 2014).
The average scattered intensity (derived count rate) recovered with each DLS size
measurement in the water decreased with time, suggesting a decreasing NP concentration
and thus the settling outof TiO2 NPs from the suspension(Table 3). The intensity at 1.5 h
following the NP injection was 138650 kcps (as against the natural groundwater background
of 6645 to 9700 kcps); it decreased to 75900 kcps after 16 h and returned to the natural
background level of 6650 kcps after 72 h. The size distribution measured in these samples
17
average size decreased slightly from 3.0 to 1.3 µmduring the first 30 minutes,suggesting that
the largest particles were progressively and preferentially removed from the water. Several
hypotheses can be suggested to explain this trend: settling, filtering, and passage through
the pumps or breakage through shearing due to the water recirculation in the well and to the
vertical flowin the well (Riley et al., 2011) or the lateral flow in the fracture. But according to
Stokes’ law in the absence of agitation (Lamb, 1994), 6 µm-diameter particles would drop by only 10 m depth within 56 hours, assuming a mass density of 4 g.cm-3 for the TiO2 and a
dynamic viscosity of 1.13
·
10-3 Pa s at 14°C for the water. Thus settling of the largest aggregates under the test conditions is unlikely because the continuous circulation within thewell would have enabled the large aggregates to reach shallow levels of the water column. In
contrast, the shear rate induced by the fluid flow through Well F1 might have played a
significant role. Considering a well of 11.2 cm diameter and a flow rate of 1.4
·
10-3 m3.s-1, the resulting shear rate would be 10 s-1. The related dissipation energy is likely to causefragmentation and/or erosion of the largest NP aggregates that had formed (Zahnow et al.,
2011) and thus to lead to the lower measured average size (Bouyer et al., 2005). Finally, the
NPs were injected at the depth of a large fracture which size is unknown (Fig. 1) to limit the
consequences of possible spreading in the well.
It is unlikely that natural organic matter (NOM) played a role here on the NP dispersion by
creating additional steric and repulsive electrostatic forces between the NPs (Belen
Romanello and Fidalgo de Cortalezzi, 2013; Chen and Elimelech, 2007; Labille and Brant,
2010; Labille et al., 2012; Praetorius et al., 2014). The apparent zeta potential of the NPs did
not, in fact, evolve during the experiment (-16 mV after 1 h of mixing, -14.9 mV after 72 h).
Moreover, the DOC and TOC concentrations were very low compared to usual observed
effects (Keller et al., 2010) and their slight decrease after the NP injection was more likely
due to natural variations (e.g. 9 months before the test the DOC and TOC were <QL ).
Finally, a grey deposition observed on the well casing and piping at the end of the
18
passage through the pumps (recirculation and abstraction) and mixing in the well. Although
this loss remains difficult to quantify, the chemical monitoring of water within the injection well
proves the persistence of TiO2 NPs in the water available for transfer towards the pumping
well.
4.3 TiO2 NP transport in the schist aquifer
The measured Ti (µmol.L-1) breakthrough curve is plotted as concentrations versus time
(day) in Fig. 5. Even though the NP injection occurred six days after the Br injection, the
figure provides a comparison between the Br transport and that of the TiO2 NPs in the
hard-rock aquifer. A low, but measurable, fraction of Ti ranging from <QL to 0.033 µmol.L-1 was
recovered 2.5 days after the NP injection in Well DNS1. The TiO2 NP breakthrough curve
indicates the presence of two peaks during the first 12 days after the NP injection and the
appearance of a small bulge at around 16 days after injection (Fig. 5). The latter is mostly
attributed to the entry of rainwater after rainfalls. Furthermore, a delay is observed between
the increases in the Br and Ti concentrations in the water of Well DNS1. The chemical and
physical processes responsible for NP transport in porous media are known to be very
complex due to NP-NP, NP-rock and NP-indigenous particles interactions, which themselves
depend on the various surface charges, the pore network structure and connectivity, the size
and shape of the NP aggregates, the solid NP and rock compositions, the groundwater’s chemical composition and the hydrodynamic conditions (Bouhaik et al., 2013; Dewandel et
al., 2011; Petosa et al., 2010; Tufenkji and Elimelech, 2004; Yang et al., 2013).
The behavior of the TiO2 NP in the aquifer wasidentified using the CATTI software. Features
that retard the NP motion, such as weak and reversible interactions of TiO2 NPs with the rock
and structural factors (dispersivity, porosityfor each medium),are taken into account by a
delay term, whilst irreversible NP deposition (attachment, pore clogging, sedimentation)is
19
dispersivitiesfor the simulated Ti-BTC were fixed from the Br-BTC modellingfor each medium.
The final BTC for such a heterogeneous mediumis a superposition of the two BTCs
corresponding to the two main circulation zones that were simulated by the Br and TiO2
BTCs. The fitted curve (Fig. 5) was obtained by applying a recovery factor of 0.1(see Section
4.4) with a delay termof 0.58 day. This small delay termrepresenting the mass losses of Ti
can be attributed to a part remaining unexplained as for Br and to the physical-chemical
reactivity of the NPs likely to interact with the surrounding schist. The optimized parameters
(Ti-mass recovery factor, delay) confirm that, in a given fracture/fissure, the TiO2 NPs were
reactive and not necessarily transferred along the same pathways;unlike the conservative Br
tracer, they do not penetrate the entire pore network during transfer, especially where the
porosity is very low, due to electrostatic interactions between the NP aggregates and
therockand also to the aggregate size and the hydrodynamic conditions(Solovitch et al.,
2010; Huber et al., 2012). The transport behaviour of TiO2 NPscan be considered as
hydrodynamic-dependent, especially when forming aggregates around µm in size. One could
expect that not only would the aggregated NPs be more liable to mechanical deposition in
pore spaces than the dispersed NPs, but also that they would migrate more rapidly through
preferential pathways toward the farther end pointsas the capacity of large aggregates to
penetrate the pore network is less than that of a single NP due to their size. The motion of
suspended particles where hydrodynamic streamlines are concerned depends on their
aggregation state and fractal dimensions. Porous aggregates exhibit a low drag coefficient,
favouring their deposition onto surfaces, whereas individual NPs would preferentially follow
streamlinesthrough the pore network (Solovitch et al., 2010; Veerapaneni and Wiesner,
1996). If this was the case in the present study, we should expect the mobile NPs to have
followed preferential pathways and breakthrough more rapidly than the Br, and at the same
time be subject to reversible NP-rock attachmentthat may be reversible. These assumptions
are consistent with the observed NP restitution peak, which is delayed and narrower
20
4.4 TiO2 NP loss in the schist aquifer
The Ti mass (0.065 %) was calculated from the sum of the Ti recovered masses overthe total
amount of injected Ti(120 g). It is in the same order of magnitude as the recovery factor
(0.1%) in the TiO2 breakthrough curve simulation. By comparison, the conservative tracer
was characterized by a Br mass recovery factor of 31.3%. As already indicated, aloss of TiO2
NPs at the injection well probably contributed to the restitution difference between the Br and
the TiO2 NPs.
Different phenomena are likely to contribute to the high deposition rate of TiO2 NPs along
the largest and well-connected fissures. Firstly, the measured aggregation of the NPs
certainly favours mechanical filtering through fissures and fractures of the schist media,
implying decreasing deposition with distance from injection (Solovitch et al., 2010; Tufenkji
and Elimelech, 2004; Tufenkji and Elimelech, 2005). Secondly, the charge heterogeneity of
the schist due to its mineral composition is a key factor controlling the deposition of NPs on
mineral surfaces (Torkzaban et al., 2010; Tufenkji and Elimelech, 2005). TiO2 NPs are
weakly negatively charged under the groundwater’s pH conditions and the apparent zeta potential value of the schist is also weakly negative, although this results from a mixing of
positively and negatively charged mineral surfaces. In effect, the point of zero charge of the
schist’s major primary and secondary minerals is low, implying negatively charged surfaces within the aquifer under the groundwater pH conditions (6.5-6.9). Both the fresh and the
weathered-fissured schist are made up of quartz (pHPZC = 2-3 [Leroy et al., 2013]), K-feldspar
(pHPZC = 2.0 to 2.4), kaolinite (pHPZC = 2-4 [Leroy and Revil, 2004; Tombacz and Szekeres,
2006]) and chlorite (pHPZC = 3 [Yin et al., 2013]), as well as other minerals, such as iron
oxidesand oxyhydroxides, characterized by a basic pHPZC close to 8 (Dzombak and Morel,
1990). These latter minerals are positively charged at a pH of around 7 and are likely to
favour electrostatic attraction between the NPs and the Fe-oxide surfaceswith a resultant
21
an important adsorption potential due to their high specific surface area (Dzombak and
Morel, 1990) and sowe can assume that a certain amount of TiO2 NPs could also be
attachedby electrostatic attraction onto the Fe oxyhydroxides. The local geochemical
conditions of the schist aquifer, favouring denitrification and subsequent iron oxyhydroxide
precipitation or presence ascolloids in the main water pathways due to pyrite and Fe2+
oxidation by nitrates(Pauwels et al, 2000),are likely to enhance attenuation mechanisms by
reducing contamination levels during the NPs migration through the aquifer.
TiO2 NPs can also be favourably attachedin the weathered parts of the aquifer; in the
present case theweathered saprolite facies of the schist has a porosity that is solicited by
pumping in Well DNS1. The weathering products of the saprolite are likely to give different
reactions; for example, attachmentof the NPs will be enhanced by the presence of iron
oxyhydroxides,whereas electrostatic repulsion of the NPs will be favoured by clay minerals
that are mostly negatively charged at a pH of around 7 (Fig. 1). Although the role played by
the weathered part of the aquifer was not studied due to the NPs being injected at a depth of
70 m in the aquifer, the unsaturated weathered facies and its thickness will nevertheless play
a significant role as regards the aquifer’s vulnerability by reducing the downward migration speed of water and contaminants through the medium (Brouyère et al., 2004).Finally, a more
detailed study is underway to explore the role of the different minerals with respect to the
attachmentprocess, with experiments of TiO2 NP circulation through fresh schist cores from
the same aquifer (Ollivier et al., in prep).
5. Conclusions
The physical and chemical processes responsible for NP transport in porous media are very
complex due to NP-NP and NP-rock interactions, which themselves depend on the various
surface charges, the pore network structure and connectivity, the groundwater’s chemical composition and the hydrodynamic conditions.
22
Our small-scale tracer experiment conducted in a schist aquifer is an attempt to
understand the physical and chemical processes occurring should TiO2 NPs happen to
penetrate a hard-rock aquifer. One of the major results is that the TiO2 NPs were found to be
mobile, transferringin an aggregate form through the conductive zones of a heterogeneous
schist. During the transfer, a large amount of the NPs was also deposited onto the rock
surface through sedimentation, clogging and attachment. The natural denitrification process
occurring in the aquifer is responsible for the presence of precipitated and positively charged
iron oxyhydroxides in the main flow pathsthat are capable of adsorbing a large amount of
negatively charged TiO2 NPs. It is worth noting that NP attachmentcan bereversible due to
the possible evolution of the surface charge of the different minerals constituting the schist
rock according to the environmental conditions. For instance, any modification of the
aquifer’s chemical conditions may impact the pH and the denitrification process, as well as the heterogeneity of the schist. Regional changes in agricultural practicesthat lead to a lower
nitrate input could typically play a role in TiO2 NP transfer.
As a first approach, our workconfirms both the potential for TiO2 NPs to be transported in
natural groundwater and the vulnerability of the hard-rock aquifer. Further investigations,
currentlyin preparation,are required for a better understanding of the processes occurring
during NP transfer, including the role of the different minerals with respect to sorption
processes. Other questions to be addressed concern the evolution of NP aggregates during
transport due to dilution and interaction with organic matter or to shearing energy. Longer
experiments aimingat studying the release of NPs deposited within the aquifer are also
required. The increased knowledge from such field experiments is also dependent on the
evolution of analytical techniques both for NP measurements, particularly at very low NP
concentrations, and on-site measurements.
23
This work was supported by the French National Agency for Research (ANR; grant number
PNANO ANR-07-NANO-035) and the BRGM through the AquaNano project. C. Crouzet of
the BRGM laboratories is thanked for providing experimental and monitoring facilities, and T.
Laurioux is thanked for the ICP-MS measurements. We also kindly thank Dr. Natacha
Solovitch for her help with streaming potential measurements, as well as the three
anonymous reviewers for their thorough revisions of the manuscript.We are grateful to
Patrick Skipwith for revising and editing the English text.
References
Auffan, M., Rose, J., Wiesner, M.R. and Bottero, J.-Y., 2009. Chemical stability of metallic nanoparticles: A parameter controlling their potential cellular toxicity in vitro. Environmental Pollution, 157(4): 1127-1133.
Ayraud, V.,Aquilina, L., Labasque, T., Pauwels, H., Molenat, J., Pierson-Wickmann, A-C.,Durand, V., Bour, O., Tarits, C., Le CVorre, P., Fourre, E., Merot, P. and Davy, P., 2008. Compartmentalization of physical and chemical properties in hard-rock aquifers deduced from chemical and groundwater age analyses. Applied Geochemistry, 23(9): 2686-2707.
Belen Romanello, M. and Fidalgo de Cortalezzi, M.M., 2013. An experimental study on the aggregation of TiO2 nanoparticles under environmentally relevant conditions. Water Research, 47(12): 3887-3898.
Ben-Moshe, T., Dror, I. and Berkowitz, B., 2010. Transport of metal oxide nanoparticles in saturated porous media. Chemosphere, 81(3): 387-393.
Bennett, P., He, F., Zhao, D.Y., Aiken, B. and Feldman, L., 2010. In situ testing of metallic iron nanoparticle mobility and reactivity in a shallow granular aquifer. Journal of Contaminant Hydrology, 116(1-4): 35-46.
Bouhaik, I.S., Leroy, P., Ollivier, P., Azaroual, M. and Mercury, L., 2013. Influence of surface conductivity on the apparent zeta potential of TiO2 nanoparticles: Application to the modeling of their aggregation kinetics. Journal of Colloid and Interface Science, 406: 75-85.
Bouyer, D., Coufort, C., Liné, A. and Do-Quang, Z., 2005. Experimental analysis of floc size distributions in a 1-L jar under different hydrodynamics and physicochemical conditions. Journal of Colloid and Interface Science, 292(2): 413-428.
Boisson, A.,de Anna, A., Bour, O., Le Borgne, T., Labasque, T. and Aquilina, L., 2013. Reaction chain modeling of denitrification reactions during a push–pull test. Journal of Contaminant Hydrology, 148(0): 1-11.
Brant, J., Lecoanet, H. and Wiesner, M.R., 2005. Aggregation and deposition characteristics of fullerene nanoparticles in aqueous systems. Journal of Nanoparticle Research, 7(4-5): 545-553.
Brouyère, S., Dassargues, A. and Hallet, V., 2004. Migration of contaminants through the unsaturated zone overlying the Hesbaye chalky aquifer in Belgium: a field investigation. Journal of Contaminant Hydrology, 72(1–4): 135-164.
24
Chen, G., Liu, X. and Su, C., 2011. Transport and Retention of TiO2 Rutile Nanoparticles in Saturated Porous Media under Low-Ionic-Strength Conditions: Measurements and Mechanisms. Langmuir, 27(9): 5393-5402.
Chen, G., Liu, X. and Su, C., 2012. Distinct Effects of Humic Acid on Transport and Retention of TiO2 Rutile Nanoparticles in Saturated Sand Columns. Environmental Science & Technology, 46(13): 7142-7150.
Chen, K.L. and Elimelech, M., 2007. Influence of humic acid on the aggregation kinetics of fullerence (C60) nanoparticles in monovalent and divalent electrolyte solutions. Journal of Colloid and Interface Science, 309: 126-134.
Crespy, A., Boleve, A. and Revil, A., 2007. Influence of the Dukhin and Reynolds numbers on the apparent zeta potential of granular porous media. Journal of Colloid and Interface Science, 305(188-194).
de Marsilly, G., 1981. Hydrogéologie quantitative, Ed. Masson, Paris, 215 p pp.
Dewandel, B., Lachassagne, P., Wyns, R., Maréchal, J. and Krishnamurthy, N., 2006. A generalized 3-D geological and hydrogeological conceptual model of granite aquifers controlled by single or multiphase weathering. Journal of Hydrology, 330 ((1-2)): 260-284.
Dewandel, B., Lachassagne, P., Zaidi, F.K. and Chandra, S., 2011. A conceptuel hydrodynamic model of a geological discontinuity in hard rock aquifer: Example of a quartz reef in granitic terrain in South India. Journal of Hydrology, 405: 474-487. Dzombak, D.A. and Morel, F.M.M. (Editors), 1990. Surface Complexation Modeling: Hydrous
Ferric Oxide.
Elliott, D.W. and Zhang, W.-x., 2001. Field Assessment of Nanoscale Bimetallic Particles for Groundwater Treatment. Environmental Science & Technology, 35(24): 4922-4926. Fang, J., Xu, M.-j., Wang, D.-j., Wen, B. and Han, J.-y., 2013. Modeling the transport of TiO2
nanoparticle aggregates in saturated and unsaturated granular media: Effects of ionic strength and pH. Water Research, 47(3): 1399-1408.
Fouqueray, M., Noury, P., Dherret, L., Chaurand, P., Abbaci, K., Labille, J., Rose, J. and Garric, J., 2013. Exposure of juvenile Danio rerio to aged TiO2 nanomaterial from sunscreen. Environmental Science and Pollution Research, 20(5): 3340-3350.
French, R.A.,Jacobson, A.R., Isley, S.L., Penn, R.L. and Baveye, P.C., 2009. Influence of ionic strength, pH, and cation valence on aggregation kinetics of titanium dioxide nanoparticles. Environmental Science & Technology, 43(5): 1354-1359.
Gaya, U.I. and Abdullaha, A.H., 2008. Heterogeneous photocatalytic degradation of organic contaminants over titanium dioxide: a review of fundamentals, progress and problems Journal of Photochemistry and Photobiology C: Photochemistry Reviews, 9(1): 1-12. Ghosh, M., Bandyopadhyay, M. and Mukherjee, A., 2010. Genotoxicity of titanium dioxide
(TiO2) nanoparticles at two trophic levels: Plant and human lymphocytes. Chemosphere, 81(10): 1253-1262.
Godinez, I.G. and Darnault, C.J.G., 2011. Aggregation and transport of nano-TiO2 in saturated porous media: effects of pH, surfactants and flow velocity. Water Research 45, 45: 839-851.
Gondikas, A.P.,von der Kammer, F., Reed, R.B., Wagner, S., Ranville, J.F. and Hofmann, T.,2014. Release of TiO2 Nanoparticles from Sunscreens into Surface Waters: A One-Year Survey at the Old Danube Recreational Lake. Environmental Science & Technology, 48(10): 5415-5422.
Guihéneuf, N.,Boisson, A., Bour, O., Dewandel, B., Perrin, J., Dausse, A., Viossanges, M., Chandra, S., Ahmed, S. and Maréchal, J.C., et al., 2014. Groundwater flows in weathered crystalline rocks: Impact of piezometric variations and depth-dependent fracture connectivity. Journal of Hydrology, 511: 320-334.
Guzman, K.A.D., Taylor, M.R. and Banfield, J.F., 2006. Environmental risks of nanotechnology: National nanotechnology initiative funding, 2000-2004. Environmental Science & Technology, 40(5): 1401-1407.
25
Holbrook, R.D.,Motabar, D., Quinones, O., Standford, B., Vanderford, B. and Moss, D., 2013. Titanium distribution in swimming pool water is dominated by dissolved species. Environmental Pollution, 181(0): 68-74.
Huber, F.,Enzmann, F., Wenka, A., Bouby, M., Dentz, M. and Schäfer, T., 2012. Natural micro-scale heterogeneity induced solute and nanoparticles retardation in fractured crystalline rock. Journal of Contaminant Hydrology, 133: 40-50.
IARC, 2006. Agents Classified by the IARC Monographs. WHO. Volumes 1-109.
Jaunat, J.,Huneau, F., Dupuy, A., Celle-Jeanton, H., Vergnaud-Ayraud, V., Aquilina, T., Labasque, T. and Le Coustumer, P, 2012. Hydrochemical data and groundwater dating to infer differential flowpaths through weathered profiles of a fractured aquifer. Applied Geochemistry, 27(10): 2053-2067.
Johnson, A.C.,Bowes, M.J., Crossley, A., Jarvie, H.P., Jurkschat, K., Jürgens, M.D., Lawlor, A.J., Park, B., Rowland, P., Spurgeon, D., Svendsen, C., Thompson, I.P., Barnes, R.J., Williams, R.J and Xu, N., 2011. An assessment of the fate, behaviour and environmental risk associated with sunscreen TiO2 nanoparticles in UK field scenarios. Science of The Total Environment, 409(13): 2503-2510.
Kaegi, R.,Ulrich, A., Sinnet, B., Vonbank, R., Wichser, A., Simmler, H., Brunner, S., Vonmont, H., Burkhardt, M. and Boller, M., 2008. Synthetic TiO2 nanoparticle emission from exterior facades into the aquatic environment. Environmental Pollution, 156(2): 233-239.
Keller, A.A.,Wang, H., Zhou, D., Lenihan, S.H., Cherr, D., Cardinale, B.J., Miller, R. and Ji, Z., 2010. Stability and Aggregation of Metal Oxide Nanoparticles in Natural Aqueous Matrices. Environmental Science & Technology, 44(6): 1962-1967.
Labille, J. and Brant, J., 2010. Stability of nanoparticles in water. Nanomedicine, 5(6): 985-998.
Labille, J., Pelinovskaya, N., Botta, C., Bottero, J.Y. and Masion, A., 2012. Fate of Manufactured Nanoparticles in Aqueous Environment: Effects and Persistence of the Surface Functionalization in a Lifecycle Perspective. Example of Nano-TiO2 Used in Sunscreens, Encyclopedia of Nanotechnology. Springer Science+Business Media B.V.
Lamb, H., 1994. Hydrodynamics (6th edition). Cambridge University Press, England: 768 p. Leroy, P. and Revil, A., 2004. A triple layer model of the surface electrochemical properties
of clay minerals. Journal of Colloid Interface Science, 270(2): 371-380.
Leroy, P., Tournassat, C. and Bizi, M., 2011. Influence of surface conductivity on the apparent zeta potential of TiO2 nanoparticles. Journal of Colloid and Interface Science, 356(2): 442-453.
Leroy, P., Devau, N., Revil, A. and Bizi, M., 2013. Influence of surface conductivity on the apparent zeta potential of amorphous silica nanoparticles. Journal of Colloid and Interface Science, 410: 81-93.
Lin, D., Tian, X., Wu, F. and Xing, B., 2010. Fate and Transport of Engineered Nanomaterials in the Environment. J. Environ. Qual., 39(6): 1896-1908.
Liu, H.T.,Ma, L., Zhaq, J., Yan, J., Ruan, J. and Hong, F., 2009. Biochemical Toxicity of Nano-anatase TiO2 Particles in Mice. Biological Trace Element Research, 129(1-3): 170-180.
Liu, X.Y., Chen, G.X. and Su, C.M., 2011. Effects of material properties on sedimentation and aggregation of titanium dioxide nanoparticles of anatase and rutile in the aqueous phase. Journal of Colloid and Interface Science, 363(1): 84-91.
Lowry, G.V., Hotze, E.M., Bernhardt, E.S., Dionysiou, D.D., Pederson, J.A., Wiesner, M.R. and Xing, B., 2010. Environmental Occurrences, Behavior, Fate, and Ecological Effects of Nanomaterials: An Introduction to the Special Series. Journal of Environmental Quality, 39(6): 1867-1874.
Ma, L.L., Zhao, J.F., Wang, J., Liu, J., Duan, Y.M., Liu, H.T., Li, N., Yan, J.Y., Ruan, J., Wang, H. and Hong, F.S.,2009. The Acute Liver Injury in Mice Caused by Nano-Anatase TiO2. Nanoscale Research Letters, 4(11): 1275-1285.
26
Maréchal, J.C., Dewandel, B. and Subrahmanyam, K., 2004. Use of hydraulic tests at different scales to characterize fractures. Water Resources Research 40(40): 17. Martelat, A. and Lachassagne, P., 1995. Basin versant représentatif du Coët Dan (Naizin,
Morbihan), hydrologie : détermination des caractéristiques hydrodynamiques du système aquifère au lieu-dit le Stimoes. Unpublished BRGM report, n° R38474DR/HYT95, 54 p.
Moore, M.N., 2006. Do nanoparticles present ecotoxicological risks for the health of the aquatic environment? Environment International, 32(8): 967-976.
Pauwels, H., Kloppmann, W., Foucher, J.C., Martelat, A. and Fritsche, V., 1998. Field tracer test for denitrification in a pyrite-bearing schist aquifer. Applied Geochemistry, 13(6): 767-778.
Pauwels, H., Foucher, J.C. and Kloppmann, W., 2000. Denitrification and mixing in a schist aquifer: influence on water chemistry and isotopes. Chemical Geology, 168(3-4): 307-324.
Pauwels, H., Négrel, P., Dewandel, B., Perrin, J., Mascré, C., Roy, S. and Ahmed, S., 2015. Hydrochemical borehole logs characterizing fluoride contamination in a crystalline aquifer (Maheshwaram, India). Journal of Hydrology, 525(0): 302-312.
Pellerin, J. and Van Vliet-Lanoe, B., 1994. Cadre géomorphologique du bassin du Coët Dan et du Haut Evel (Morbihan): Rapport sur les travaux de cartographie et de stratigraphie. Unpublisched report, University of Brest.
Pena, M., Meng, X.G., Korfiatis, G.P. and Jing, C.Y., 2006. Adsorption mechanism of arsenic on nanocrystalline titanium dioxide. Environmental Science & Technology, 40(4): 1257-1262.
Petosa, A.R., Jaisi, D.P., Quevedo, I.R., Elimelech, M. and Tufenkji, N., 2010. Aggregation and Deposition of Engineered Nanomaterials in Aquatic Environments: Role of Physicochemical Interactions. Environmental Science & Technology, 44(17): 6532-6549.
Petosa, A.R., Brennan, S.J., Rajput, F. and Tufenkji, N., 2012. Transport of two metal oxide nanoparticles in saturated granular porous media: Role of water chemistry and particle coating. Water Research, 46(4): 1273-1285.
Praetorius, A.,Labille, J., Scheringer, M., Thill, A., Hungerbühler, K. and Bottero, J-Y., 2014. Heteroaggregation of Titanium Dioxide Nanoparticles with Model Natural Colloids under Environmentally Relevant Conditions. Environmental Science & Technology, 48(18): 10690-10698.
Reijnders, L., 2009. The release of TiO2 and SiO2 nanoparticles from nanocomposites. Polymer Degradation and Stability, 94(5): 873-876.
Revil, A. and Glover, P.W.J., 1997. Theory of ionic-surface electrical conduction in porous media. Physical Review B, 55(3): 1757-1773.
Riley MS, Tellam JH, Greswell RB, Durand V, Aller MF. Convergent tracer tests in multilayered aquifers: The importance of vertical flow in the injection borehole. Water Resources Research 2011; 47: n/a-n/a.
Robichaud, C.O., Uyar, A.E., Darby, M.R., Zucker, L.G. and Wiesner, M.R., 2009. Estimates of Upper Bounds and Trends in Nano-TiO2 Production As a Basis for Exposure Assessment. Environmental Science & Technology, 43(12): 4227-4233.
Santaella, C.,Allainmat, B., Simonet, F., Chanéac, C., Labille, J., Auffan, M., Rose, J. and Achouak, W.,2014. Aged TiO2-Based Nanocomposite Used in Sunscreens Produces Singlet Oxygen under Long-Wave UV and Sensitizes Escherichia coli to Cadmium. Environmental Science & Technology, 48(9): 5245-5253.
Sauty, J.P., 1989. Computer Aided-Tracer Tests Interpretation. L'interpretation des tracages assistée par ordinateur. Mode d'emploi de CATTI. Version 2.0. Logiciel distribue par IGWMC (International Groundwater Modeling Center).
Sauty, J.P., Kinzelbach, W. and Voss, A., 1992. CATTI, Computer Aided Tracer Test Interpretation Program Documentation. BRGM - Gesamthochschule Kassel Universität: 64 p.
27
Shih, Y.-h., Zhuang, C.-m., Peng, Y.-h., Lin, C.-h. and Tseng, Y.-m., 2012. The effect of inorganic ions on the aggregation kinetics of lab-made TiO2 nanoparticles in water. Science of The Total Environment, 435: 446-452.
Solovitch, N.,Labille, J., Rose, J., Chaurand, P, Borschneck, D. and Wiesner, M, 2010. Concurrent Aggregation and Deposition of TiO2 Nanoparticles in a Sandy Porous Media. Environmental Science & Technology, 44(13): 4897-4902.
Su, C.,Puls, R.W., Krug, T.A., Watling, M.T., O’Hara, S.K., Quinn, J.W. and Ruiz, N.E., 2013. Travel distance and transformation of injected emulsified zerovalent iron nanoparticles in the subsurface during two and half years. Water research, 47: 4095-4106.
Tarits, C.,Aquilina, L., Ayraud, V., Pauwels, H., Davy, P., Touchard, F. and Bour, O., 2006. Oxido-reduction sequence related to flux variations of groundwater from a fractured basement aquifer (Ploemeur area, France). Applied Geochemistry, 21(1): 29-47. Tombacz, E. and Szekeres, M., 2006. Surface charge heterogeneity of kaolinite in aqueous
suspension in comparison with montmorillonite. Applied Clay Science, 34: 105-124. Torkzaban, S., Kim, Y., Mulvihill, M., Wan, J. and Tokunaga, K., 2010. Transport and
deposition of functionalized CdTe nanoparticles in saturated porous media. Journal of Contaminant Hydrology 118: 208-217.
Tufenkji, N. and Elimelech, M., 2004. Deviation from the classical colloid filtration theory in the presence of repulsive DLVO interactions. Langmuir, 20(25): 10818-10828.
Tufenkji, N. and Elimelech, M., 2005. Breakdown of colloid filtration theory: Role of the secondary energy minimum and surface charge heterogeneities. Langmuir, 21(3): 841-852.
Veerapaneni, S. and Wiesner, M.R., 1996. Hydrodynamics of fractal aggregates with radially varing permeability. J. Colloid Interface Sci., 177: 45-57.
Wiesner, M.R., Lowry, G.V., Alvarez, P., Dionysiou, D. and Biswas, P., 2006. Assessing the Risks of Manufactured Nanomaterials. Environmental Science & Technology, 40(14): 4336-4345.
Yang, X., Deng, S. and Wiesner, M.R., 2013. Comparison of enhanced microsphere transport in an iron-oxide-coated porous medium by pre-adsorbed and co-depositing organic matter. Chemical Engineering Journal, 230: 537-546.
Yin, X., Yan, L., Liu, J., Xu, Z. and Miller, J.D., 2013. Anisotropic surface charging of chlorite surfaces. Clays and Clay Minerals, 61(2): 152-164.
Zahnow, J.C., Maerz, J. and Feudel, U., 2011. Particle-based modeling of aggregation and fragmentation processes: Fractal-like aggregates. Physica D: Nonlinear Phenomena, 240(9-10): 882-893.
Zhang, Y., Chen, Y., Westerhoff, P. and Crittenden, J., 2009. Impact of natural organic matter and divalent cations on the stability of aqueous nanoparticles. Water Research, 43(17): 4249-4257.
28
Figure caption
Fig.1: Cross section illustrating the injection well F1 and the downstream pumping well DNS1
during the tracer test experiment (adapted from Pauwels et al., 1998). The diagram highlights
the presence of a deep major fracture at 70 m depth in Well F1 (thick black line) and the
main expected Br and NP pathways.
Fig.2: Measured Br concentration (mmol.L-1) in Well F1 groundwater versus time during the
Br-tracer test. “EC” stands for electrical conductivity. The Br geochemical background value corresponding is 3·10-3mmol.L-1.
Fig.3: Experimental data and modelling of Br concentrations versus time in the downstream
pumping well, DNS1. The Br geochemical background value is 3·10-3 mmol.L-1 (in grey).
Fig.4: Size distribution of the TiO2 NPs in MilliQ water, in the injection solution, and in Well F1
groundwater after injection.
Fig.5: Experimental data and modelling of Ti concentrations versus time in the downstream
Well DNS1. The Tigeochemical background value is 0.002 µmol.L-1 (indicated in grey) and
the quantification limit is 0.002 Ti µmol.L-1.
29
Table 1: Apparent physical and chemical composition of the groundwater in wells F1 (injection) and DNS1 (pumping). TiO2 NP injection was made 6.1
days after Br injection.
Well EC (25 °C) µS.cm -1 pH T °C Dissol ved O2 mg.L -1L Alk, meq.L-1 Na mmol.L-1 K mmol. L-1 Ca mmol.L-1 Mg mmol L-1 Cl mmol.L-1 NO3 Mmol.L-1 SO4 mmol. L-1 Ti µmol. L-1 Br µmol .L-1 TOC mmol.L -1 DOC Mmol. L-1C F1 24 h before Br injection 225 6.94 12.4 0.7 1.08 0.70 0.03 0.31 0.40 0.72 <0.008 0.25 0.002 3.7 0.2 0.14 F1 1h before NPs injection 272 6.84 13 0.87 1.01 0.03 0.31 0.40 - <0.008 - 0.001 942 0.06 0.06 F1 16h after NPs injection 282 6.65 13.7 3.06 0.93 1.12 0.03 0.32 0.41 0.81 0.008 0.27 - 434 0.06 0.06 DNS1 24h before Br injection 210 6.54 13.7 5.9 0.71 0.75 0.03 0.24 0.38 0.76 0.034 0.28 0.002 3.0 <0.04 <0.04 DNS1 16 h after NPs injection 221 6.39 13.2 6.1 0.72 0.78 0.03 0.24 0.38 0.76 0.016 0.27 0.001 21 <0.04 <0.04