HAL Id: hal-00429224
https://hal.archives-ouvertes.fr/hal-00429224
Submitted on 2 Nov 2009HAL is a multi-disciplinary open access archive for the deposit and dissemination of sci-entific research documents, whether they are pub-lished or not. The documents may come from teaching and research institutions in France or
L’archive ouverte pluridisciplinaire HAL, est destinée au dépôt et à la diffusion de documents scientifiques de niveau recherche, publiés ou non, émanant des établissements d’enseignement et de recherche français ou étrangers, des laboratoires
Electron Holography study of the local magnetic
switching process in MTJs
Elsa Javon, Christophe Gatel, Aurélien Masseboeuf, Etienne Snoeck
To cite this version:
Elsa Javon, Christophe Gatel, Aurélien Masseboeuf, Etienne Snoeck. Electron Holography study of the local magnetic switching process in MTJs. Journal of Applied Physics, American Institute of Physics, 2010, 107, pp.09D310. �10.1063/1.3358219�. �hal-00429224�
Electron Holography study of the local magnetic switching process in MTJs
E. Javon1,2, C.Gatel1,2, A. Masseboeuf1,2, E.Snoeck1,2,
1 - CNRS; CEMES ; BP 94347, F-31055 Toulouse Cedex, France
2 - Université de Toulouse ; UPS ; CEMES ; BP 94347, F-31055 Toulouse Cedex, France
Abstract
We present an electron holography experiment enabling the local and quantitative study of magnetic properties in magnetic tunnel junction. The junction was fully characterized during the switching process and each possible magnetic configuration was highlighted with magnetic induction maps. No magnetic coupling was found between the two layers. We plot a local hysteresis loop that was compared with magnetometry measurement at the macroscopic scale confirming the validity of the local method.
Introduction
Different techniques may be used for the local study of magnetic properties in nanosystems
like spin polarised scanning tunnelling microscopy, magnetic force microscopy or Lorentz
microscopy. Electron holography (EH) allows a unique combination of the high spatial resolution of
transmission electron microscopy (TEM) with the capability to quantitatively analyse local
magnetic configurations [1, 2]. These EH capacities are particularly useful to record local magnetic
map during switching processes and to plot the corresponding local hysteresis loop.
We used EH to investigate the magnetic configurations of an epitaxial
Au/Co/Fe/MgO/FeV/MgO(001) magnetic tunnel junction (MTJ) grown by molecular beam epitaxy.
This MTJ exhibits a giant tunnel magneto-resistance (TMR) of about 200% at RT [3]. The TMR
properties appear when the magnetic configuration of the two FeV and Fe/Co magnetic layers
switches from parallel to antiparallel arrangement. The aim of this article is to locally map the
magnetic configurations of the MTJ during the magnetization reversal and to reconstruct the
hysteresis loop from quantitative information obtained by EH.
Experiments
The study has been performed using a FEI Tecnai F-20 microscope (200 kV) equipped with
a field emission gun and a Cs corrector. Holograms were acquired with the specimen in a field free
region in the TEM column by turning off the main objective lens and using the first transfer lens of
the Cs corrector like an objective lens [4]. Thin samples were prepared in cross-sectional geometry
using the usual mechanical polishing then precision ion polishing method.
The in-situ magnetization was done by switching on the main objective lens with a slight
excitation current in order to create a magnetic field of µ0H= 0.33 T along the optic axis of the
microscope without distorting the resulting image. The sample was then progressively tilted in order
and therefore can be neglected in our experiment. The coercive fields of the [Fe/Co] hard and FeV
soft ferromagnetic layers are 18 mT and 2 mT respectively. Tilting from -13° to 13° corresponds to
the application of an in plane magnetic field between ± 45 mT on the sample, which is thus
sufficient to achieve the magnetic reversal processes of the whole MTJ and the investigation of the
whole hysteresis loop. Electron holograms were then recorded with a varying in-plane magnetic
field.
EH is an interferometric technique which gives access to the phase shift of an electron wave
that has interacted with magnetic and electrostatic potentials. This phase shift is directly related to
the electro-magnetic fields in the sample as described by the Aharonov-Bohm effect:
z)dxdz (x, B e z)dz V(x, C = E
y ΔΦ [1]. In that one dimensional expression, “x” is lying
perpendicular to the electron beam (in our experiment “x” is in the plane of the sample
perpendicular to the Co/Fe/MgO/FeV interfaces), and “z” is parallel to the electron beam. CE is an
electron energy related constant and V is the electrostatic potential produced by the sample. “By” is
the magnetic induction component perpendicular to both “x” and “z”. The electrostatic contribution
to the phase shift is directly proportional to the mean inner potential (MIP) of the sample and to its
thickness if the MIP is constant along the electron wave path (as in our case). In order to isolate the
magnetic component of the phase shift we acquired two holograms obtained with magnetization
saturated in two opposite directions. We then have extracted a reference MIP phase image from
holograms recorded at +13° and -13° which was then used to extract the magnetic contribution for
each tilt angle: mag y
MIPréf
e dxdz B
( ) ( ) ) ( Results and discussion
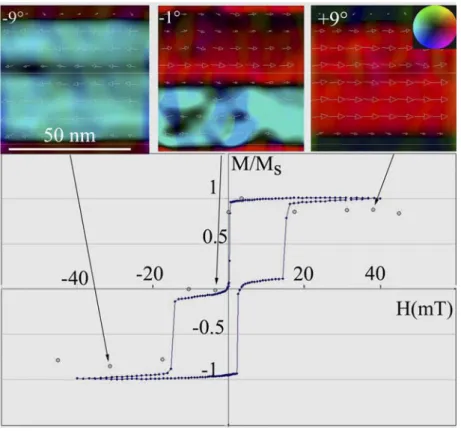
Two examples of the phase images corresponding to the magnetic contribution to the phase
two layers can be obtained calculating the derivatives: ( mag) y t. B x and ( mag) xt. B y (t being
the sample thickness) and are reported in Figure 1 (b) and (c). They indicate that the magnetic
induction is only running parallel to the layers (Bx = 0) and that for +9° tilt the magnetizations in the
two Fe/Co and FeV layers are parallel while, for -1° tilt, there are antiparallel. We thus can get the
magnetic configuration change of the MTJ for each step of the switching process.
In order to obtain quantitative results we have calculated the values of relative magnetization
for each magnetic configuration. The same area has been selected in each “By” map and the values
of all pixels of the “By” components have been summed to get: I
tpixels y
B . This sum is related to
the magnetic induction along “y” and to the sample thickness. We then can use the MIP profile to
get the shape of the sample thickness. It indicates an expected wedge shape of the sample along “x”
with a linear slope of 0.95. The total intensity “I” does not give information about the real
magnetization but enable us to compare the global magnetization of the junction for all the steps
during the switching process. The evolution of “I” as a function of the tilt (i.e. the applied field) has
been superimposed on the same plot than the hysteresis loop measured on the macroscopic sample
by VSM (vibrating sample magnetometer). These two plots are reported in Figure 2. Experimental
points from EH measurements match fairly well the VSM hysteresis loop. The coercive fields of the
soft (FeV) and hard (Fe/Co) layers measured by EH agree with the ones measured by VSM. No
dipolar coupling between the layers that could occur due to the thin sample preparation for TEM
and EH studies are evidenced. Furthermore, the local configuration at -1° tilt (i.e. 3.5 mT) shows
the appearance of dark contrast within the FeV layer corresponding to zero magnetisation
(antiparallel configuration within the layer along the optical axis) or a magnetization oriented
parallel to the optic axis after the switching started. It corresponds to the reversal of magnetic
The agreement between measurements extracted from holography study and VSM shows
that electron holography is a powerful tool to investigate the magnetic configurations of magnetic
nanomaterials and nanosystems like MTJs. Hysteresis loop along any directions can be
reconstructed from a series of maps and give quantitative values on the magnetic properties as
coercive field. The main advantage of the technique is to couple the measurement and the image
showing the magnetic configuration. This technique brings local information which can not be
deduced from a simple hysteresis loop.
Acknowledgement
The authors acknowledge financial support from the European Union under the Framework
6 program under a contract for an Integrated Infrastructure Initiative. Reference 026019 ESTEEM
and from the French ANR program “Spinchat” N°: BLAN07-1_ 188976. F. Bonell and S. Andrieu
are acknowledged for providing the MTJ samples.
References
[1]: R.E.Dunin-Borkowski, M.R.McCartney, D.J.Smith, Electron Holography of Nanostructured
Materials, Encyclopedia of nanoscience and nanotechnology, 10, 1-59, 2003.
[2]: M.Heumann,T.Uhlig and J.Zweck, True Single Domain and Configuration-Assisted of
Submicron Permalloy Dots observed by Electron Holography, Phys. Rev. Lett 94, 077202, 2005.
[3]: F.Bonell, S.Andrieu and al., MgO Epitaxial Magnetic Tunnel Jonctions using FeV electrodes,
Proceeding IMM, 2009.
Figure captions
Figure 1: (a) Magnetic phase contribution to the phase shift. (b) “x” derivative of the magnetic phase images mapping the “y” components of the induction. (c) “y” derivative of the magnetic phase images mapping the “x” components of the induction.
Figure 2: Superimposition of the normalized magnetization M/MS as a function of the applied magnetic field obtained by VSM (blue dots) and EH (pink dots). Corresponding vectorial map of the magnetization are given for 3 values of the tilt i.e. of the applied magnetic field (Inset top right: the color scale showing the direction and intensity of the magnetic induction)