HAL Id: hal-00622831
https://hal.archives-ouvertes.fr/hal-00622831
Submitted on 12 Sep 2011HAL is a multi-disciplinary open access archive for the deposit and dissemination of sci-entific research documents, whether they are pub-lished or not. The documents may come from teaching and research institutions in France or abroad, or from public or private research centers.
L’archive ouverte pluridisciplinaire HAL, est destinée au dépôt et à la diffusion de documents scientifiques de niveau recherche, publiés ou non, émanant des établissements d’enseignement et de recherche français ou étrangers, des laboratoires publics ou privés.
The effects of airline alliances: What do the aggregate
data say?
Philippe Gagnepain, Pedro Marin
To cite this version:
Philippe Gagnepain, Pedro Marin. The effects of airline alliances: What do the aggregate data say?. SERIES Journal of the Spanish Economic Association, 2010, 1, pp.251-276. �hal-00622831�
The e¤ects of airline alliances: What do the
aggregate data say?
1Philippe Gagnepain,
2Pedro L. Marín
February 23, 2010
Abstract: We consider an empirical model of worldwide airline alliances that we apply to a large set of companies for the period 1995-2000. Using observations at the network level, we estimate a cost, capacity, and demand system that accounts for cross-price elasticities. Our contribution consists in evaluating airlines’strategical interactions through the window of …rms’ network interconnections. We consider networks coinci-dences and potential connections with all their rivals. The results allow us to classify all company pairs as either complements or substitutes. We shed light on the fact that many airlines involved in the same alliance are potential substitutes. Keywords: Alliance, airline, cross-price elasticities. JEL: L11, L13, L41.
1Both authors are members of the CEPR. We would like to thank Pedro Mira and two anonymous
referees for very helpful comments. We are also grateful to Jordi Jaumandreu for very constructive discussions, as well as Quim Beltrán for superb research assistance. Finally, funding from the Fundación Ramón Areces and Ministerio de Educación y Ciencia (SEJ2004-00670 and SEJ2007-66268) is gratefully acknowledged.
2Corresponding author. Departamento de Economía, Universidad Carlos III de Madrid, C/
1
Introduction
Using aggregate data at the airline level, we analyze worldwide airline alliances. We sug-gest that airlines inside alliances cut prices by 5% on average. We also propose an empirical model that allows us to evaluate to which extent two airlines’networks are substitutes. We suggest that a signi…cant number of airlines enrolled in the same alliances o¤er services which can be considered as substitutes, and this could lead to anti-competitive practices. We also evaluate price cost margins for each alliance and shed light on whether these margins obey some Nash pricing behavior.
There is increasing evidence suggesting that strategic alliances between otherwise in-dependent …rms have become commonplace in a wide variety of industries. According to Oster (1994), a strategic alliance could be de…ned as an arrangement in which two or more …rms combine resources outside the market in order to accomplish a particular task or set of tasks. In the airline industry, deregulation has triggered several waves of alliances between worldwide airlines. Alliances between airlines are mainly designed to achieve ‡eet rationalization, expansion and rationalization of network structure as well as greater exploitation of cost economies. In particular, international airlines have the opportunity to extend their networks to foreign countries by entering an alliance agreement with a for-eign airline. By coordinating their services or production processes, alliance partners can o¤er greater convenience to consumers, including access to connecting services, greater e¢ ciencies and procedural operations in ticketing, ground handling and baggage handling, expanded route networks and connecting options.
Airlines can engage as well in cooperative pricing, while enjoying antitrust immunity. Strategic alliances in the airline industry have attracted more antitrust attention than any others.1 Many types of alliances have been adopted by airlines, ranging from agreements
that involve relatively little cooperation such as frequent ‡yer programs to agreements commonly known as code sharing practices that involve the sharing of costly assets such as planes, terminals, counters, crews and more (see Oum and Park, 1997, for more details on the forms of alliances in the airline industry). Code sharing arrangements have been until very recently the most popular form of alliance adopted by airlines. In this case, two companies operating two connecting routes o¤er an interline trip that is ticketed as
1The European Commission Article 81 and 82 Treaty states that the Commission can exempt an
alliance if it considers that the economic e¢ ciencies and overall bene…ts of the transaction outweigh the anti-competitive e¤ects.
if the two components were served by one single airline.
Economic studies focusing on the e¤ect of airline alliances on welfare have identi…ed various counter powered e¤ects. Oum, Park, and Zhang (1996), Brueckner and Whalen (2000), Brueckner (2001 and 2003), and Whalen (2007) among others have focused on the competitive e¤ects of international alliances. Bamberger, Carlton and Neumann (2004) among others have investigated domestic alliances. These authors suggest that, if the corresponding networks of the alliance members o¤er the possibility of connecting many routes, they can be regarded as complements. In this case, …rms cooperate on routes that were not individually served before, but are created by connecting networks. Accordingly, after the alliance, both prices and costs will fall and both buyers and sellers will be better o¤. In contrast, if the corresponding networks of alliance members used to overlap for a large number of routes, they can be regarded as substitutes (parallel alliances). In this case, the …rms share planes on routes that they both used to served individually. This results in softer competition, and therefore, higher prices.
In this paper, we empirically analyze whether the network of individual alliance mem-bers is a substitute or a complement for the other alliance member’s network. To do so, we estimate a cost, capacity, and demand system for airline companies, accounting for cross-price elasticities. Estimating demand entails proposing a original procedure in the speci…c context of the airline industry that allows us to reduce the number of cross price elasticity parameters to be estimated. In particular, we account for connecting and overlapping route between airlines’ networks. We use annual aggregate data on …rms’ balance sheets, capacity and demand levels for all the international alliances that were operating between 1995 and 2000.
We also test for the e¤ects of alliances on airlines’ aggregate prices and costs. We con…rm that being a member of an alliance entails cutting prices signi…cantly with respect to airlines from outside alliances. However, we do not …nd any signi…cant e¤ect of the alliances on airlines’ operating costs. Finally, we retrieve cost and demand parameters, construct marginal costs, and derive price-cost margins for each airline and alliance. We want to test whether some general pricing behavior can be observed at the airline level, i.e., we test whether pricing policies by airlines correspond to Nash pricing. Our results suggest that companies outside the alliances su¤er from lower price-costs margins than those within alliances, even if, on average, they set higher prices.
The rest of the paper is organized as follows: The next section presents a discussion of the data we use and the associated methodology. Section 3 proposes to construct airlines’ network substitution indexes. Section 4 presents the basic capacity, demand and cost ingredients which are inherent to our airline model. Section 5 focuses on the empirical implementation of the model. In particular, functional forms and the estimation procedure are presented. We develop in this section the procedure we use in order to model the price demand interactions between the di¤erent companies’ networks of our dataset. Section 6 discusses our estimation procedure. In particular, we present the instruments we use to proxy airlines’fares in the demand equation. Section 7 is dedicated to the description of the dataset and the construction of the variables. Section 8 presents the estimation results. Section 9 proposes an evaluation of competitive forces in the industry. Finally, Section 10 concludes.
2
Discussing the data and the model
In what follows we specify a model of airlines’ behavior that entails estimating the in-ternational demand faced by each airline as well as its technology. The ideal modelling approach consists in working at the airline-route level. This approach has been followed by Borenstein (1989), Oum, Park, and Zhang (1996), Brueckner and Whalen (2000), Brueck-ner (2001 and 2003), or Whalen (2007), where a speci…c market is an origin destination pair. Given that airlines take di¤erent price and capacity decisions on each market they operate, working at the airline-route level allows the researcher to observe and account for each market characteristics such as the number and identity of the competitors, the length of the route, or the prices of each product available.
In this paper, we are interested in shedding light on alliance e¤ects on airlines’behavior at a more aggregate level, i.e., at the airline level. Our motivation is twofold: First, the researcher focusing on non-U.S. airlines is usually constrained by the quality of the data available, which makes any work at the airline-route level unfeasible.2 Second, we aim
2Data at the airline-route level are provided by the U.S. Department of Transportation. The database
allows observing only interline trips where at least one route segment is ‡own on a U.S. airline. This implies for instance that it contains information on the United-Lufthansa or United-SAS pairs, but it does not on the routes jointly operated by Lufthansa and SAS. Data at the airline-route level for airlines outside the U.S. are in general very limited. For instance, the world air transport statistics published by the International Civil Aviation Organization (ICAO) and the Air Transport Association (IATA) do not contain observations on ticket prices at the route level.
at advocating the idea that airlines may take corporate and strategic decisions at the entire network level. An airline enters an alliance in order to expend its network overseas to destinations points that it could not reach otherwise, because of the high …xed costs induced, or because most countries do not permit cabotage by foreign companies. The decision of an airline to join an alliance and eventually …nd appropriate solutions to reorganize its productive structure a¤ects its operating costs and the demand it faces at the network level. Airlines serve a large number of interconnected routes that form a network. Sometimes consumers buy a company’s service in one single route (what is known as a direct ‡ight) but very often they buy sets of (normally two or three) interconnected routes (indirect ‡ights through one or two hubs). Additionally, when buying a ticket in an individual route, frequent consumers take into account the company’s network size and characteristics, since this a¤ects the ‡exibility to make further interconnections if needed, exchange tickets, take alternative routes and even enjoy frequent ‡yer prizes and discounts. Scope economies among routes and network e¤ects (almost) impose a common policy to all the routes served by a given airline.3
In other words, we aim at proposing a di¤erent approach based on aggregate data which attempts to derive lessons at the airlines’network level rather than the route level. We propose two main contributions: First, we test for the impact of the formation of alliances on airlines annual prices and costs. We suggest that price reductions due to alliances are strong enough so that they can be identi…ed through annual prices. We …nd no empirical evidence however of a direct e¤ect of alliances on airlines’ operating costs. Second, we propose an original demand framework that accounts for the intensity of competition in each airline’s main hub. In particular, we account for the proportions of overlapping and connecting route kilometers between two airlines’ main hub. We identify a substitution index cut-o¤ above which two airlines’networks can be considered as substitutes.
The dataset has been constructed for the period 1995-2000 from raw data included in Digest of Statistics published by International Civil Aviation Organization (ICAO), World Air Transport Statistics published by International Air Transport Association (IATA), and Economic Outlook published by the Economics and Statistics Department of the
Or-3This type of aggregate approach has been mostly used by authors measuring the e¤ects of the
European airline deregulation on airlines’ costs reductions. This is the case for instance in Good et al. (1993), Neven et al. (1996 and 2001), Röller and Sickles (2000), Marín (1998), and Gagnepain and Marin (2006).
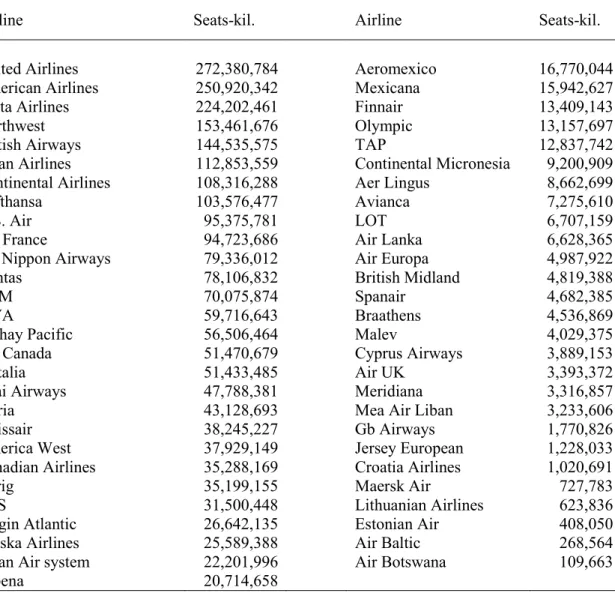
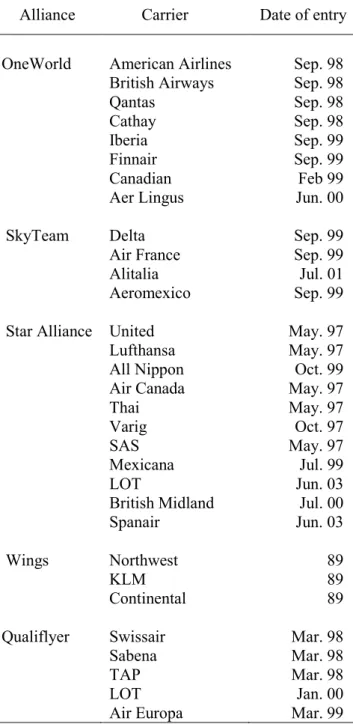
ganization for Economic Cooperation and Development (OECD) as well as airlines annual reports. The companies under study are worldwide airlines with special attention to the U.S. and the E.U. airlines, which usually constitute the main alliance partners. Some of the airlines belong to international alliances and some others operate as independent airlines. The dataset includes observations for a total of 55 airlines, as shown in table 1. Table 2 presents a list of the di¤erent alliances members.
3
A measure of network substitution
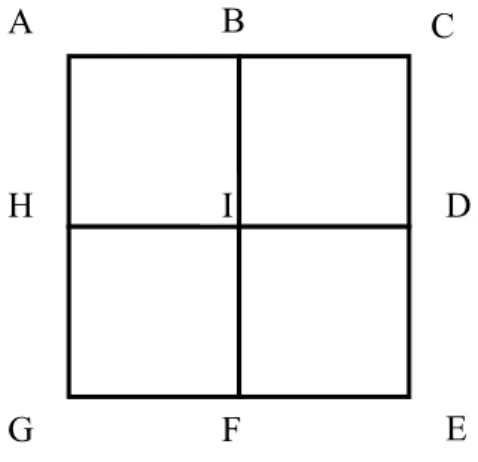
We propose a methodology based on airlines’ total networks. We de…ne …rst in this section a measure of substitution between two airlines’networks. To illustrate our aim, we present an example in Figure 1, where …ve airlines operate services on …ve networks. Some networks have no overlapping routes: This is the case for instance of network 1 and 2, which have a city (I) in common, but no overlapping routes. These two networks are said to be complements. As the number of overlapping route kilometers between two networks increases, so does the degree of substitutability between them. Networks 1 and 3 have one route in common; in particular, they share two cities, B and I. Networks 1 and 4 have two routes in common, given that they both operate at cities B, I, and H. Finally, networks 1 and 5 share all routes (cities A, B, I, and H), which makes them perfect substitutes.
Hence, counting the number of route kilometers that two networks have in common allows us to derive a substitutability index between two networks. This in turn enables us to shed light on the degree of substitutability between two (average products of) airlines. Note however that, due to data restriction, we do not have detailed information on the activity of airlines on each route they operate. We are nevertheless able to observe airlines’ operations in their respective hub. This is a potential drawback, since we do not observe the entire activity of an airline, but we are con…dent that the observation of airlines’ activity through their hubs provides a fair instrument, as the hub is the center of gravity of airlines’operations.4
In …gure 2, we illustrate how the measure of the airlines’network substitutability can
4If a carrier has several hubs (which is the case of many American carriers), the most important hub
in terms of supply is accounted for. A detailed description of all companies’hubs as well as the level of supply operated from each of them is available upon request.
be translated at the level of airlines’hubs. Consider two airlines 1 and 2 with respective hubs H1and H2;from which they operate their services. In 2.a., the number of overlapping
routes between 1 and 2 is at its minimum level, i.e., airline 1 (2 resp.) does not propose any service in 2’s (1’s resp.) network besides the route that links H1 and H2. The two
airlines’services are said to be complementary in this case, and it is very much alike the case of networks 1 and 2 in Figure 1. In 2.b., Airline 1 (2 resp.) may decentralize a share of its operations to H2 (H1), increasing thus the degree of substitutability between
1 and 2’s operations. This situation is similar to the networks pairs 1-3 and 1-4 above. Finally, in 2.c., both companies’ hubs coincide, setting the degree of substitutability of both activities at the maximum level, as in the case of the network pair 1-5 above.
We construct our substitution index as follows: Consider two airlines i and j. We suggest that the degree of substitutability (complementarity resp.) between the total operations of two airlines i and j increases (decreases resp.) with the share of route kilometers departing from i and j’s hubs and that i and j have in common. De…ne Oij as airline i’s hub route kilometers also served by airline j. Likewise, de…ne Oji as
airline j’s hub route kilometers also served by airline i. Moreover, denote as Ti (Tj) the
total hub route kilometers for airline i ( j). Hence, the substitution index is de…ned as Oi j =
(Oij+Oji)
(Ti+Tj) : Note that a higher degree of substitution between i and j implies
therefore that Oi j increases.
We proceed in a similar fashion to construct a complementarity index between both airlines i and j. De…ne as Cij the quantity of airline i’s hub route kilometers not served
by airline j; and Cji the quantity of airline j’s hub route kilometers not served by airline
i. Provided with these components it is possible to de…ne Ci j =
(Cij+Cji)
(Ti+Tj) : Hence, a
higher degree of complementarity between i and j implies therefore an increase of Ci j.
Moreover, Ci j = 1 Oi j.
From our 55 airlines, we determine all the possible airline pairs. Out of the 1485 possibilities, 444 pairs are characterized by overlapping activities. We calculate the sub-stitution index Oi j for each of them. Table 3 presents a list of the 87 airline pairs with
the highest indexes. Some of these airline pairs present high substitution indexes because they operate from the same hub. This is the case for instance of All Nippon and Japan airlines (Hub: Tokyo), British Airways and Virgin Atlantic (Hub: London), Aeromexico and Mexicana (Hub: Mexico City), or Air Europa and Spanair (Hub: Madrid). Other
pairs operate from distinct hubs located in the same domestic markets: Delta and TWA (Hubs: Atlanta and St Louis), and Air Canada and Canadian Airlines (Toronto and Cal-gary) for instance. Finally, one observes pairs of airlines with distinct hubs located in di¤erent countries. High substitution indexes in this case imply that these airlines op-erate a signi…cant share of their total activity in their competitor’s hub. Examples are Qantas and Thai (Hubs: Sydney and Bangkok), and British Airways and United (Hubs: London and Chicago).
Determining whether two airlines’ operations can actually be considered as substi-tutes or complements requires the de…nition of a substitution index cut-o¤. This can be achieved through the estimation of a demand function for world airlines’operations, which constitutes the core of the analysis presented in this paper.
4
Cost, capacity, and demand
An airline o¤ers a speci…c capacity determined by the total number of seats available in the airplanes, and the total mileage performed. Based on this supply and prices, consumers make optimizing travel decisions that consist of a particular number of trips. Hence, as already suggested by numerous authors, passenger-trips are not as much under the control of operators, and airlines are concerned by the capacity to produce a potential for trips (See Berechman, 1993). In other words, costs and revenues are driven by two di¤erent variables that are closely related. It is thus crucial to disentangle the capacity supplied, Q, and the level of transport services requested by the customers, q.
Since the capacity supplied must at least meet the highest peaks of tra¢ c, demand never saturates the network capacity on average. On the other hand, the capacity must be adjusted to the level of demand, so the former is endogenous to the latter. Here we do not present a complete model of optimal provision of transport services. Instead, we simply introduce a reduced form of a technical adjustment process between capacity and demand according to the relation that we specify as follows:
Qi = (qi; ); (1)
where is a vector of parameters to be estimated. This equation just approximates how engineers adjust the network size and structure to the demand level on annual basis.
For the speci…cation of the demand function, we follow the classical guidelines. As-sume that from conAs-sumer n’s indirect utility associated with the consumption of air transportation we can derive the individual long-run demand function:
qi(pi; pj; mi; ); i = 1; :::; N; j 6= i; (2)
where is a vector of parameters. Firm i’s aggregate demand qi depends on its own
price, pi, competitors’prices pj, as well as market exogenous characteristics mi. A limited
number of competitors meets in each route, with the combination of competitors changing from one route to another. Di¤erent competitors supply alternative products which di¤er in time schedule, number of stops, availability of interconnections with other ‡ights, etc. In addition, at the two ends of each route start other routes that can be served by the same or a di¤erent set of airlines. Accordingly, the services o¤ered by di¤erent airlines can be regarded either as imperfect substitutes or complements. By assuming the same pricing policy for all the routes served by one company, we are implicitly saying that pj
represents the price asked by the di¤erent …rms in the market, and this price accounts for the fact that the routes served by …rms are complements or substitutes of those served by …rm i. The price elasticity associated with this reduced-form demand corresponds to an estimate of the long-run elasticity, when capacity has been fully adjusted.
Moreover, airlines are endowed with a given technology. In order to provide a given amount of service, Qi, an airline must buy variable inputs, namely, labor, Liand materials,
Mi, which productivity depends on network exogenous characteristics, zi. The production
process and its underlying technology can be implemented through a long-run dual cost function. Denoting by wL and wM the price of labor and materials, the cost function is:5
Ci = C(Qi; !i; zi; t; ALLi; ); (3)
where t is a trend, and is a vector of parameters denoting technology. Note moreover that we test for the alliance e¤ect on the company’s costs. ALLi is a dummy variable
that takes value 1 if the observed airline is part of an alliance, and 0 otherwise.
Our econometric model comprises three equations in a block-recursive structure, so
5We originally estimated a long run cost function where capital was regarded as a variable input.
Accordingly, a measure for the price of capital was computed from the companies’accounting data and included in the cost function. This variable was not signi…cant at any con…dence level.
that each equation can be estimated separately. The lower level provides the demand of transport that explains the demand (usage) of transport in terms of the transportation price, which is endogenous, and needs to be proxied. We will go back to this point below. The middle level is constituted by Equation (1) that provides a relationship between demand and capacity (or supply). This equation just says that, at each period, one can identify the engineering function that has been used to set up the network structure in terms of size. The upper level is made of the cost function, which relates cost to capacity and to other elements like the inputs prices and the e¤ect of alliances.
Note that we do not attempt to estimate …rms’pricing strategy simultaneously with our aforementioned equations. The reason is that, since we work at the aggregate level, making any assumption on the “average” pricing conduct of airlines would not help to improve the quality of our estimates. We will provide further discussion on this aspect in Section 9.
5
Empirical implementation
The next step consists in proposing speci…c functional forms for our three equations. In particular, we explain how our demand function identi…es the cross price e¤ects between each pair of airlines observed in our database.
The demand equation corresponding to (2) is speci…ed in linear form as follows
qi = 1i+ 2ipi+
X
j6=i
i jpj + m mi+ uqi, i; j = 1; :::; N; (4)
where uqi is an error term. Notice that we allow the intercept 1i and the own-price
e¤ects 2i to vary across airlines. Moreover, we account for …rms’ cross-price speci…c
e¤ects i j. These characteristics imply a matrix of own and cross-price e¤ects @p@qi
j that
can only be estimated imposing some constraints. Following the approach suggested by Jaumandreu and Lorences (2002), we assume that own-price and cross-price e¤ects must follow some pattern.
First, we assume that the intercept and the total own-price e¤ect of each airline are proportional to the size of its own network. Accordingly, we de…ne 1i = 0 + 1N ETi
size of its operations.
Second, the total cross-price e¤ect of a rival j depends on the extent to which j’s network is a substitute or a complement to i’s network. We therefore weight airlines’ coincidences and potential connections with all their rivals. In particular, we de…ne i j =
3 Oi j+ 4 Ci j, where 3 and 4 are the common cross-price e¤ects and Oi j and Ci j
are the two overlapping and connecting indexes de…ned above. We expect 3 and 4 to be
positive and negative respectively, i.e., a higher proportion of overlapping route kilometers Oi j (connecting route kilometers Ci j resp.) between two airlines i and j makes it more
likely for these airlines to be substitutes (complements resp).
De…ning po
ij = Oi j pj, and pcij = Ci j pj, expression (4) can be transformed into an
equation with only two cross-price parameters 3 and 4 to be estimated,
qi = 0+ 1N ETi+ 2N ETipi+ 3 X j6=i poij + 4 X j6=i pcij + m mi+ uqi, i; j = 1; :::; N: (5)
Note that the whole matrix of own and cross-price e¤ects can be recovered from this estimation for a given set of values of N ETi, the Oi j and Ci j variables, and the
coe¢ cients. Moreover, we de…ne the cut-o¤ value Oi j from which two airline i and airline j can be considered as substitutes: We need i j > 0, i.e., Oi j > Oi j = 3 4 4.
Likewise, two airlines are complements when Oi j < Oi j = 3 4 4.
We turn now to the two other equations. We assume a Cobb-Douglas speci…cation for the cost function in (3). This speci…cation retains the main properties desirable for a cost function and provides a su¢ ciently precise description of the technology, while remaining tractable for our purpose.6 The cost function is then speci…ed as
Ci = 0 !Li1!
2
M iQ
3
i ziexp( t t + AALLi+ uci) (6)
where uci is an error term. Homogeneity of degree one in input prices is imposed, i.e., 1 + 2 = 1. We assume that zi includes measures of airlines’network size, N ETi, and
average stage length, ASLi,7 and has the following shape: 6See Marín (1998) for details on the same choice for the airline industry
zi = N ETi 4 ASLi5: (7)
Note that the average stage length measures the length of the average route operated by an airline while the network size adds the lenght of all routes of the airline’s network. With respect to the relationship between demand, qi, and supply, Qi, represented in (1),
we assume the following functional form,
Qi = 0 qi1 exp(uQi); (8)
where uQi is an error term.
6
Estimation
We estimate the sequential system of equations (5), (6) and (8). Since prices pi in the
demand equation (5) are endogenous, we need to …nd some instruments. We use as instruments for pi a trend t, the national private consumption in the airline’s country of
origin, P RIVi, the size of population of the airline’s country of origin, P OPi, wages !Li,
a measure of competition COM Pi, and a dummy indicating whether the airline belongs
to an alliance or not, ALLi (All these variables are discussed in more details in the next
section). Hence, we estimate the following additional equation:
pi = p (ALLi; P RIVi; P OPi; !Li; COM Pi; t; ), i = 1; :::; N; (9)
where is a vector of parameters. Several comments are worth emphasizing: First, note that we test whether alliances have any impact on the global average price set by airlines using a simple dummy, in a similar fashion as in the cost equation. This procedure is similar to the one used by Brueckner and Whalen (2001) and Whalen (2007) with two di¤erences: They measure the e¤ects of codesharing and immunity agreements on prices while we rather focus on the e¤ect of being a member of an alliance without specifying with precision the nature of the agreement. Moreover, as already mentioned, these authors work at the route (market) level while we focus on economic indicators aggregated at
in the cost function and for evidence on their e¤ects on airlines’ productivity. A measure of airport concentration was included in an alternative speci…cation but it turned out to be highly correlated with the size of the network.
the network level. Note however that they consider that the codesharing and immunity agreements apply to all the products o¤ered by airlines while in practice these agreements are e¤ective in some speci…c markets only. In a sense, this “generalization” of airlines’ cooperative behaviors generates an average e¤ect on prices that is, to some extent, similar to our measures.
Second, entering an alliance is a decision of the airline and this has several conse-quences in our model: We should proxy the alliance variable Ai since it is most probably
endogenous. This is however a di¢ cult task due to the fact that very few instruments are left in our database. We run several logit estimations on the choice of entering an alliance and obtained results where a trend, airlines’wages, and the (1995) airlines’network size signi…cantly a¤ect the probability to enter an alliance. Unfortunately, these instruments create important collinearity problems once prices are proxied in the demand equation. We therefore decided to discard the idea of proxying the decision to enter an alliance. Further comments on the logit estimation results are provided in section 8.
Another consequence is that the overlapping and connection indexes Oi j and Ci j
may themselves be decision variables of airlines. In order to avoid endogeneity problems at this level, we keep both Oi j and Ci j …xed over time, i.e., we use the initial 1995 indexes
to proxy the degree of substitution and connection between airlines over the whole period of observation.
Finally, we compute several robustness checks to test the validity of our estimates of own and cross price elasticities. We show that the own elasticities do not vary much when prices are proxied or not. We also try other speci…cations of the demand equation. In particular, we replace N ETiin the expression of the constant and the own price parameter
by the number of airline’s ‡ights departures DEPi and the number of routes ROU T ESi.
We suggest that these changes entail minor variation in the results.
7
Variables de…nition
The variables have been constructed as follows. In the cost function, total costs (Ci),
pro-duction (Qi), wages (!Li), and average stage length (ASLi) correspond to total operating
expenses, seat-kilometers available, ‡ight crew salaries and maintenance and overhaul expenses over number of employees, and total aircraft kilometers over total aircraft
de-partures (DEPi), respectively. With respect to total costs, companies report one single
…gure that corresponds to passengers, freight and mail activities. The distribution of operations among these three activities can vary signi…cantly among companies. How-ever, it is easy to obtain information on the total number of tons-Kilometers performed that correspond to passengers (including baggage), freight and mail, respectively. We multiply total costs reported by each company by the share of tons-kilometers performed corresponding to passengers in order to compute our cost variable (Ci).
The variable N ETi is the total number of route kilometers an airline operates on all its
di¤erent routes (ROU T ESi). Finally, the price of materials (!M i) has been constructed
as the average fuel prices at the airline’s home country and at the OECD, weighted by the company’s domestic and international operations respectively.
On the demand side, demand (qi) corresponds to passenger-kilometers performed,
and prices (pi) are measured as passenger revenues over passenger-kilometers performed.
The home country exogenous characteristic mi is domestic private consumption P RIVi.
Finally, t the time trend, is equal to one in 1995 and incremented by one each year.
We also construct a competition index COM Pi for each airline i, which accounts
for the number and the intensities of coincidences of i’s network with other airlines’ networks. We have de…ned previously the substitution index Oi j = (O(Tij+Oji)
i+Tj) as the
share of route kilometers departing from two airlines i and j’s hubs and that i and j have in common. Summing Oi j over all airlines j which coincide with i, we obtain a
measure of the competition index, COM Pi =
P
jOi j for airline i. Thus, airline i faces
a higher competitive pressure if COM Pi increases, i.e., if i shares a higher quantity of
route kilometers with its competitors.
Finally, we need to construct a variable to account for the alliance e¤ects in the price and cost equations. Airlines cooperate with partners who are the members of the same alliance, i.e., ONE, SKY, STAR, WINGS, and QUAL. We construct a dummy ALLi
which takes value one if the observed airline is a member of any of these alliances, and zero otherwise. Note that it is implicitly assumed that being a member of one of these alliances entails that an airline sets cooperative prices in all the markets where it is present.
8
Demand elasticity and costs
Tables 5 to 11 provide the results for the econometric model. Prior to estimating the demand function (5), we need to obtain estimated prices ^pi through the price equation
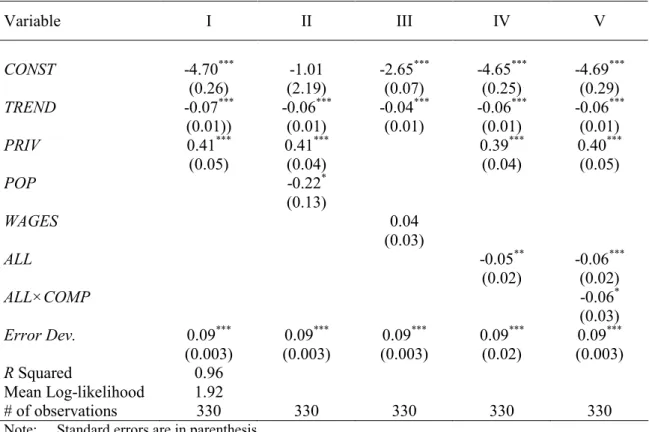
(9). As a by-product, we test several price determinants, as presented in Table (5). We obtain price outcomes that are similar to the empirical results obtained by Brueckner and Whalen (2000) and Whalen (2007), although these authors work at a more disaggregated level, i.e., on a market (route) basis. First, note that prices decrease at an annual rate of 4 to 7% as suggested by the trend. Second, prices are higher, on average, if the domestic private consumption inside the home country of the observed airline is more important. Third, the size of the population of the home country of the observed airline and the price are inversely related, which suggests that this variable is a potential proxy for the quantity of passengers-kilometers carried.
Note that the average wage paid to the employees of the airline is not a relevant determinant of the price, suggesting that a direct connection between airlines’prices and costs is potentially loose. Whether or not an airline is a member of an alliance has a signi…cant impact. On average, prices are 5 to 6% lower under alliances. This is an interesting result, given the highly aggregated nature of the data. Although airlines establish strategic price interactions on a market to market basis, prices reductions are important enough so that these reductions can be identi…ed in annual average prices at the airline level. Interacting the alliance variable with our measure of competition yields the expected negative results, i.e., prices are lower for alliance members facing a higher competitive pressure.
As suggested previously, we also estimate the decision of airlines to enter an alliance.8
Replacing ALLi in the price equation by this estimated probability reduces signi…cantly
the magnitude of the alliance e¤ect (-1% instead of -5%), although the alliance outcome remains negative and highly signi…cant. This suggests a potential endogeneity bias: Air-lines entering alliances may enjoy lower costs than those not entering. In particular, the former may be more e¢ cient and/or larger …rms. Not accounting for this issue may lead to an overstatement of the alliance e¤ects on prices.
From the di¤erent price speci…cations in Table 5, we derive measures ^pi which are in-8The estimated probability to enter an alliance is Pr = 30:62
(1:59)+ 6:91(1:33)T REN D + 1:59(0:30)N ET (0:31)0:61
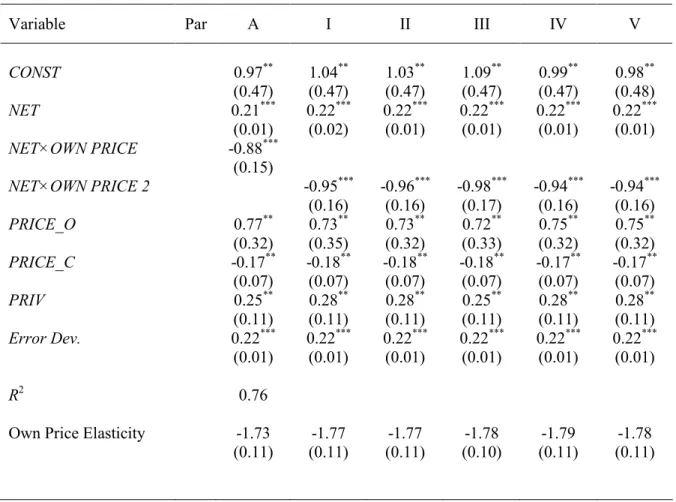
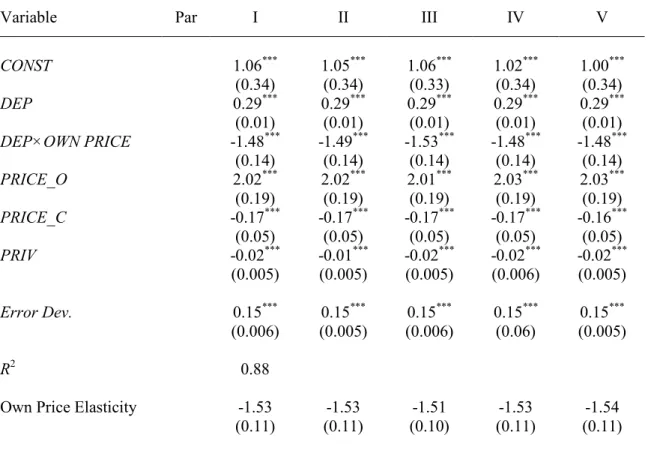
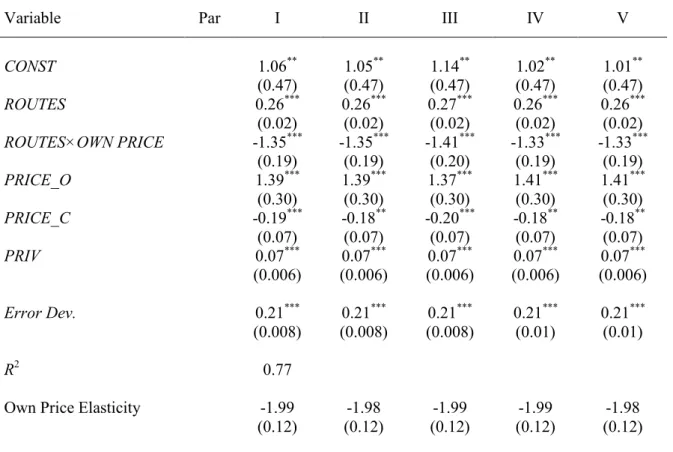
troduced in our demand equation. Tables 6-8 present the results for the demand equation. Table 6 shows the results of the demand equation (5). In Tables 7 and 8, we produce alternative estimates obtained from the estimation of (5) where N ETi is replaced by the
number of routes, ROU T ESi, and the number of departures DEPi, respectively. All the
coe¢ cients have the expected signs. As expected, demand increases signi…cantly with the size of the network, the number of aircraft departures, or the number of routes operated. Likewise, private consumption growth a¤ects positively demand. The own price parame-ter 2 is negative and signi…cant, and do not vary much depending on whether the size
of the network, the number of routes, or the number of departures enter the speci…cation of the own price demand elasticity. Note moreover that, from Table 6, plugging into the demand function the real observed price pi (Column A) or the estimated ^pi (Columns I
to V) do not a¤ect much 2. With respect to cross price estimates, it appears that 3
( 4 resp.) is positive (negative resp.) and signi…cant. This result suggests that a higher
proportion of overlapping route kilometers between two airlines i and j makes it more likely for these airlines to be substitutes. Likewise, a higher proportion of connecting route kilometers between two airlines i and j makes it more likely for these airlines to be complements.
From the estimation of the own price parameter 2 obtained in Tables 6-8, we evaluate
the own price demand elasticity as ii = 2N ETi pqii : We obtain estimates between
1:51 and 1:99 for the average airline over the period considered.9 More interestingly,
using the cross price demand parameters 3 and 4, we derive the substitution cut-o¤
Oi j = 4
3 4 above which two airlines can be considered as substitutes. From the
demand results c3 and c4 obtained in Table 6 (7 and 8 resp.), the cut-o¤ Oi j is 0.180
(0.113 and 0.077 resp.)10 Hence, substitute airline pairs are those for which O
i j 0:180
(0.113 and 0.077 resp.) in Table 3, i.e., we identify 12 substitute airline pairs (31 and 57 resp.), which represents 2.7% (6.9 and 12.8% resp.) of the airline pairs characterized by overlapping activities.
Table 9 identi…es the pairs of airlines whose services are substitutes. Airlines pairs which are members of the same alliances over 1995-2000 are underlined. Airline pairs which become members of the same alliance after our period of observation are under-lined and in italic. Interestingly, a signi…cant number of pairs of substitute airlines belongs
9A survey by Oum et al. (1992) on price elasticities of air transport demand suggests that empirical
…ndings obtained during the 80s usually lie between -4.51 and -0.4.
to the same alliance, which may lead to softer competition and higher prices. Among the pairs with the highest substitution index are SAS and Thai, (Star Alliance from 1997), Continental and Delta (Skyteam from 2004), or Canadian Airlines and Cathay (OneWorld from 1999). Note also the presence of the pair American Airlines-British air-ways (OneWorld since 1998) which required antitrust immunity on transatlantic routes in 1997 and 2001 without success, or the pair Lufthansa-United which got granted an-titrust immunity in 1997 under very speci…c restrictions on some particular routes such as Washington/Frankfurt and Chicago/Frankfurt.11 More recently, the European
Com-mission opened two antitrust proceedings against these four airlines together with other members of Star Alliance (Air Canada and Continental) and OneWorld (Iberia) in rela-tion to cooperarela-tion on transatlantic routes.12 The Commission is willing to assess whether
cooperation among these airlines may lead to restrictions of competition on certain routes. These cases illustrate that a methodology based on network substitution such as the one presented in this paper may be a relevant tool for regulators when deciding whether or not two airlines should be allowed cooperative arrangements. We turn to the capacity and cost side of our results.
Table 10 presents the demand-capacity relationship. Again, the coe¢ cients are signi…-cant and have the expected sign. Table 11 presents the estimates for the cost function. All the parameters are signi…cant and have the expected sign. Costs increase with wages and production. The production process is characterized by increasing returns to scale since the production parameter 3 is signi…cantly lower than 1. The coe¢ cient of the time
trend is negatively signed, suggesting the presence of technological progress. Airlines’ network size and average stage length have a negative impact on operating cost. Thus, companies with larger networks and/or longer routes enjoy a signi…cant cost advantage. Finally, we also introduce in the cost function our alliance (ALL) dummy variable to test whether airlines’operating costs are reduced if airlines enter into cooperative agreements. The results suggest that alliances have no direct e¤ect on cost since the ALL e¤ect is not signi…cant.
Hence, it seems that alliances between airlines reduce prices signi…cantly but they have no direct e¤ect on costs. We expect however alliances to have a positive impact on the quantity of passengers kilometers carried (Whalen, 2007), which in turn leads to
11Note issued by the U.S. Department of Transportation on the 20th May 1996.
a decrease of airlines’ average costs due to the presence of economies of density. Thus, alliances mostly increase the ‡ow of passengers inside the existing network, and thus reduce airlines’costs, but they do not a¤ect airlines’cost technology.
9
The competition e¤ect of alliances
We propose now to discuss further our previous …ndings in light of the average competitive behavior of each airline. Provided with the demand, capacity, and cost estimates, we measure the degree of competition in the industry after the introduction of alliances. We evaluate alliances’marginal costs and margins and shed light on whether the pricing behavior of airlines which are members of alliances is similar to a hypothetical Nash pricing behavior.
Provided with the cost and demand ingredients, each airline solves the following pro-gram,
max
qi
i = qipi C(Qi; !i; zi); (10)
where qi is the optimal quantity to be chosen, and Qi = (qi; ). The …rst order
condition for …rm i, which entails Nash pricing, is given by
pi 0(qi) M Ci pi = qi pi @pi @qi ; (11) where M Ci= @Ci @Qi and 0(qi) = @Qi @qi :
Using the estimates of the cost, capacity and demand system obtained in the previous section, we can evaluate the price-cost margins Mi = pi
0(qi) M Ci
pi , and test these margins
against those that could be obtained if airlines obeyed to Nash behavior, as described by the right-hand side of (1). Under Nash, …rms set prices independently, since each …rm i only cares for its own demand qi.13
13By estimating cost and demand functions, we are able to generate direct measures of the price-cost
estima-From the expressions of demand (5), capacity (8) and costs (6), the price …rst-order condition under Nash behavior can be rewritten as
pi 1qQi i M Ci pi = qi pi 1 1 : (12)
Through the estimation of the cost function, the marginal costs M Ci can be easily
recovered since M Ci = 3QCii. Putting them together with our estimate of the
capacity-demand elasticity 1, as well as the observed values for supply, demand and prices, we
are able to evaluate the price-marginal cost margin Mi set by each airline. We refer to
Mi as the actual margin since it directly depends on the observation of pi, qi, Qi, Ci and
the parameters 1 and 3.
Table 12 presents the estimated values for marginal costs M Ci, and margins Mi, for
all …rms and alliances. Several results are worth emphasizing.
First, the average airline enjoys a positive margin. Second, distinguishing companies belonging to alliances from companies outside alliances, it seems that companies within alliances obtain higher margins. However, these companies set lower prices and face lower marginal costs. Note that this latter result (lower marginal costs) is not inconsistent with the non-signi…cant alliance e¤ect on costs which is presented in Table 11. Indeed, the alliance e¤ect in Table 11 is in principle independent of any airline characteristics, while the average marginal cost for alliance members computed in Table 12 is conditional on airline characteristics. As discussed in the previous section, alliance members may enjoy lower marginal costs because alliances are potentially clubs which gather more e¢ cient and/or larger companies, compared to those outside alliances.
Third, note that prices, marginal costs, and margins vary signi…cantly across alliances. A striking result is the average margin of Quali‡yer which is close to 0. This could be related to the negative pro…t obtained by some of its airlines for several years, illustrating the …nancial di¢ culties of the alliance, which stopped its operations in 2001 after the bankruptcies of Swissair and Sabena.
Using our estimates for the demand equation, note that, as suggested by the
right-tions of the conduct parameter through the pricing rule may lead to signi…cant underestimation of market power. Similarly, imposing a speci…c conduct and estimating costs may lead to over or underestimation of costs when perfect competition or monopoly are assumed respectively. On the contrary, estimates are quite insensitive to the assumed demand functional form.
hand side of Equation (11), Nash behavior would entail an average margin MNT for all the
airlines in the sample equal to 0:707. On average, the industry’s actual margin MT = 0:122
does not entail pure Nash behavior. It is also worth distinguishing airlines that belong to alliances and those that do not. We have suggested that companies within alliances were setting the highest margins. We also calculate an average individual Nash margin for each group. Note that, from the ratio qi=pi, evaluated at the average observation of the sample,
it can be seen that the airlines within alliances meet demand on a more inelastic portion of the curve than other companies. Hence, pure Nash behavior for companies inside alliances entails a margin MNA equal to 0.950, while for other companies the margin, MNN A, is equal to 0.677. The values of these actual margins lie below the individual Nash behavior margins. Hence, individual Nash behavior is not met for any set of companies. We can as well evaluate an average Nash margin for each alliance. Airlines inside these alliances show a behavior that is di¤erent from individual Nash. According to our results, Airlines in SkyTeam and Star Alliance are those characterized by the less competitive behavior.
Note that Star Alliance (OneWorld resp.) includes six (…ve resp.) airlines whose networks are substitutes to other airlines’networks inside the same alliance. We present in the lower half of the table individual estimates for these companies, which are American Airlines, British Airways, Qantas, Cathay, Canadian Airlines, United, Lufthansa, All Nippon, SAS, Thai, and Mexicana. Note that, compared to the average airline inside an alliance, a majority of them enjoy higher margins, since they bene…t from marginal costs advantages and/or they set higher prices. Comparing the real margins to individual Nash margins suggests that Lufthansa, Mexicana, SAS, and Thai have the less competitive behavior.
10
Conclusion
After worldwide liberalization of the airline market, competition has led …rms to start forming alliances. Economic studies have proposed that alliances between airlines whose networks can be regarded as substitutes should result in softer competition and higher prices. At the same time, alliances between …rms whose networks can be regarded as complements should result in lower prices due to cost reductions. The former type of alliance should be avoided, but the latter should be promoted.
This study sheds light on these issues. Our contribution consists in evaluating air-lines’strategical interactions through the window of …rms’network interconnections. To estimate cross-price elasticities for all the networks of our database, we consider airlines’ networks coincidences and potential connections with all their rivals. The results allow us to classify all company pairs as either complements or substitutes, and predict price cost margins.
Our results suggest that a signi…cant number of companies that are allied between 1995 and 2000 can cooperate on routes that were jointly served before, so that many members’networks can be considered as substitutes.
At the same time, we show that, on average, alliance members propose lower prices than airlines outside alliances. We suggest that this negative impact of alliances on prices does not correspond necessarily to a change in airlines’pricing once they are part of an alliance. We rather believe that alliances are clubs of large and e¢ cient companies, in which the members are able to set lower prices because they enjoy lower costs.
References
Bamberger, G.E., D.W. Carlton, and L.R. Neumann (2004), "An Empirical Investi-gation of the Competitive E¤ects of Domestic Airline Alliances". Journal of Law and Economics, vol. 47 , pp. 195-222.
Berechman, J. Public Transit Economics and Deregulation Policy. Amsterdam, North Holland, 1993.
Borenstein, S. (1989), “Hubs and High Fares: dominance and market power in the U.S. airline industry”. Rand Journal of Economics, vol. 20, pp. 344-365.
Brueckner, J.K. (2001), "The Economics of International Codesharing: An Analysis of Airline Alliances". International journal of Industrial Organization, vol. 19, 1475-1498.
Brueckner, J.K. (2003), "International Airfares in the age of Alliances: the e¤ects of Codesharing and Antitrust Immunity". Review of Economics and Statistics, vol. 85, pp. 105-118.
Brueckner, J.K, and T. Whalen (2000), "The Price E¤ects of International Airline Alliances". Journal of Law and Economics, vol. 43, pp. 503-545.
Gagnepain, P., and P.L. Marin (2006), "Regulation and Incentives in European Avi-ation", Journal of Law and Economics, vol. 49, pp. 229-248.
Genesove, D., and W.P. Mullin (1998), "Testing Static Oligopoly Models: Conduct and Cost in the Sugar Industry, 1890-1914", RAND Journal of Economics, vol. 29, pp. 355-377.
Good, D.H., L-H Röller, and R.C. Sickles (1993), "US Airline Deregulation: Implica-tions for European Transport. The Economic Journal, vol. 103, pp. 1028-1041.
Jaumandreu, J. and J. Lorences (2002), "Modelling Price Competition Across Many Markets (An Application to the Spanish Loans Market)". European Economic Review, vol. 46, pp. 93-115.
Marin, P.L. (1998), “Productivity Di¤erences in the Airline Industry: Partial Dereg-ulation versus Short Run Protection”. International Journal of Industrial Organization, vol. 16, pp. 395-414.
European Economic Review, vol. 40, pp. 933-940.
Neven, D.J., L-H Röller and Z. Zhang (2006), “Endogenous Costs and Price-Cost Margins”. The Journal of Industrial Economics, vol. 54, pp. 351-368.
Oster, S.M., Modern Competitive Analysis, 2nd ed. New York: Oxford University Press, 1994.
Oum, T.H., and J.H. Park (1997), "Airline alliances: Current status, Policy issues, and Future Directions", Journal of Air Transport Management, vol. 3, pp. 133-144.
Oum, T.H., J. Park, and A. Zhang (1996), "The E¤ects of airline Codesharing Agree-ments on Firm Conduct and International Airfares". Journal of Transport Economics and Policy, vol. 30, pp. 187-202.
Oum, T.H., W.G. Waters II and J.S. Yong (1992), "Concepts of price elasticities of transport demand and recent empirical estimates". Journal of Transport Economics and Policy, vol. 26, pp. 139-154.
Röller, L-H. and R.C. Sickles (2000), "Capacity and Product Market Competition: Measuring Market Power in a Puppy-Dog’Industry", International Journal of Industrial Organization, vol. 18, pp. 845-865.
Whalen, W.T. (2007), "A panel data analysis of code-sharing, antitrust immunity, and open skies treaties in international aviation markets". Review of Industrial Organization, vol. 30, pp. 39-61.
Abstract: We consider an empirical model of worldwide airline alliances that we apply to a large set of companies for the period 1995-2000. Using observations at the network level, we estimate a cost, capacity, and demand system that accounts for cross-price elasticities. Our contribution consists in evaluating airlines’strategical interactions through the window of …rms’ network interconnections. We consider networks coinci-dences and potential connections with all their rivals. The results allow us to classify all company pairs as either complements or substitutes. We shed light on the fact that many airlines involved in the same alliance are potential substitutes. Keywords: Alliance, airline, cross-price elasticities. JEL: L11, L13, L41.
TABLE 1: List of airlines included in the Dataset
Airline Seats-kil. Airline Seats-kil.
United Airlines 272,380,784 Aeromexico 16,770,044
American Airlines 250,920,342 Mexicana 15,942,627
Delta Airlines 224,202,461 Finnair 13,409,143
Northwest 153,461,676 Olympic 13,157,697
British Airways 144,535,575 TAP 12,837,742
Japan Airlines 112,853,559 Continental Micronesia 9,200,909
Continental Airlines 108,316,288 Aer Lingus 8,662,699
Lufthansa 103,576,477 Avianca 7,275,610
U.S. Air 95,375,781 LOT 6,707,159
Air France 94,723,686 Air Lanka 6,628,365
All Nippon Airways 79,336,012 Air Europa 4,987,922
Qantas 78,106,832 British Midland 4,819,388
KLM 70,075,874 Spanair 4,682,385
TWA 59,716,643 Braathens 4,536,869
Cathay Pacific 56,506,464 Malev 4,029,375
Air Canada 51,470,679 Cyprus Airways 3,889,153
Alitalia 51,433,485 Air UK 3,393,372
Thai Airways 47,788,381 Meridiana 3,316,857
Iberia 43,128,693 Mea Air Liban 3,233,606
Swissair 38,245,227 Gb Airways 1,770,826
America West 37,929,149 Jersey European 1,228,033
Canadian Airlines 35,288,169 Croatia Airlines 1,020,691
Varig 35,199,155 Maersk Air 727,783
SAS 31,500,448 Lithuanian Airlines 623,836
Virgin Atlantic 26,642,135 Estonian Air 408,050
Alaska Airlines 25,589,388 Air Baltic 268,564
Japan Air system 22,201,996 Air Botswana 109,663
Sabena 20,714,658
TABLE 2: Alliances
Alliance Carrier Date of entry
OneWorld American Airlines Sep. 98
British Airways Sep. 98
Qantas Sep. 98
Cathay Sep. 98
Iberia Sep. 99
Finnair Sep. 99
Canadian Feb 99
Aer Lingus Jun. 00
SkyTeam Delta Sep. 99
Air France Sep. 99
Alitalia Jul. 01
Aeromexico Sep. 99
Star Alliance United May. 97
Lufthansa May. 97
All Nippon Oct. 99
Air Canada May. 97
Thai May. 97
Varig Oct. 97
SAS May. 97
Mexicana Jul. 99
LOT Jun. 03
British Midland Jul. 00
Spanair Jun. 03
Wings Northwest 89
KLM 89
Continental 89
Qualiflyer Swissair Mar. 98
Sabena Mar. 98
TAP Mar. 98
LOT Jan. 00
Air Europa Mar. 99
FIGURE 1: Network overlapping A G F E D C B I H Networks: #1: ABIH #2: IDEF #3: BCDI #4: BCEGHI #5: ABIH
FIGURE 2: Hub overlapping
●
●
a. Complementary networks
●
●
b. Intermediate degree of substitution
●
c. High degree of substitution
Hubs: H1: Airline 1 H2: Airline 2 Routes: Airline 1 Airline 2 H1 H1 H2 H1 H2 H2
TABLE 3: Overlapping pairs
Airline Pair Index Airline Pair Index
All Nippon – Japan Airlines 0.5641 Air France – Japan Airlines 0.0907
Delta – TWA 0.3860 British Airways - United 0.0859
Aeromexico – America West 0.3484 Lufthansa – Thai 0.0854
SAS – Thai 0.3358 All Nippon – Sabena 0.0834
Continental - TWA 0.3118 Japan Air System - Northwest 0.0827
Air UK – Spanair 0.3063 United – Virgin 0.0827
Continental - Delta 0.2670 Delta – Swissair 0.0826
British Airways - Virgin 0.2400 British Airways - Delta 0.0825 Aeromexico – Mexicana 0.2383 British Airways - Qantas 0.0812 Continental Micro. – Japan Air Sys. 0.1858 Qantas – United 0.0799
Air Europa – Spanair 0.1829 Alitalia – TWA 0.0786
Japan Airlines - United 0.1812 Air France – Thai Airways 0.0779
Olympic - TWA 0.1795 Continental - Mexicana 0.0773
Mexicana - USAIR 0.1539 Continental – Virgin 0.0757
Air UK – British Midland 0.1536 Delta – Virgin 0.0752
Qantas - Thai 0.1522 Japan Airlines - Virgin 0.0752
British Airways - Continental 0.1518 Air Europa – Iberia 0.0735 American – Delta 0.1501 Japan Airlines - Lufthansa 0.0734
Canadian Airlines – Cathay 0.1413 Delta – SAS 0.0713
Japan Airlines - Northwest 0.1374 Air Canada – British Airways 0.0698 Delta - Lufthansa 0.1364 Continental – Japan Air sys. 0.0698 Air Canada – Canadian Airlines 0.1355 Air UK – KLM 0.0693
Aeromexico – Iberia 0.1314 Air Europa – TWA 0.0689
Olympic - Thai 0.1307 Swissair – Varig 0.0686
All Nippon – Northwest 0.1288 British Airways - USAIR 0.0680
Continental - SAS 0.1263 Delta – Sabena 0.0669
Alitalia – Thai 0.1261 TAP – TWA 0.0660
TAP - Varig 0.1242 Delta – United 0.0656
Japan Airlines – Japan Air System 0.1191 Air France – TWA 0.0647 American – Continental 0.1178 Air France – All Nippon Airw 0.0641
Mexicana - United 0.1173 Continental - Lufthansa 0.0640
American – British Airways 0.1126 Japan Air System – United 0.0637
British Airways - Thai 0.1116 Air France – United 0.0636
Lufthansa - United 0.1101 Cont. Micro. – Japan Airl. 0.0631
American – United 0.1066 Iberia – Varig 0.0630
Northwest - Qantas 0.1049 Japan Airlines - Thai 0.0626
All Nippon – Qantas 0.1046 Cathay – Swissair 0.0624
All Nippon – Virgin 0.1028 Air Canada – Iberia 0.0620
Japan Airlines - Qantas 0.0988 Olympic – Qantas 0.0619
Continental Micronesia – Northwest 0.0987 All Nippon – Cont. Micro. 0.0618
All Nippon – United 0.0980 Delta – Varig 0.0614
Aeromexico – Continental 0.0948 American – Lufthansa 0.0613
Cathay – Qantas 0.0930 Iberia – TWA 0.0613
Air UK – Cathay 0.0922 …
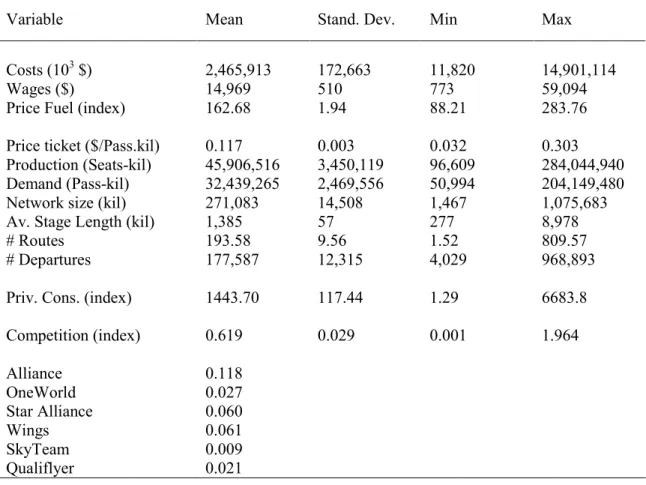
TABLE 4: Descriptive statistics (Annual data, 1995-2000, 55 airlines)
Variable Mean Stand. Dev. Min Max
Costs (103 $) 2,465,913 172,663 11,820 14,901,114
Wages ($) 14,969 510 773 59,094
Price Fuel (index) 162.68 1.94 88.21 283.76
Price ticket ($/Pass.kil) 0.117 0.003 0.032 0.303
Production (Seats-kil) 45,906,516 3,450,119 96,609 284,044,940 Demand (Pass-kil) 32,439,265 2,469,556 50,994 204,149,480
Network size (kil) 271,083 14,508 1,467 1,075,683
Av. Stage Length (kil) 1,385 57 277 8,978
# Routes 193.58 9.56 1.52 809.57
# Departures 177,587 12,315 4,029 968,893
Priv. Cons. (index) 1443.70 117.44 1.29 6683.8
Competition (index) 0.619 0.029 0.001 1.964 Alliance 0.118 OneWorld 0.027 Star Alliance 0.060 Wings 0.061 SkyTeam 0.009 Qualiflyer 0.021
TABLE 5: Prices Variable I II III IV V CONST -4.70*** (0.26) -1.01 (2.19) -2.65*** (0.07) -4.65*** (0.25) -4.69*** (0.29) TREND -0.07*** (0.01)) -0.06*** (0.01) -0.04*** (0.01) -0.06*** (0.01) -0.06*** (0.01) PRIV 0.41*** (0.05) 0.41*** (0.04) 0.39*** (0.04) 0.40*** (0.05) POP -0.22* (0.13) WAGES 0.04 (0.03) ALL -0.05** (0.02) -0.06*** (0.02) ALL×COMP -0.06* (0.03) Error Dev. 0.09*** (0.003) 0.09*** (0.003) 0.09*** (0.003) 0.09*** (0.02) 0.09*** (0.003) R Squared 0.96 Mean Log-likelihood 1.92 # of observations 330 330 330 330 330
Note: Standard errors are in parenthesis.
***
TABLE 6: Demand I (Network)
Variable Par A I II III IV V
CONST 0.97** (0.47) 1.04** (0.47) 1.03** (0.47) 1.09** (0.47) 0.99** (0.47) 0.98** (0.48) NET 0.21*** (0.01) 0.22*** (0.02) 0.22*** (0.01) 0.22*** (0.01) 0.22*** (0.01) 0.22*** (0.01) NET×OWN PRICE -0.88*** (0.15) NET×OWN PRICE 2 -0.95*** (0.16) -0.96*** (0.16) -0.98*** (0.17) -0.94*** (0.16) -0.94*** (0.16) PRICE_O 0.77** (0.32) 0.73** (0.35) 0.73** (0.32) 0.72** (0.33) 0.75** (0.32) 0.75** (0.32) PRICE_C -0.17** (0.07) -0.18** (0.07) -0.18** (0.07) -0.18** (0.07) -0.17** (0.07) -0.17** (0.07) PRIV 0.25** (0.11) 0.28** (0.11) 0.28** (0.11) 0.25** (0.11) 0.28** (0.11) 0.28** (0.11) Error Dev. 0.22*** (0.01) 0.22*** (0.01) 0.22*** (0.01) 0.22*** (0.01) 0.22*** (0.01) 0.22*** (0.01) R2 0.76
Own Price Elasticity -1.73 (0.11) -1.77 (0.11) -1.77 (0.11) -1.78 (0.10) -1.79 (0.11) -1.78 (0.11)
Note: Standard errors are in parenthesis.
***
TABLE 7: Demand II (Departures)
Variable Par I II III IV V
CONST 1.06*** (0.34) 1.05*** (0.34) 1.06*** (0.33) 1.02*** (0.34) 1.00*** (0.34) DEP 0.29*** (0.01) 0.29*** (0.01) 0.29*** (0.01) 0.29*** (0.01) 0.29*** (0.01) DEP×OWN PRICE -1.48*** (0.14) -1.49*** (0.14) -1.53*** (0.14) -1.48*** (0.14) -1.48*** (0.14) PRICE_O 2.02*** (0.19) 2.02*** (0.19) 2.01*** (0.19) 2.03*** (0.19) 2.03*** (0.19) PRICE_C -0.17*** (0.05) -0.17*** (0.05) -0.17*** (0.05) -0.17*** (0.05) -0.16*** (0.05) PRIV -0.02*** (0.005) -0.01*** (0.005) -0.02*** (0.005) -0.02*** (0.006) -0.02*** (0.005) Error Dev. 0.15*** (0.006) 0.15*** (0.005) 0.15*** (0.006) 0.15*** (0.06) 0.15*** (0.005) R2 0.88
Own Price Elasticity -1.53 (0.11) -1.53 (0.11) -1.51 (0.10) -1.53 (0.11) -1.54 (0.11)
Note: Standard errors are in parenthesis.
***
TABLE 8: Demand III (Routes)
Variable Par I II III IV V
CONST 1.06** (0.47) 1.05** (0.47) 1.14** (0.47) 1.02** (0.47) 1.01** (0.47) ROUTES 0.26*** (0.02) 0.26*** (0.02) 0.27*** (0.02) 0.26*** (0.02) 0.26*** (0.02) ROUTES×OWN PRICE -1.35*** (0.19) -1.35*** (0.19) -1.41*** (0.20) -1.33*** (0.19) -1.33*** (0.19) PRICE_O 1.39*** (0.30) 1.39*** (0.30) 1.37*** (0.30) 1.41*** (0.30) 1.41*** (0.30) PRICE_C -0.19*** (0.07) -0.18** (0.07) -0.20*** (0.07) -0.18** (0.07) -0.18** (0.07) PRIV 0.07*** (0.006) 0.07*** (0.006) 0.07*** (0.006) 0.07*** (0.006) 0.07*** (0.006) Error Dev. 0.21*** (0.008) 0.21*** (0.008) 0.21*** (0.008) 0.21*** (0.01) 0.21*** (0.01) R2 0.77
Own Price Elasticity -1.99 (0.12) -1.98 (0.12) -1.99 (0.12) -1.99 (0.12) -1.98 (0.12)
Note: Standard errors are in parenthesis.
***
TABLE 9: Pairs of substitute carriers
Airline Pair Index Airline Pair Index
All Nippon – Japan Airlines 0.5641 American – Continental 0.1178
Delta – TWA 0.3860 Mexicana – United 0.1173
Aeromexico – America West 0.3484 American – British Airways 0.1126
SAS – Thai 0.3358 British Airways – Thai 0.1116
Continental – TWA 0.3118 Lufthansa – United 0.1101
Air UK – Spanair 0.3063 American – United 0.1066
Continental – Delta 0.2670 Northwest – Qantas 0.1049
British Airways – Virgin 0.2400 All Nippon – Qantas 0.1046
Aeromexico – Mexicana 0.2383 All Nippon – Virgin 0.1028
Continental Micro. – Japan Air Sys. 0.1858 Japan Airlines – Qantas 0.0988 Air Europa – Spanair 0.1829 Continental Micro – Northwest 0.0987 Japan Airlines – United 0.1812 All Nippon – United 0.0980
Olympic – TWA 0.1795 Aeromexico – Continental 0.0948
Mexicana – USAIR 0.1539 Cathay – Qantas 0.0930
Air UK – British Midland 0.1536 Air UK – Cathay 0.0922
Qantas – Thai 0.1522 Air France – Japan Airlines 0.0907
British Airways - Continental 0.1518 British Airways - United 0.0859
American – Delta 0.1501 Lufthansa – Thai 0.0854
Canadian Airlines – Cathay 0.1413 All Nippon – Sabena 0.0834 Japan Airlines – Northwest 0.1374 Japan Air System - Northwest 0.0827
Delta – Lufthansa 0.1364 United – Virgin 0.0827
Air Canada – Canadian Airlines 0.1355 Delta – Swissair 0.0826 Aeromexico – Iberia 0.1314 British Airways – Delta 0.0825
Olympic – Thai 0.1307 British Airways – Qantas 0.0812
All Nippon – Northwest 0.1288 Qantas – United 0.0799
Continental – SAS 0.1263 Alitalia – TWA 0.0786
Alitalia – Thai 0.1261 Air France – Thai Airways 0.0779
TAP – Varig 0.1242 Continental – Mexicana 0.0773
TABLE 10: Demand-Capacity relationship Variable Parameter CONST 1.58*** (0.28) q 0.92*** (0.01) Error Dev. 0.05*** (0.002) R2 0.99
Note: Standard errors are in parenthesis.
***
Significant at the 1% level; **significant at the 5% level; *significant at the 10% level.
TABLE 11: Cost function
Variable A A2 CONSTANT -4.95*** (0.24) -4.99*** (0.25) WAGE 0.24*** (0.02) 0.24*** (0.02) Q 0.93*** (0.02) 0.93*** (0.02) NET -0.07** (0.03) -0.07** (0.03) ASL -0.38*** (0.04) -0.38*** (0.04) TREND -0.15*** (0.03) -0.15*** (0.03) ALL -0.03 (0.06) Error Dev. 0.30*** (0.01) 0.30*** (0.01) R2 0.97
Note: Standard errors are in parenthesis.
***
Significant at the 1% level; **significant at the 5% level;
*
TABLE 12. Marginal costs, prices, and margins.
Price MC Real Margin Nash Margin Alliances All carriers 0.129 (0.061) 0.074 (0.035)) 0.122 (0.349) 0.707 (0.499) Carriers within alliances 0.099
(0.029) 0.056 (0.018) 0.234 (0.199) 0.950 (0.342) Carriers outside alliances 0.132
(0.063) 0.076 (0.036)) 0.108 (0.360) 0.677 (0.507) OneWorld 0.102 (0.025) 0.056 (0.011) 0.244 (0.080) 1.487 (0.246) SkyTeam 0.095 (0.003) 0.049 (0.008) 0.328 (0.121) 1.011 (0.007) Qualiflyer 0.095 (0.016) 0.067 (0.013) 0.022 (0.266) 0.751 (0.211) Star Alliance 0.101 (0.035) 0.053 (0.021) 0.308 (0.103) 0.930 (0.317) Wings 0.148 (0.061) 0.087 (0.041) 0.192 (0.175) 0.959 (0.587) Substitute airlines One American Airlines 0.082 0.046 0.258 2.695 British Airways 0.101 0.050 0.361 1.456 Qantas 0.072 0.044 0.224 1.683 Cathay 0.068 0.028 0.451 1.984 Canadian Airlines 0.057 0.037 0.132 2.109 Star Alliance United Airlines 0.076 0.045 0.246 3.332 Lufthansa 0.111 0.045 0.487 0.810 Mexicana 0.092 0.052 0.190 0.711
All Nippon Airways 0.133 0.070 0.248 1.270
SAS 0.175 0.095 0.227 0.603
Thai Airways 0.061 0.033 0.294 1.043
Notes: Price: One passenger-kilometer in Dollars. MC: One seat-kilometer in Dollars. Standard errors are in parenthesis.