HAL Id: halsde-00906207
https://hal.archives-ouvertes.fr/halsde-00906207
Submitted on 28 May 2020
HAL is a multi-disciplinary open access
archive for the deposit and dissemination of
sci-entific research documents, whether they are
pub-lished or not. The documents may come from
teaching and research institutions in France or
abroad, or from public or private research centers.
L’archive ouverte pluridisciplinaire HAL, est
destinée au dépôt et à la diffusion de documents
scientifiques de niveau recherche, publiés ou non,
émanant des établissements d’enseignement et de
recherche français ou étrangers, des laboratoires
publics ou privés.
central African Forest
Gaëlle Viennois, Nicolas Barbier, I. Fabre, Pierre Couteron
To cite this version:
Gaëlle Viennois, Nicolas Barbier, I. Fabre, Pierre Couteron. Multiresolution quantification of
decid-uouness in West central African Forest. Biogeosciences, European Geosciences Union, 2013, 10 (11),
pp.6957-6967. �10.5194/bg-10-6957-2013�. �halsde-00906207�
www.biogeosciences.net/10/6957/2013/ doi:10.5194/bg-10-6957-2013
© Author(s) 2013. CC Attribution 3.0 License.
Biogeosciences
Multiresolution quantification of deciduousness in West-Central
African forests
G. Viennois1, N. Barbier2, I. Fabre3, and P. Couteron2
1Centre National de la Recherche Scientifique (CNRS), UMR AMAP, TA A-51/PS 2, Boulevard de la Lironde, Montpellier
Cedex5, 34398, France
2Institut de Recherche pour le Développement (IRD), UMR AMAP, TA A-51/PS 2, Boulevard de la Lironde, Montpellier
Cedex5, 34398, France
3Institut Agronomique Néo-Calédonien, Station de Recherche Agronomique de Saint Louis, BP 711, 98810 Mont Dore,
New Caledonia, France
Correspondence to: G. Viennois ([email protected])
Received: 15 February 2013 – Published in Biogeosciences Discuss.: 23 April 2013 Revised: 29 August 2013 – Accepted: 9 September 2013 – Published: 4 November 2013
Abstract. The characterization of leaf phenology in
trop-ical forests is of major importance for forest typology as well as to improve our understanding of earth–atmosphere– climate interactions or biogeochemical cycles. The availabil-ity of satellite optical data with a high temporal resolution has permitted the identification of unexpected phenological cycles, particularly over the Amazon region. A primary is-sue in these studies is the relationship between the optical reflectance of pixels of 1 km or more in size and ground in-formation of limited spatial extent. In this paper, we demon-strate that optical data with high to very-high spatial reso-lution can help bridge this scale gap by providing snapshots of the canopy that allow discernment of the leaf-phenological stage of trees and the proportions of leaved crowns within the canopy. We also propose applications for broad-scale forest characterization and mapping in West-Central Africa over an area of 141 000 km2.
Eleven years of the Moderate Resolution Imaging Spectro-radiometer (MODIS) Enhanced Vegetation Index (EVI) data were averaged over the wet and dry seasons to provide a data set of optimal radiometric quality at a spatial resolution of 250 m. Sample areas covered at a very-high (GeoEye) and high (SPOT-5) spatial resolution were used to identify for-est types and to quantify the proportion of leaved trees in the canopy. The dry-season EVI was positively correlated with the proportion of leaved trees in the canopy. This relationship allowed the conversion of EVI into canopy deciduousness at the regional level. On this basis, ecologically important
for-est types could be mapped, including young secondary, open Marantaceae, Gilbertiodendron dewevrei and swamp forests. We show that in West-Central African forests, a large share of the variability in canopy reflectance, as captured by the EVI, is due to variation in the proportion of leaved trees in the upper canopy, thereby opening new perspectives for bio-diversity and carbon-cycle applications.
1 Introduction
Although tropical forests are now widely accepted as an im-portant component of the global carbon cycle, little is known about the actual dynamics of these ecosystems and their re-sponse to the ever-changing constraints of natural and an-thropic inputs at temporal scales ranging from ice age to seasonal cycles (Maley, 2009; Richards, 1996). For exam-ple, the monitoring of permanent forest plots in the Amazon and Congo basins suggested an ongoing trend where mor-tality, growth and recruitment rates changed in coherent pat-terns over the last few decades (Lewis et al., 2009b). The resulting increase in carbon uptake may explain a significant part of the dynamics observed in atmospheric carbon con-centrations (Lewis et al., 2009a). This example illustrates the importance of undertaking large-scale and long-term investi-gations in these ecosystems. We will focus here on another fundamental aspect of the rates of gas exchange, leaf phe-nology (Bonan, 2008) which is understood as a temporal
and generally cyclical pattern of biological events (in this case, the development and shedding of leaves) over the sea-sons. The phenology of rainforest trees is notoriously dif-ficult to study. Multi-annual cycles or cases of partial-leaf shedding within a population or even a single crown are fre-quent (Richards, 1996). The duration of the leafless stage varies significantly, and some trees have no leafless stage (leaf exchanging). Although the timing of leaf abscission or production is sometimes phased with rainfall cycles, this is not a general case in moist forests, and other drivers, such as episodes of lower incoming radiation (light), may be in play (Wright and Van Schaik, 1994). The apparent complex-ity of individual behaviors and the lack of synchrony within and among species make it difficult to identify patterns of leaf phenology at the stand or landscape level exclusively on the basis of environmental predictors. Field methods allow-ing an indirect assessment at these scales include the flux tower (Malhi et al., 1998; Saleska et al., 2003) and litter trap observations (Chave et al., 2008). However, these methods do not allow the direct estimation of the extent and dura-tion of the leafless stage. Indeed, episodes of increased CO2
release may be due to increased soil respiration (Saleska et al., 2003), whereas higher leaf-litter fall may be concomitant with new leaf flushes. Pheno-cameras (Saitoh et al., 2012) are an alternative, although automating data processing may prove complex if one is to obtain quantitative data over sig-nificant forest extents.
Recent progress in satellite technologies offers new prospects for the large-scale monitoring of leaf phenology using daily optical-satellite records (i.e., Hyper-temporal data, e.g., from Moderate Resolution Imaging Spectrora-diometer (MODIS) sensors) through the seasonal dynam-ics of canopy reflectance and composite vegetation indices and products such as the Enhanced Vegetation Index (EVI) or the Leaf Area Index (LAI). These radiometric variations are expected to depend on the canopy structure, relative leaf area, leaf age and physiological status (Huete et al., 2002). These variations may also, less desirably, be due to seasonal changes in the atmosphere, such as aerosol concentrations (Asner and Alencar, 2010), or to uncorrected BRDF (Bidi-rectional Reflectance Distribution Function) effects, such as the seasonal variation in sun height. Despite these potential caveats, unexpected temporal patterns have been consistently observed over Amazonian forests. In particular, peaks in veg-etation indices (EVI and LAI) occurred in phase with cycles of incoming radiation (Bradley et al., 2011; Brando et al., 2010), suggesting that light could be an important limiting or driving factor in rainforests.
Here again, scale transfer is an issue because a pixel res-olution of 1 km at best is typically employed in such studies to ensure the continuity of the temporal data series in areas of high haze and cloud cover frequency. This is two orders of magnitude greater than the size of the reference plots, typi-cally 1 ha or less, that are used for ground-based verification studies. Therefore, it has not been possible to date to establish
a clear link between EVI variations and canopy phenology in a tropical forest context and the subject remains highly con-troversial, notably in studies over the Amazon region (Asner and Alencar, 2010; Samanta et al., 2011).
The growing availability of multiscale/multiresolution re-mote sensing data now allows us to bridge this scale gap. In-deed, although they do not permit continuous monitoring of the phenological cycle, optical data at higher spatial resolu-tions provide snapshots of the proportion of deciduous trees in the canopy (Bohlman, 2010).
In this study, we explore the feasibility and meaning of a phenological characterization of tropical forests at regional scale using a multi-sensor approach. We have focused here on a diverse mosaic of forest types straddling the borders of Cameroon, Congo and Gabon, within the Tri_National Dja Odzala Minkebe (TRIDOM) landscape. White (1983) classi-fied this area within the Guineo–Congolese phytogeographic region. Interestingly, according to several authors (Lebrun and Gilbert, 1954; Letouzey, 1985; Schnell, 1970), the cli-matic conditions of the area are transitional (delineated by 1600 mm Mean Annual Precipitation, MAP) between pri-marily evergreen and pripri-marily deciduous forest types. This transition is characterized by a progressive gradient in the density of deciduous trees in the upper canopy rather than a sharp ecotone. Superimposed on the deciduousness gradient is a second gradient of age since perturbation, with a variety of secondary forests of different maturity levels. A number of regional-scale vegetation maps exist for Central Africa. The earliest were based on photointerpretation (Boulvert, 1986; Letouzey, 1985) or classical phytogeographic approaches (White, 1983). Some of these maps were quite detailed, but interpretation required long years of work using subjective methods, making automation and regional comparisons dif-ficult. More recent approaches were based on combinations of satellite optical, LiDAR and/or RADAR (Baccini et al., 2012; Hansen et al., 2008; Mayaux et al., 2004; Saatchi et al., 2011; Verhegghen et al., 2012). Mayaux (2004) and Ver-hegghen (2012), in particular, used the temporal variation in SPOT VEGETATION NDVI data to characterize the pheno-logical signatures of different ecosystems across Africa with a 1 km resolution. However, apart from very large swamps, young secondary forests or montane forests, none of these re-cent large-scale maps has allowed precise distinctions to be made between the different types of dense forests observed on the ground in intermingled patchworks, with sometimes sharp and sometimes progressive transitions between each other, forming patterns at both the landscape and the region scale. Compared to previous works that have used medium-resolution optical data (i.e. 100 m to 1 km medium-resolution) for tropical forest mapping and canopy reflectance monitoring, the novelty of our approach is threefold. (1) We maintained an optimal spatial resolution of 250 m for the temporal data by aggregating eleven years of MODIS terra EVI data over the two main seasons. (2) We used high- (10 m resolution) and very-high-resolution (0.5 m resolution) data to bridge the
scale gap between the stand and MODIS pixel levels and thus reached a quantitative interpretation of the EVI variations in terms of the proportion of leaved trees during the dry season. (3) We distinguished and mapped several dense-forest types based on this quantitative phenological proxy.
2 Material 2.1 Study site
The study area covers approximately 141 000 km2of the NW edge of the Congo Basin at the borders between the Republic of Congo, Gabon and Cameroon. This area broadly covers the Dja-Odzala-Minkébé (Tridom) Landscape (COMIFAC Tridom intergovernmental collaboration agreement, 2005), of which approximately 25 % is protected, including seven national parks and one fauna reserve. Geomorphologically, the area sits on a hilly plateau ranging between 300 and 1000 m a.s.l., with localized inselberg outcrops. Proximity to the equator induces a bimodal rainfall regime, with two dry seasons centered in January (main season) and July (small season), totaling four to five dry months, and two wet sea-sons centered in October and April. Mean annual precip-itation ranges from 1600 mm in the east to 2000 mm in the west. These climatic conditions create a transition from mostly evergreen to mostly deciduous forest types (Lebrun and Gilbert, 1954; Letouzey, 1985; Schnell, 1970). At one extreme of the deciduous gradient stand evergreen forests, dominated by Caesalpiniaceae. Gilbertiodendron dewevrei-dominated patches are a peculiar case in these forests. Although strikingly mono-dominant evergreen forests are nearly ubiquitous in the center of the Congo Basin, they reach the limit of their distribution in the study area, which may partly explain why they mostly occupy lower topo-graphic positions (Letouzey, 1968). At the other extreme are forests dominated by Cannabaceae (ex. Ulmaceae, Celtis spp.) and Malvaceae (ex. Sterculiaceae, e.g. Cola spp.), for which deciduous trees make up to 70 % of the upper canopy (Lebrun and Gilbert, 1954). Superimposed on this decidu-ousness gradient is a second gradient of age since perturba-tion, with a variety of secondary forests of different maturity levels. In the temporal succession, Musanga cecropioides is the first tree species to close the canopy. This fast-growing pi-oneer is progressively outgrown by hemi-heliophilous trees, such as Triplochiton scleroxylon, Alstonia Boonei and Termi-nalia superba (Schnell, 1970). These latter trees are mostly deciduous, adding to the complexity of forest classification. The older secondary forests can, in some cases, remain in the succession process for a long period of time when the prolif-eration of Marantaceae lianas develops in the undergrowth, alone or in combination with the activity of large mammals, blocking the regeneration of trees (De Foresta and Massimba, 1990; Letouzey, 1968). These latter forests present a striking gap in the vertical forest stratification, with only scattered
tall trees (hence the name open forests) rising to 40 m or so in height and surrounded by the liana layer, which is only a few meters high. Swamp forests typically have various densi-ties of Uappaca paludosa trees, with their characteristic stilt roots, and Raphia palms. In the NW, stands of Sterculia vi-olacea are more dominant in swamp forests. At the south-ern end of the study area lies the northsouth-ernmost extent of the Bateke savannas and Kalahari sands.
2.2 Imagery
Temporal information on canopy reflectance was obtained from the MOD13Q1 product (collection 5) of the Moder-ate Resolution Imaging Spectroradiometer (MODIS). This product is composited every 16 days at a spatial resolution of 250 m and includes the Red (0.62–0.37 µm), NIR (0.841– 0.876 µm), Blue (0.459–0.479 µm) and MIR (1.2–1.25 µm) spectral bands as well as the derived ‘enhanced’ vegetation index, or EVI. The EVI (EVI = 2.5 (NIR - Red) / (NIR + 6Red − 7.5Blue + 1) (Gao et al., 2000) optimizes the veg-etation signal with improved sensitivity in high biomass gions and reduces atmospheric influences, whereas MIR re-flectance from a closed vegetation canopy is determined pri-marily by canopy water content (Boyd and Petitcolin, 2004). The study area is covered by the tile h19v08 and has a ground area of 250 000 km2. We downloaded all available dates for this tile between January 2000 and December 2011. In spite of atmospheric corrections, the presence of almost perma-nent clouds and haze largely corrupted the data. To gener-ate a good quality composite at a 250 m resolution, we ag-gregated eleven years of valid data (after filtering for pixel reliability and quality using layers provided with the prod-uct) for the EVI index and middle-infrared reflectance (MIR) for both the principal dry season (15 November–15 February, months with less than 100 mm rainfall, consistent with Ara-gao et al. (2007)) and wet season (15 February–15 Novem-ber). This approach is an important simplification that ne-glects both inter-annual variations in dry-season length or severity and the existence of a shorter and less intense dry season centered on July. However obtaining a coherent data set required finding a compromise between the spatial and the temporal resolution, and we chose here to sacrifice the latter (e.g. as opposed to (Gond et al., 2013; Bradley et al., 2011). We thus obtained aggregated EVI and MIR images for the wet season and for the main dry season.
We obtained 25 archive SPOT-5 ©CNES images at pre-treatment level 1b (high resolution, HR) for the main dry sea-son from the CNES-ISIS program. Two particularly cloud-and haze-free dry-season images (lat 5.14,long 12.97 cloud-and lat 3.51,long 16.02) were chosen within this data set to calibrate quantitative relationships between leafiness and EVI varia-tions. Each image covered an area close to 4000 km2. These images had a pixel size of 10 m and were composed of four spectral bands: Green (0.5–0.59 µm), Red (0.61–0.68 µm), NIR band (0.78–0.89 µm) and MIR band (1.58–1.75 µm).
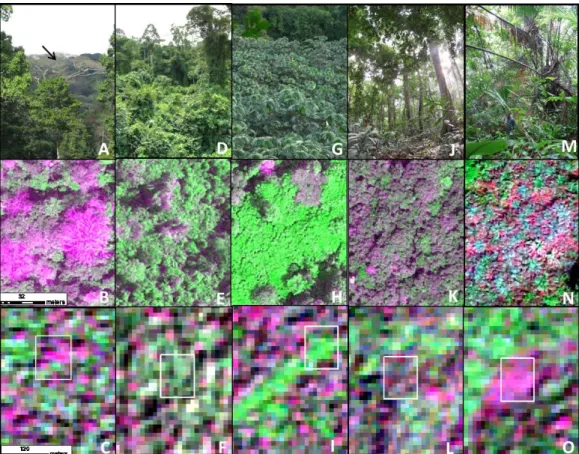
Fig. 1. Characteristics and criteria for visual discrimination of the main forest types on ground photographs, Red/Near Infrared/Green
very-high-spatial-resolution GeoEye and high-spatial-resolution SPOT-5 composites acquired in Dry Season. A-D-G-J-M: Ground level or canopy level pictures. B-E-H-K-N: Extracts from a very-high-spatial-resolution GeoEye image (0.5 m pixels). C-F-I-L-O: Extracts from a high-spatial-resolution SPOT-5 image (10 m pixels). Footprint of the corresponding GeoEye image appears in the form of white rectangle. A-B-C: Mixed forests (MF 1–4). The arrow indicates a leafless tree (A). On the GeoEye image (B), deciduous trees show pinkish bare crowns and branches. On the SPOT image, deciduous trees appear as patches of a few pink pixels (C); D-E-F: Open Marantaceae forests; G-H-I: Young Secondary Forest; J-K-L: Monodominant Gilbertiodendron dewevrei forests; M-N-O: Swamp Forest with dominance of Raphia. spp.
Four very-high-resolution (VHR) main-dry-season images (GeoEye) were acquired within areas covered by the SPOT-5 image data set. Each image covers an area of the study area close to 100 km2. The sensor spatial resolution of the multi-spectral bands (2 m) was improved using a Brovey Pansharp-ening algorithm (Vrabel, 1996), resulting in a final pixel size of 0.5 m. Each image is composed of four spectral bands: Blue (0.45–0.51 µm), Green (0.51–0.58 µm), Red (0.655– 0.69 µm) and NIR (0.78–0.92 µm).
All images were orthorectified and referenced against the Landsat GeoCover mosaic (Tucker et al., 2004) and SRTM topography (Farr et al., 2007) products. Both HR and THR images were visually analyzed as color (R-G-B) composites of the Red-NIR-Green bands.
3 Methods
3.1 Mapping of forest types
Reference areas were delimited by visual interpretation of pansharpened GeoEye (VHR) images. With a spatial resolu-tion of 0.5 m, these images allowed the discernment of forest structural types (Fig. 1) on the basis of general canopy pat-terns (texture) (Barbier et al., 2010; Couteron et al., 2005) thanks to the field experience in the region of some of the authors. In addition, the multi-spectral information allowed the discernment of leaved vs. deciduous crowns, which is of paramount importance for this study. It is worth noting that photointerpretation has a long tradition in forestry, in-cluding in our study area, where Letouzey (1985) mapped forest types using aerial photography (1:50 000). To expand the training areas, we made use of the intermediate scale of-fered by the SPOT imagery set. On these HR images, the main forest types were still distinguishable through radio-metric variations that could be locally interpreted in relation
to the VHR imagery (Fig. 1), but were not reliable enough for large-scale mapping given the numerous (atmospheric, instrumental etc.) sources of radiometric instability. The ref-erence areas obtained were used in a maximum-likelihood, supervised classification applied to the MODIS EVI and MIR (wet season and dry season) composite bands, with the aim to segment broad qualitative forest types over the whole study area, based on both the radiometry and its temporal variation.
3.2 Quantifying leafiness
Deciduous and leaved trees (Fig. 1a) are clearly distinguish-able on both VHR and HR images (Fig. 1b–c). In both images, the deciduous crowns are distinguishable mainly because they have high Red reflectance and low NIR re-flectance. In the GeoEye images, one can clearly distinguish bare branches and twigs (Fig. 1b), whereas in SPOT-5 im-ages, bare crowns are only visible as patches a few pix-els wide with high reflectance in the Red band and low re-sponse in the NIR band (appearing in pink on the composites presented in Fig. 1c). This spectral property allows decidu-ous versus leaved trees to be distinguished at multiple spa-tial scales. A simple, local, radiometric thresholding of the SPOT-5 images was therefore used for the segmentation of the leaved vs. deciduous crowns. However, radiometric cor-rections were crucial to ensure the consistency of spectral re-sponses within and between images. Large patches of haze, particularly noticeable in the Red band, were removed via a high-pass Fourier filter (Niblack, 1986). Radiometric his-tograms were then aligned between the images by standard-ization around the mean, under the assumption that forest images had globally similar radiometric amplitude. To sep-arate leaved vs. leafless pixels, threshold values in the Red and NIR bands were carefully selected for each SPOT-5 im-age, using the VHR GeoEye data as a visual reference. Bi-nary masks were thus created and leaved SPOT-5 pixels were counted within areas corresponding to the MODIS 250 m pixels.
We used model II linear regression to compare the propor-tion of leaved pixels on SPOT-5 images taken in the dry sea-son against aggregated (2011 and 2000–2011 periods) dry-season EVI values. These calculations were used to calibrate a linear-inversion rule for the prediction of forest deciduous-ness over the whole study area.
4 Results
4.1 Forest segmentation
Photointerpretation on Red-NIR-Green, very-high-resolution (GeoEye) composites allowed a visual dis-crimination of forest types having contrasting characteristics (Fig. 1). On SPOT-5 composites at a 10 m spatial resolution, differences between forest types were still locally detectable as subtle spectral variations (Fig. 1). This fact allowed the
creation of reference polygons over sufficient areas to be scaled up to the MODIS level.
In more detail, mixed forests (MF1–4) are terra firme forests, without obvious secondarisation symptoms present-ing a multilayered vertical structure and a variable proportion of deciduous trees species in or above the main the canopy (Fig. 1a). In the VHR composite images, MF appeared as a mixture of pinkish, large, bare crowns and branches of emer-gent deciduous trees and green-leaved crowns of other broad-leaved trees, without obvious signs of degradation (Fig. 1b– c). MF were separable from the other types, but less so among themselves, due to the continuous variation in the pro-portion of leafless crowns.
Open forests (OF) were composed of Marantaceae forests with large trees interspersed within a light-green, highly pho-tosynthetic matrix of tall herbs and lianas (Fig. 1d–f). Inter-mediate strata are mostly absent. Tree crowns may in some cases form a nearly closed cover, but most often, they let the Marantaceae carpet appear, conditioning a texture char-acterized by both fine- (undergrowth) and coarse- (isolated crowns) grained patterns on GeoEye imagery (Fig. 1e). Ap-pearance of the undergrowth also tends to produce high re-flectance levels in the NIR, producing light green patches in the SPOT composites (Fig. 1f). Young Secondary Forests (YSF) in the early post-disturbance stages showed a fine-grained texture on GeoEye composites (Fig. 1h). Musanga cecropioides trees tended to form a uniform cover with very high NIR reflectance values (Fig. 1g, i) while deciduous trees were generally absent. Monodominant Gilbertioden-dron dewevrei forests (GDF1-2) presented a typical fine-grained texture, due to the even-size and high-density dis-tribution of canopy trees (Fig. 1j–l). Deciduous trees ap-peared only occasionally. Possibly in relation to low leaf re-flectance and pendulous-angle distribution of the dominant species, global reflectances in NIR and Red were surpris-ingly low, as indicated by dark tones on the GeoEye and SPOT composites and by low EVI values in both MODIS seasonal coverages. Swamp forests (SF), were easily recog-nizable on GeoEye images (Fig. 1n) by the dominance of Raphia spp. palms with a characteristic star-shaped appear-ance. In dry-season images, Raphia trees presented low NIR and high Red reflectances, making them appear leafless, but MIR values were also characteristically low (See Appendix S1 in Supplement).
A maximum-likelihood supervised classification was ap-plied to the EVI and MIR wet-season and dry-season com-posite images on the basis of the references polygons. Al-though differences between forest classes are significant in the EVI, separability (measured using the Jeffries-Matusita Distance (Richards, 1999)) was improved by including MIR dry and wet-season aggregated images. This was particularly important to discriminate swamp forests, as MIR values are significantly lower than any other class, especially in the dry season (Table 1, Appendix S1 in Supplement).
Table 1. Newman–Keuls multi-comparison test after two-factor (season + class) analysis of variance of enhanced vegetation index (EVI)
and middle-infrared reflectance (MIR).
Forest class Season N Mean EVI Std. Err EVI Group Mean MIR Std. Err MIR Group
GDF1 DS 354 3693 5.95 B 481 0.93 C GDF1 WS 354 4604 6.47 K 527 0.89 G GDF2 DS 501 3756 6.07 C 467 0.95 B GDF2 WS 501 4236 6.50 G 517 1.12 F MF1 DS 742 4272 3.57 H 493 0.63 D MF1 WS 742 4651 3.45 L 496 0.79 D MF2 DS 766 3911 3.45 E 483 1.66 C MF2 WS 766 4644 3.37 L 518 1.20 E-F MF3 DS 211 4200 6.62 F 578 3.82 J MF3 WS 211 4951 6.48 N 559 1.60 I MF4 DS 440 3831 4.84 D 509 0.95 E MF4 WS 440 4958 5.51 N 552 1.18 I OF DS 211 4473 8.46 J 535 3.39 G-H OF WS 292 5338 8.55 P 596 3.62 K SF DS 70 3538 15.81 A 419 3.78 A SF WS 70 4384 15.07 I 472 2.83 B YSF DS 380 4709 8.68 M 540 2.41 H YSF WS 380 5309 9.16 O 580 2.33 J
Abbreviations: GDF: monodominant Gilbertiodendron dewevrei forests; MF: mixed forest; OF: open forest; YSF: young secondary forest; SF: swamp forest; DS: dry season; WS: wet season.
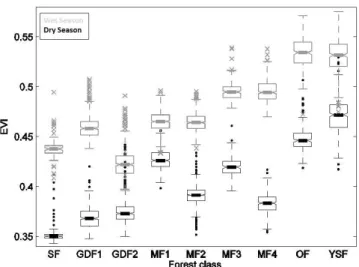
Fig. 2. Distributions of EVI values for the different forest classes.
Box plots summarize EVI values aggregated between 2000 and 2011 for each (wet and dry) season. Two-factor (season + class) analysis of variance of EVI test rejected the null-hypothesis of equality-of-mean EVI values for all the types of forests and seasons (p < 0.0001). See also Table 1. Abbreviations: GDF (1–2): mon-odominant Gilbertiodendron dewevrei forests; MF (1–4): mixed forest; OF: open forest; YSF: young secondary forest; SF: swamp forest.
We extracted the spectral signatures of each forest class in the EVI dry-season and wet-season aggregated images. The distribution of wet- and dry-season mean EVI values within each forest class is depicted in Fig. 2 with summary
distri-bution statistics (box plots). Importantly and as expected, mean dry-season EVI values were always lower than mean wet-season values for all forest types (Fig. 2). A two-factor (season + forest class) analysis of variance was significant (p < 0.0001) for both factors tested and for their interac-tion. Basic assumptions of normality and homoscedasticity were verified. Inter-class and inter-season differences of the mean EVI values were tested using a Newman–Keuls multi-comparison test. All classes and seasons showed very signifi-cant differences (p < 0.0001) between each other, except for the MF2/MF1 and MF3/MF4 pairs (see Table 1), which were not significantly different in wet season. Overall, three broad groups stood out (Fig. 2). The first group contained swamp forests (SF) and monodominant Gilbertiodendron dewevrei forests (GDF1 and GDF2) and presented low mean EVI val-ues throughout the two seasons. On the other hand, the group containing open Marantaceae forests (OF) and young sec-ondary forests (YSF) displayed consistently high mean EVI values. The mixed forests (MF1 to MF4) formed a third group presenting intermediate EVI values with noticeable interclass differences in annual variability. Indeed, EVI dis-tributions became increasingly bimodal (i.e. showing higher difference between the dry and wet-season values) from MF1 to MF4, suggesting varying degrees of deciduousness.
4.2 Quantifying and predicting leafiness
To illustrate the relationship between the phenological char-acterizations performed using high-resolution SPOT-5 im-ages and the MODIS mean EVI values, Fig. 3 maps the
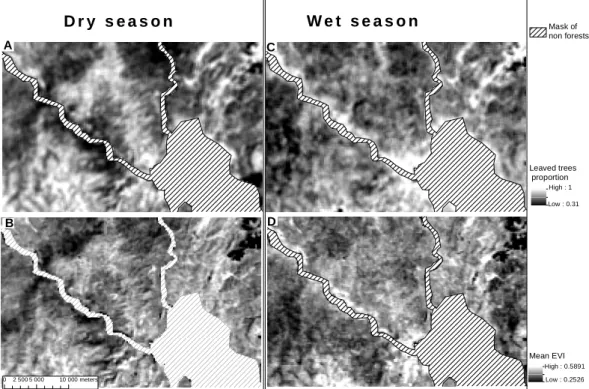
A C 0 2 5005 000 10 000meters A B C D Leaved trees proportion Low : 0.31 High : 1 B
D r y s e a s o n
W e t s e a s o n
Mean EVI High : 0.5891 Low : 0.2526 Mask of non forestsFig. 3. Maps of the proportion of fully- or partially leaved trees vs. mean EVI values averaged for either the dry or the wet season. (A and B): maps of the proportion of leaved trees (A) and mean EVI values averaged (B) for dry season. (B and D): maps of the proportion of leaved
trees (C) and mean EVI values averaged (D) for wet season. Masked areas are non-forests.
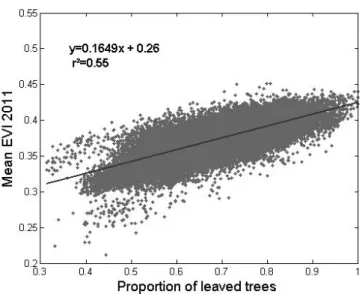
spatial patterns in the proportion of leaved pixels and mean EVI values for the dry and wet seasons. The EVI and pro-portion of leaved pixels varied spatially and temporally in a similar way. More quantitatively, a good correlation was obtained between the proportion of leaved pixels estimated form SPOT-5 dry-season images (2011) and mean EVI val-ues averaged over the single 2011 dry season (Fig. 4, n = 43 498, R2=0.55, p value <0.05, major axis regression:
y =0.1649x + 0.26). Slightly different values were obtained when using dry-season EVI values averaged for the 2000– 2011 period (n = 43 498, R2=0.48, p value <0.05, major axis regression: y = 0.1290x + 0.30). However, because of the longer averaged period, the latter EVI composite layer proved more stable in terms of radiometric quality (absence of obvious discontinuities) over the study area.
We therefore used the 2000–2011 regression coefficients and EVI composite layer to perform a linear inversion of leafiness values over the entire study area. The resulting map, shown in Fig. 5, combined qualitative information for the YSF, OF, GDF, and SF classes and for other non-forest land-cover classes, as well as the values of the quantitative leafi-ness variable within the MF class. The map presents a very coherent spatial structure, with degraded forest types (YSF, OF) primarily located near inhabited localities and road net-works, GDF and SF forming localized pockets in lower to-pographic positions, and dry-season leafiness values varying over broad regions. Additionally, the most deciduous forests
(lower-leafiness values) were primarily located in the driest eastern part of the study area.
5 Discussion
Our results show that the mean, dry-season EVI is linearly and positively correlated with the proportion of leaved trees in the canopy, as can be assessed using high- and very-high-spatial-resolution images. This correlation provides strong evidence that a large share of the variability in canopy re-flectance summarized in the EVI at stand level (250 m pix-els) in the mixed forests (MF) of West-Central Africa is due to variation in the proportion of leaved trees in the up-per canopy. In our study area, mixed forests displayed the broadest extent and also the largest inter-annual variations in EVI. In addition, our approach allowed mapping of eco-logically important forest types that presented consistently high (young secondary forests and open Marantaceae forests) or consistently low EVI values (Gilbertiodendron dewevrei forests and swamp forests). Another important result con-cerning the influence of climate drivers is that in all of the for-est types identified, the lowfor-est EVI values were observed dur-ing the main dry season. This element contrasts with finddur-ings from other tropical forests, notably in the Amazon Basin, where different relationships between climate and EVI vari-ation were reported. Indeed, over large areas of the Ama-zon region, the EVI peaked in the dry season, in phase with
Fig. 4. Linear model II regression between the proportion of leaved
trees and mean EVI values averaged for the dry season of 2011. x axis: proportion of leaved trees calculated for two different SPOT-5 images acquired in January of 2011 (dry season). y axis: mean EVI values for the dry season of the year 2011. The analysis is performed at the resolution of the MODIS product (250 m).
higher incoming light periods (Brando et al., 2010; Huete et al., 2006; Myneni et al., 2007). However, the dry sea-son is generally very cloudy over West-Central Africa (Riou, 1984). Therefore, incoming light levels are higher in the wet season. In other words, it is difficult on correlative grounds to decide whether water or light was the main climatic driver or limiting factor for our study area. It is possible however, that both water and light reach their least limiting levels dur-ing the main wet season. In any case, the multi-resolution approach presented here could be easily applied to different contexts, thereby enabling comparisons.
The share of EVI variation that remained unexplained by leafiness values may have come from a number of different sources, including the imperfect temporal match between the data sources. HR and VHR images were opportunistic snap-shots through the clouds, whereas a consistent coverage of MODIS data required aggregating data over long periods of time. Additionally, the radiometric (e.g., atmospheric, Bidi-rectional Reflectance Distribution Function – BRDF) correc-tions performed over the different data sets were imperfect. For instance, the sun height is not accounted for in MODIS data filtering algorithms (Vermote et al., 2002), despite the fact that this factor varies seasonally and does influence the BRDF. However, systematic “in phase” variations between sun height and EVI were not evident in preliminary tests we made over different areas, including the Amazon Basin (re-sults not shown). Last but not least, other biological sources of variation in canopy reflectance may have been in play, such as variations in canopy structure, leaf age, and
flower-ing and fruitflower-ing episodes (Borchert, 1996; van Schaik et al., 1993).
Considering all of these error sources and the known com-plexity in leaf phenology within and among tree species in tropical forests (Reich, 1995), the correlation obtained be-tween leafiness values and EVI is surprisingly good and consistent with Bohlman (2010). This correlation is very much in line with the coherent regional patterns displayed by the seasonal variations of the EVI. This suggests that stand-level leaf-phenology signatures do indeed exist at large scales, indicating some degree of synchrony in tree phenol-ogy (Borchert et al., 2002; van Schaik et al., 1993).
The spatial distribution of leafiness values and of the var-ious forest types we mapped was largely consistent with ex-isting detailed or phytogeographic vegetation maps for the region we studied (Letouzey, 1968; White, 1983). Indeed, we found a gradient in the density of deciduous trees in the upper canopy of mixed forests that decreased from the northwest to the southeast of the study area, as has been suggested by several authors (Lebrun and Gilbert, 1954; Letouzey, 1985; White, 1983). Degraded forest types (YSF, OF) were primarily located near inhabited localities and road networks. Gilbertiodendron dewevrei forests were often lo-cated in confined pockets in lower topographic positions of the southeast of Cameroon, as was observed by Letouzey (1968). Landscape-scale variations, in the form of intermin-gled mosaics, corresponded to complex biological (i.e., vari-ations in species abundance), environmental substratum con-ditions (Gourlet-Fleury et al., 2011), and historically nu-merous, ancient settlements (Cinnamon, 2003). A compar-ison of our map with the reference map of Mayaux (2004) (See Appendix S2 in Supplement) illustrates the important gain in detail regarding the discrimination of forest types. The purpose and scale of these maps is different, as the lat-ter map covers the entire continent. However, in Mayaux’s map, all mixed deciduous forests types, as well as open Marantaceae forests, were grouped under unit 40 or “Closed to open broadleaved evergreen or semi-deciduous forest”. Gilbertiodendron monodominant stands, on the other hand, were grouped with swamp forests and open water/marshes within unit 160 or “Closed to open broadleaved forest reg-ularly flooded”. A quick comparison (not shown) with the benchmark biomass map of Saatchi (Saatchi et al., 2011) showed a generally lower biomass (<150 Mg DM ha−1) in areas dominated by open Marantaceae forests (e.g., in the Congolese region). However, pockets of Gilbertiodendron forests, which should present significantly higher biomass levels (Djuikouo et al., 2010), did not show up on the bench-mark map. Numerous field visits performed by some of the authors also provided information for data validation. How-ever, a systematic/statistical analysis of the correspondence between floristic gradients and phenology patterns would require very large data sets that have not yet been gath-ered. Forest-management inventories could prove useful in this regard (Gond et al., 2013; Gourlet-Fleury et al., 2011;
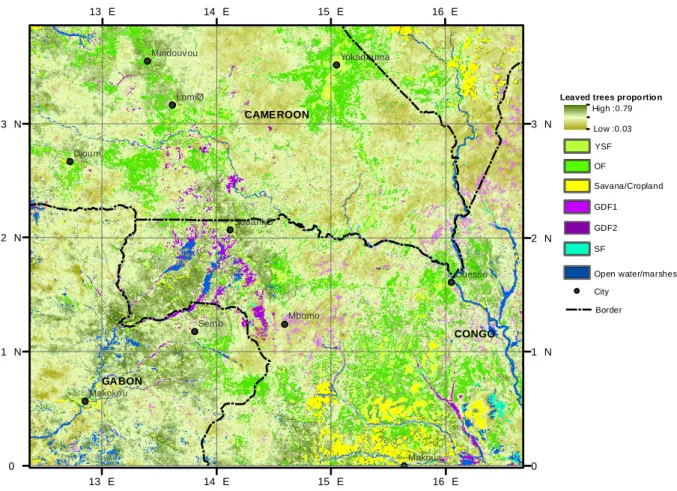
GABON CONGO CAMEROON Sem b Mbomo Djoum LomiØ Makoua Ouesso Makokou SouankØ Yokadouma Mindouvou 16 E 16 E 15 E 15 E 14 E 14 E 13 E 13 E 3 N 3 N 2 N 2 N 1 N 1 N 0 0 CAMEROON CONGO GABON GDF2 SF YSF GDF1 City Border Leaved trees proportion
Low :0.03 High :0.79
Savana/Cropland
Open water/marshes OF
Fig. 5. Map of the distribution of the main forest classes (open forest, young secondary forest, swamp forest and monodominant
Gilbertio-dendron dewevrei forests) along with the MODIS-predicted leaved trees proportion within the mixed forest class (Map Projection WGS84).
The entire map was derived from remotely sensed MODIS pixels of 250 m (aggregation of dry-season values). The leaved tree proportion within the MF class was predicted by linear inversion of the leafiness equation: y = 0.1290x + 0.3, where y is dry-season EVI values aver-aged over the 2000–2011 period and x the proportion of leaved trees counted on SPOT 5 images. Abbreviations: GDF (1–2): monodominant
Gilbertiodendron dewevrei forests; OF: open forest; YSF: young secondary forest; SF: swamp forest.
Maniatis et al., 2011). Another important path that needs to be explored further is the modeling of radiative trans-fer in 3-D, forest-stand models (Barbier et al., 2011, 2012; Gastellu-Etchegorry, 2008). Even with a crude parameteriza-tion of forest structure and surface/volume scattering proper-ties, such models have proven their usefulness for detecting both instrumental and biological sources of variability and perturbation (Barbier et al., 2011). After long-lasting contro-versy over the possible meaning and caveats of reflectance variations in Amazon canopies (Huete and Saleska, 2010; Samanta et al., 2011), these new research tracks offer excit-ing opportunities to bridge the scale gap between field ob-servation and large-scale, remotely sensed patterns that are accessible through MODIS imagery. A rigorous large-scale quantitative characterization of canopy phenology opens ex-iting potential for the parameterization of more realistic, dy-namic global vegetation models (Bonan, 2008), or, more gen-erally, for the strategic monitoring of forest cover in tropical countries.
Supplementary material related to this article is available online at http://www.biogeosciences.net/10/ 6957/2013/bg-10-6957-2013-supplement..
Acknowledgements. SPOT images were acquired in the framework
of the SPOT/Programme ISIS, Copyright CNES. This research is part of the pilot regional program (PPR) “Global changes biodiversity and health in the tropical wet forests of Central Africa” of the IRD and has benefited from the support of various partner institutions and researchers. We are especially grateful to Bonaventure Sonké, Vincent Droissart, and Mr. Pierre Ploton for sharing their field experience and helping us to interpret our results.
References
Aragão, L. E. O., Malhi, Y., Roman-Cuesta, R. M., Saatchi, S., An-derson, L. O., and Shimabukuro, Y. E.: Spatial patterns and fire response of recent Amazonian droughts, Geophys. Res. Lett., 34, L07701, doi:10.1029/2006GL028946, 2007.
Asner, G. P. and Alencar, A.: Drought impacts on the Amazon for-est: the remote sensing perspective, New Phytol., 187, 569–578, 2010.
Baccini, A., Goetz, S. J., Walker, W. S., Laporte, N. T., Sun, M., Sulla-Menashe, D., Hackler, J., Beck, P. S. A., Dubayah, R., and Friedl, M. A.: Estimated carbon dioxide emissions from tropi-cal deforestation improved by carbon-density maps, Nat. Clim. Change, 2, 182–185, doi10.1038/nclimate1354, 2012.
Barbier, N., Couteron, P., Gastelly-Etchegorry, J. P., and Proisy, C.: Linking canopy images to forest structural parameters: potential of a modeling framework, Ann. For. Sci., 69, 305–311, 2012. Barbier, N., Couteron, P., Proisy, C., Malhi, Y., and
Gastellu-Etchegorry, J.-P.: The variation of apparent crown size and canopy heterogeneity across lowland Amazonian forests, Glob. Ecol. Biogeogr., 19, 72–84, 2010.
Barbier, N., Proisy, C., Véga, C., Sabatier, D., and Couteron, P.: Bidirectional texture function of high resolution optical images of tropical forest: An approach using LiDAR hillshade simula-tions, Remote Sens. Environ., 115, 167–179, 2011.
Bohlman, S. A.: Landscape patterns and environmental controls of deciduousness in forests of central Panama, Glob. Ecol. Bio-geogr., 19, 376–385, 2010.
Bonan, G. B.: Forests and climate change: forcings, feedbacks, and the climate benefits of forests, Science, 320, 1444–1449, 2008. Borchert, R.: Phenology and flowering periodicity of Neotropical
dry forest species: evidence from herbarium collections, J. Trop. Ecol., 12, 65–80, 1996.
Borchert, R., Rivera, G., and Hagnauer, W.: Modification of Vege-tative Phenology in a Tropical Semi-deciduous Forest by Abnor-mal Drought and Rain1, Biotropica, 34, 27–39, 2002.
Boulvert, Y.: Carte phytogéographique de la République Cen-trafricaine (feuille Ouest-feuille Est) à 1: 1000000, 1986. Boyd, D. S. and Petitcolin, F.: Remote sensing of the terrestrial
en-vironment using middle infrared radiation (3.0–5.0 µm), Int. J. Remote Sens., 25, 3343–3368, 2004.
Bradley, A. V., Gerard, F. F., Barbier, N., Weedon, G. P., Anderson, L. O., Huntingford, C., Aragao, L. E. O. C., Zelazowski, P., and Arai, E.: Relationships between phenology, radiation and pre-cipitation in the Amazon region, Glob. Change Biol., 17, 2245– 2260, 2011.
Brando, P. M., Goetz, S. J., Baccini, A., Nepstad, D. C., Beck, P. S. A., and Christman, M. C.: Seasonal and interannual variability of climate and vegetation indices across the Amazon, Proc. Natl. Acad. Sci., 107, 14685–14690, 2010.
Chave, J., Condit, R., Muller-Landau, H. C., Thomas, S. C., Ashton, P. S., Bunyavejchewin, S., Dattaraja, H. S., Davies, S. J., Esufali, S., Ewango, C. E. N., Feeley, K. J., Foster, R. B., Gunatilleke, N., Gunatilleke, S., Hall, P., Hart, T. B., Hernández, C., Hubbell, S. P., Itoh, A., Kiratiprayoon, S., LaFrankie, J. V., Loo de Lao, S., Makana, J.-R., Supardi Noor, N., Rahman Kassim, A., Samper, C., Sukumar, R., Suresh, H. S., Tan, S., Thompson, J., Tongco, D. C., Valencia, R., Vallejo, M., Villa, G., Yamakura, T., Zimmer-man, J. K., and Losos, E. L.: Assessing evidence for a pervasive alteration in tropical tree communities, Plos Biol., 6, e45, 2008.
Cinnamon, J.: Narrating equatorial African landscapes: conserva-tion, histories, and endangered forests in northern Gabon, J. Colon. Colon. Hist., 4, 2003.
Couteron, P., Pelissier, R., Nicolini, E. A. and Paget, D.: Predicting tropical forest stand structure parameters from Fourier transform of very high-resolution remotely sensed canopy images, J. Appl. Ecol., 42, 1121–1128, 2005.
Djuikouo, M. N. K., Doucet, J. L., Nguembou, C. K., Lewis, S. L. and Sonké, B.: Diversity and aboveground biomass in three tropical forest types in the Dja Biosphere Reserve, Cameroon, Afr. J. Ecol., 48, 1053–1063, 2010.
Farr, T. G., Rosen, P. A., Caro, E., Crippen, R., Duren, R., Hensley, S., Kobrick, M., Paller, M., Rodriguez, E., Roth, L. and others: The shuttle radar topography mission, Rev. Geophys.-Richmond Va. Then Wash., 45, 2007.
De Foresta, H. and Massimba, J. P.: Etude descriptive d’une forêt clairsemée à Marantaceae dans le Mayombe Congolais, ORSTOM, Raymond Lanfranchi et Dominique Schwartz., 1990. Gao, X., Huete, A. R., Ni, W. and Miura, T.: Optical-biophysical relationships of vegetation spectra without background contami-nation, Remote Sens. Environ., 74, 609–620, 2000.
Gastellu-Etchegorry, J. P.: 3-D modeling of satellite spectral im-ages, radiation budget and energy budget of urban landscapes, Meteorol. Atmospheric Phys., 102, 187–207, 2008.
Gond, V., Fayolle, A., Pennec, A., Cornu, G., Mayaux, P., Camber-lin, P., Doumenge, C., Fauvet, N., and Gourlet-Fleury, S.: Vegeta-tion structure and greenness in Central Africa from Modis multi-temporal data, Philos. Trans. R. Soc. B Biol. Sci., 368 (1625), 2013.
Gourlet-Fleury, S., Rossi, V., Rejou-Mechain, M., Freycon, V., Fay-olle, A., Saint-André, L., Cornu, G., Gerard, J., Sarrailh, J. M., and Flores, O.: Environmental filtering of dense-wooded species controls above-ground biomass stored in African moist forests, J. Ecol., 99, 981–990, 2011.
Hansen, M. C., Roy, D. P., Lindquist, E., Adusei, B., Justice, C. O., and Altstatt, A.: A method for integrating MODIS and Landsat data for systematic monitoring of forest cover and change in the Congo Basin, Remote Sens. Environ., 112, 2495–2513, 2008. Huete, A., Didan, K., Miura, T., Rodriguez, E. P., Gao, X., and
Fer-reira, L. G.: Overview of the radiometric and biophysical perfor-mance of the MODIS vegetation indices, Remote Sens. Environ., 83, 195–213, 2002.
Huete, A. R., Didan, K., Shimabukuro, Y. E., Ratana, P., Saleska, S. R., Hutyra, L. R., Yang, W., Nemani, R. R., and Myneni, R.: Amazon rainforests green-up with sunlight in dry season, Geo-phys. Res. Lett., 33, doi:10.1029/2005GL025583, 2006. Huete, A. R. and Saleska, S. R.: Remote Sensing of Tropical Forest
Phenology: Issues and Controversies, Int. Arch. Photogammetry Remote Sens. Spat. Inf. Sci., XXXVIII(8), 2010.
Lebrun, J. and Gilbert, G.: Une classification écologique des forêts du congo, Série scientifique N°63., edited by: P. de l’institut na-tional pour l’étude agronomique du congo belge., 1954. Letouzey, R.: Etude phytogéographique du Cameroun, Lechevalier
Paris France, 1968.
Letouzey, R.: Notice de la carte phytogeographique du Cameroun au 1: 500 000 (1985): 2, M-Sm Reg. Afro-Mont. Etage Submon-tagnard, 27, 1985.
Lewis, S. L., Lloyd, J., Sitch, S., Mitchard, E. T. A., and Laurance, W. F.: Changing ecology of tropical forests: evidence and drivers, Annu. Rev. Ecol. Evol. Syst., 40, 529–549, 2009a.
Lewis, S. L., Lopez-Gonzalez, G., Sonké, B., Affum-Baffoe, K., Baker, T. R., Ojo, L. O., Phillips, O. L., Reitsma, J. M., White, L., Comiskey, J. A., K, M.-N. D., Ewango, C. E. N., Feldpausch, T. R., Hamilton, A. C., Gloor, M., Hart, T., Hladik, A., Lloyd, J., Lovett, J. C., Makana, J.-R., Malhi, Y., Mbago, F. M., Ndan-galasi, H. J., Peacock, J., Peh, K. S.-H., Sheil, D., Sunderland, T., Swaine, M. D., Taplin, J., Taylor, D., Thomas, S. C., Votere, R., and Wöll, H.: Increasing carbon storage in intact African tropical forests, Nature, 457, 1003–1006, 2009b.
Maley, J.: A catastrophic destruction of African forests about 2,500 years ago still exerts a major influence on present vegetation for-mations, Ids Bull., 33, 13–30, 2009.
Malhi, Y., Nobre, A. D., Grace, J., Kruijt, B., Pereira, M. G. P., Culf, A., and Scott, S.: Carbon dioxide transfer over a Central Amazonian rain forest, J. Geophys. Res., 103, 593–31, 1998. Maniatis, D., Malhi, Y., Saint André, L., Mollicone, D., Barbier,
N., Saatchi, S., Henry, M., Tellier, L., Schwartzenberg, M., and White, L.: Evaluating the Potential of Commercial Forest Inven-tory Data to Report on Forest Carbon Stock and Forest Carbon Stock Changes for REDD, Int. J. For. Res., 2011.
Mayaux, P., Bartholomé, E., Fritz, S., and Belward, A.: A new land-cover map of Africa for the year 2000, J. Biogeogr., 31, 861–877, 2004.
Myneni, R. B., Yang, W., Nemani, R. R., Huete, A. R., Dickinson, R. E., Knyazikhin, Y., Didan, K., Fu, R., Negrón Juárez, R. I., Saatchi, S. S., Hashimoto, H., Ichii, K., Shabanov, N.V., Tan, B., Ratana, P., Privette, J. L., Morisette, J. T., Vermote, E. F., Roy, D. P., Wolfe, R. E., Friedl, M. A., Running, S. W., Votava, P., El-Saleous, N., Devadiga, S., Su, Y., and Solomonson V. V.: Large seasonal swings in leaf area of Amazon rainforests, Proc. Natl. Acad. Sci., 104, 4820, 2007.
Niblack, W.: An introduction to digital image processing, Prentice-Hall International., 1986.
Reich, P. B.: Phenology of tropical forests: patterns, causes, and consequences, Can. J. Bot., 73, 164–174, 1995.
Richards, J. A.: Remote Sensing Digital Image Analysis: An Intro-duction, Springer-Verlag, Berlin., 1999.
Richards, P. W.: The tropical rainforest, Cambridge, 1996. Riou, C.: Experimental study of potential evapotranspiration (PET)
in Central Africa, J. Hydrol., 72, 275–288, 1984.
Saatchi, S. S., Harris, N. L., Brown, S., Lefsky, M., Mitchard, E. T. A., Salas, W., Zutta, B. R., Buermann, W., Lewis, S. L., and Hagen, S.: Benchmark map of forest carbon stocks in tropical re-gions across three continents, Proc. Natl. Acad. Sci., 108, 9899– 9904, 2011.
Saitoh, T. M., Nagai, S., Saigusa, N., Kobayashi, H., Suzuki, R., Nasahara, K. N., and Muraoka, H.: Assessing the use of camera-based indices for characterizing canopy phenology in relation to gross primary production in a deciduous broad-leaved and an ev-ergreen coniferous forest in Japan, Ecol. Informatics, 11, 45–54, 2012.
Saleska, S. R., Miller, S. D., Matross, D. M., Goulden, M. L., Wofsy, S. C., da Rocha, H. R., de Camargo, P. B., Crill, P., Daube, B. C., de Freitas, H. C., Hutyra, L., Keller, M., Kirchhoff, V., Menton, M., Munger, J. W., Hammond Pyle, E., Rice, A. H., and Siva, H.: Carbon in Amazon forests: unexpected seasonal fluxes and disturbance-induced losses, Science, 302, 1554, 2003.
Samanta, A., Ganguly, S., and Myneni, R. B.: MODIS enhanced vegetation index data do not show greening of Amazon forests during the 2005 drought, New Phytol., 189, 11–15, 2011. Van Schaik, C. P., Terborgh, J. W., and Wright, S. J.: The phenology
of tropical forests: adaptive significance and consequences for primary consumers, Annu. Rev. Ecol. Syst., 353–377, 1993. Schnell, R.: Introduction a la Phytogeographie des Pays Tropicaux
V.3.„ 1970.
Tucker, C. J., Grant, D. M., and Dykstra, J. D.: NASA’s global or-thorectified Landsat data set, Photogramm. Eng. Remote Sens., 70, 313–322, 2004.
Verhegghen, A., Mayaux, P., de Wasseige, C., and Defourny, P.: Mapping Congo Basin vegetation types from 300 m and 1 km multi-sensor time series for carbon stocks and forest areas esti-mation, Biogeosciences, 9, 5061–5079, doi:10.5194/bg-9-5061-2012, 2012.
Vermote, E. F., El Saleous, N. Z., and Justice, C. O.: Atmospheric correction of MODIS data in the visible to middle infrared: first results, Remote Sens. Environ., 83, 97–111, 2002.
Vrabel, J.: Multispectral imagery band sharpening study, Pho-togramm. Eng. Remote Sens., 62, 1075–1084, 1996.
White, F.: The vegetation of Africa: a descriptive memoir to accom-pany the UNESCO/AETFAT/UNSO vegetation map of Africa, Nat. Resour. Res., 20, 1983.
Wright, S. J. and Van Schaik, C. P.: Light and the phenology of tropical trees, Am. Nat., 192–199, 1994.