HAL Id: hal-01062208
https://hal.archives-ouvertes.fr/hal-01062208
Submitted on 6 Apr 2015
HAL is a multi-disciplinary open access
archive for the deposit and dissemination of
sci-entific research documents, whether they are
pub-lished or not. The documents may come from
teaching and research institutions in France or
abroad, or from public or private research centers.
L’archive ouverte pluridisciplinaire HAL, est
destinée au dépôt et à la diffusion de documents
scientifiques de niveau recherche, publiés ou non,
émanant des établissements d’enseignement et de
recherche français ou étrangers, des laboratoires
publics ou privés.
SPICAM Climatology of Aerosol Vertical Distribution
through UV Occultations
Anni Määttänen, Constantino Listowski, Franck Montmessin, L. Maltagliati,
L. Joly, Aurélie Reberac, Jean-Loup Bertaux
To cite this version:
Anni Määttänen, Constantino Listowski, Franck Montmessin, L. Maltagliati, L. Joly, et al..
SPI-CAM Climatology of Aerosol Vertical Distribution through UV Occultations. The Fifth International
Workshop on the Mars Atmosphere: Modelling and Observations, Jan 2014, Oxford, United Kingdom.
pp.id. 1405. �hal-01062208�
SPICAM CLIMATOLOGY OF AEROSOL VERTICAL DISTRIBUTION THROUGH
UV OCCULTATIONS.
A. M¨a ¨att¨anen, C. Listowski, F. Montmessin, LATMOS, Universit´e Versailles St Quentin, Centre National de la Recherche Scientifique, Guyancourt, France (anni.maattanen@latmos.ipsl.fr), L. Maltagliati, LESIA, Observatoire de Paris, Meudon, France, L. Joly, Groupe de Spectrom´etrie Mol´eculaire et Atmosph´erique GSMA, Universit´e de Reims, Reims, France, A. Reberac, J.-L. Bertaux, LATMOS, Universit´e Versailles St Quentin, Centre National de la Recherche Scientifique, Guyancourt, France.
Introduction
We will present observations of aerosol profiles derived from MEx/SPICAM solar occultations in the ultravio-let ([1]) compultravio-leted with UV stellar occultations. This dataset allows, as described by [2] for stellar occulta-tions, the retrieval of vertical profiles of the abundance of
gaseous species (CO2, O3), aerosol optical depth in the
UV, and the ˚Angstr¨om coefficient, which can be, through some hypotheses, related to particle size. The first solar occultation results were presented by [3]. Since then, the SPICAM technical team has provided new correc-tions for the data, giving access to previously unused orbits, and new geometry files. A data analysis code, in-cluding a correction for mechanical oscillations induced by the MARSIS radar antennae, has been developed and used in the analysis. We have analysed all solar occulta-tions of adequate quality between orbit numbers 0-10000 (Mars Years 27-30) spanning 4 MY with a good seasonal and spatial coverage. The results reveal the dust haze near the surface, and detached layers (possibly clouds) at high altitudes. We will present a global overview of the results and some specific cases of interest from the several hundreds of occultations analysed, and complete the solar occultation dataset with a comparison to the UV stellar occultations.
The abstract is based on [1] where the solar occulta-tion results have been published.
Dataset
SPICAM (SPectroscopie pour l‘Investigation des Car-act´eristiques Atmosph´eriques de Mars) is observing Mars in the ultraviolet (118–320 nm) and in the near infrared
(1–1.7 µm) ranges. [4] describes the instrument and
the observation techniques in detail. In the occultation mode, the UV channel allows to infer the vertical
dis-tribution of CO2, O3, and aerosols. We are focusing
here on the UV solar occultation dataset of about 650 profiles, and we are also including over 800 UV stellar occultations mainly from MY27-28 (with some observa-tions in MY29-30) to achieve a better overall coverage
in latitude and Ls. We also wish to compare the
re-sults of the two datasets that mainly differ only by the local time of observation acquisition (solar occultations
at the terminator, stellar occultations during the night). The calculated transmission spectra are fitted with the Beer-Lambert law, which takes into account extinction by gaseous species and aerosols. Aerosol extinction is modeled with the so-called alpha-model, providing ac-cess to the ˚Angstr¨om coefficient, which depends on the size of the aerosols. However, we can not determine the composition of the particles through the observa-tions, which can make the size determination dependent on the assumed composition. Inversely, for very large ˚Angstr¨om coefficients only ice composition is possible,
but again there is no way to discriminate between H2O
and CO2ices.
Hazetops
The so-called hazetop (the altitude where the slant
opac-ity drops toτ = 1from the higher near-surface values)
gives information about the vertical extent of the low-lying, well-mixed continuum of aerosols (haze) that pre-vails near the surface of Mars. This haze should be composed of dust outside the polar regions: the polar hoods are formed of fairly low-lying clouds. The source of the dust haze is lifting from the surface and mixing through atmospheric convection. The hazetop can thus give some information on the atmospheric activity and its variations.
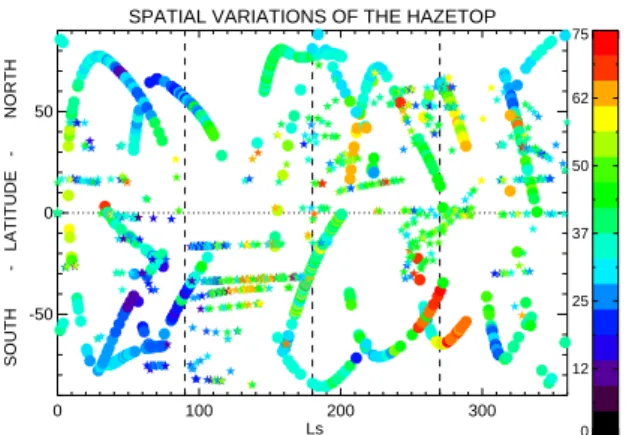
Figure 1 shows the variations of the hazetop as a function of latitude and season. In this figure all the observations are mixed regardless of the year of acquisi-tion. The stellar occultations included in the figure cover a larger (unpublished) dataset than just those analyzed by [2].
In general, higher hazetop values are observed at warmer seasons and regions, i.e., near the equator, and in the southern hemisphere during southern spring and
summer (Ls = 180–360◦). Here convection acts more
ef-ficiently and the general circulation is stronger: aerosols can be lifted to and maintained at higher altitudes. This happens in particular around the perihelion (Ls = 220–
300◦) where dust storms occur more often ([5]).
Sea-sonal temperature changes modulate the cloud formation level as well. Consequently cloud formation regulates the dust haze extent through scavenging of dust particles and sedimentation to the lower atmosphere.
Aerosol vertical distribution from SPICAM UV SPATIAL VARIATIONS OF THE HAZETOP
0 100 200 300
Ls -50
0 50
SOUTH - LATITUDE - NORTH
0 12 25 37 50 62 75
Figure 1: The whole hazetop dataset as a function of latitude and season. The circles and stars represent solar and stellar occultations, respectively. The color scale gives the hazetop altitude.
Detached layers
In almost half (48%) of the analyzed solar occultation profiles, and in more than two thirds (70%) of the stellar occultation profiles, the slant optical depth has a clear lo-cal maximum that we can identify as an aerosol layer (in-cluding multiple layers, 13% of observed layers in solar occultations). These layers are observed at all latitudes and seasons throughout the analysed dataset (Figure 2). In most cases, these maxima are found at high altitudes
Detected detached layers
0 100 200 300
Ls -50
0 50
SOUTH - LATITUDE - NORTH
14 27 41 54 68 81 95
Figure 2: The detached layer dataset as a function of latitude and season. The circles and stars represent solar and stellar occultations, respectively. The color scale gives the detached layer altitude.
above the near-surface haze, but clear layer structures are as well found within the near-surface haze. It should be kept in mind that the slant optical depth includes in-formation from several altitudes along the line of sight. Thus certain effects may be due to the geometry of the observations. For example, a layer observed within the
haze, may be a result of the projection of a layer in the fore or background of the local vertical. Our discussion here concentrates mainly on the more frequent cases of layers above the haze (i.e., high-altitude detached layers). A systematic investigation was performed to detect these clearly-defined atmospheric structures. A detached layer may consist of ice condensates or it might be a dust plume. However, in the occultation mode, we cannot spectrally distinguish between these cases. In contrary to what [2] found, such structures are not lim-ited to mid-southern latitudes in our data.
Seasonal behavior of hazetop and detached layers
Some interesting phenomena were observed when fol-lowing the seasonal evolution of the hazetop and the detached layers. Around the northern autumn equinox in MY27 the hazetop altitudes change nearly simultane-ously, but in the opposite directions. In the north, the haze remains confined below 40 km after the change, whereas in the south the hazetop altitude increases and high-altitude detached layers are observed very frequently. This might be the first indications of the starting dust storm season in the south. The northern occultations scan the polar regions, showing most probably the de-velopment of the polar hood. Here the slant opacities are quite high in the lower atmosphere, and the transition from aerosol-loaded to aerosol-free atmosphere is very sharp.
Observations at the southern spring/summer (Ls =
200–290◦) were acquired during two campaigns, at MY
28 and MY29. They include the global dust storm of MY28, and we also should be seeing the early ("pre-season") dust activity in MY29 pointed out by [6]. We can observe seasonal variations of the hazetop in the southern summer through the southern hemisphere parts
of the campaigns (Ls = 170–270◦) that reveal an increase
in hazetop altitudes in the southern midlatitudes as the local spring advances and the circulation becomes more vigorous on average. There is an abrupt increase in the
hazetop altitude at around Ls = 240◦. This can also
be seen in the detached layers. High-altitude layers are clearly more abundant at this season, with the highest layers of our whole dataset observed during the dust storm.
In the early winter in the southern hemisphere, we have observed a distinct, quite constant, but thin aerosol
layer at around 40 km withτaer<0.1 in about 10
conse-quent profiles (Ls = 43–53◦). This layer is detected only
in occultations made directly south of the Hellas basin
(70–72◦S). This layer stands out from the data since the
majority of the detached layers in this season are found in the northern leg of the campaign, and since the shape of the profile and its altitude are very constant. In all the profiles displaying this persistent layer, the ˚Angstr¨om coefficients in the layers are greater than 2.6, indicating
Aerosol vertical distribution from SPICAM UV that only ice crystals can explain the wavelength
depen-dence of the opacity. The effective radii of the crystals in the layer are very small, of the order of 100 nm or slightly less, and the smallest crystals are found in range of 50nm. We believe this cloud is related to the forming south polar hood.
Interannual variations
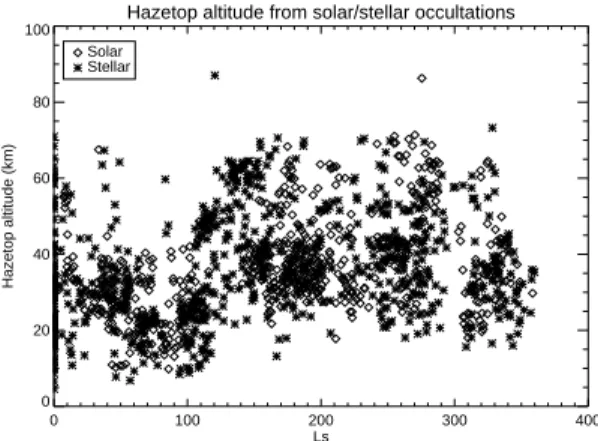
The seasonal variation of hazetop altitude (for all occul-tations regardless of latitude, longitude, or Mars Year) can be seen in Fig. 3. The figure reproduces a similar figure of [2], and includes their data and the additional stellar occultation data analyzed later. Fig. 3 reveals
Hazetop altitude from solar/stellar occultations
0 100 200 300 400 Ls 0 20 40 60 80 100 Hazetop altitude (km) Solar Stellar
Figure 3: The hazetop altitude as a function of season. the seasonality in the hazetop altitude, shown already by [2], but with our more extensive dataset the increase in hazetops during the second half of the year is less clear than in [2]: Here we see much larger variability during the southern spring/summer. The most prominent
fea-ture of the plot is the minimum at around Ls=90
◦. Our
observations include the dust storm of MY28 providing the large hazetop altitude variations and large hazetop values in the southern summer. Compared to stellar oc-cultations, the solar occultations span a wider range of latitudes during a given season, inducing more scatter
for a given Ls.
We can now discuss further the inter-annual vari-ability with the help of Figure 1. Two solar occultation observation campaigns were acquired in the southern
hemisphere near 65◦S during the same season (Ls =
34–110◦), but they account respectively for MY27 and
MY29. They display similar average hazetop values in this region and season. Alrso the MY27 stellar occul-tations show similar values. It seems that the hazetop follows a quite undisturbed seasonal cycle at this pe-riod at mid-to-high southern latitudes since we discover almost the same hazetop altitude two MY apart, and with a global dust storm in between. For these same
solar occultation campaigns, the mean layer altitude of the detached layers in the southern hemisphere shows a very small 4 km difference. However, the layers in MY29 are almost twice as thick (in vertical extent, 11 km) as those of MY27 (6 km), and show higher opaci-ties with respect to the background. This might be the effect of the global dust storm of MY28. The storm has charged the atmosphere full of condensation nuclei, which have had a long-term effect on the microphysical properties of clouds without changing their formation altitude.
The most significant source of inter-annual variabil-ity in the solar occultation data is the global dust storm of MY28. We have observations on two campaigns for the southern spring/summer season. If we investigate sepa-rately MY28 and MY27, we can mention that the mean hazetop altitude observed only slightly later in season in MY27 is 23 km lower in the southern and 14 km lower in the northern hemisphere than during the dust storm of MY28. This reveals the remarkable vertical extent of the dust advected by the storm. Also the detached layer average altitudes of MY27 are clearly lower (59– 61 km), compared to MY28 (77–81 km). Occultations can not be used to define the composition of these layers, but probably the atmosphere is heated strongly by the suspended dust causing the condensation level of water (and consequently the cloud formation level) to be found at higher altitudes.
˚Angstr¨om coefficients
The alpha-model used to fit the wavelength dependence of the aerosol extinction gives access to the particle size. However, several assumptions are required before the conversion can be made, and thus unambiguous con-clusions are difficult to draw. Thus, we have mainly investigated the vertical variation of the coefficient. We have looked for vertical trends of the coefficient and the particle effective radii in correlation with the opacity profiles in the solar occultation data. It might be ex-pected that in the dust haze the particle radii decrease (˚Angstr¨om coefficient increases) with increasing alti-tude simultaneously with a similar trend in opacity. In addition, if the detached layers are ice clouds, one might expect the radii to be larger (smaller ˚Angstr¨om coeffi-cients) than in the surroundings, since the ice crystals form on dust particles. Contrary to the conclusions of [2], in the solar occultation data, we have not always seen this "expected" behavior of increasing coefficient (decreasing particle size) with increasing altitude, nor do we have a systematic decrease (increase in particle size) within the detached layers. Thus it is very difficult to draw conclusions on the behavior of the effective radii in the haze and on the composition of the detached lay-ers. In one exceptional case of the detached layer near Hellas mentioned above, the particles were identified as
REFERENCES ice crystals thanks to their large ˚Angstr¨om coefficients.
Conclusion
The four Martian years of data of SPICAM occultations show that the seasonal behavior of the hazetop follows closely the seasonal variations of the temperature. The highest hazetops are observed at the warm season around the southern summer solstice. Observations during the MY28 dust storm reveal very high hazetops and detached layers. The high northern latitudes in the autumn give the opposite example of very calm vertical distribution with a low hazetop. These data show that the assumption of a well-mixed dust in the lowest atmosphere is not the only option, but that the martian dust vertical distribution is very variable. We observed detached layers in more than half of the analyzed orbits (accounting for both solar and stellar occultations). The highest detached layers are observed during the global dust storm of MY28, but evident single and multiple layers are observed also during other seasons.
The solar occultation dataset can be accessed through the Supplementary Material of the article [1] and the Europlanet IDIS atmospheres node that can be found at http://www.bdap.ipsl.fr/idis/.
References
[1] M¨a¨att¨anen, A., Listowski, C., Montmessin, F., Mal-tagliati, L., Reberac, A., Joly, L., Bertaux, J.-L., Apr. 2013. A complete climatology of the aerosol
vertical distribution on Mars from MEx/SPICAM UV solar occultations. Icarus 223, 892–941. [2] Montmessin, F., Qu´emerais, E., Bertaux, J.-L.,
Ko-rablev, O., Rannou, P., Lebonnois, S., 2006. Stel-lar occultations at UV wavelengths by the SPI-CAM instrument: Retrieval and analysis of Mar-tian haze profiles. J. Geophys. Res. 111, E09S09, doi:10.1029/2005JE002662.
[3] Listowski, C., M¨a¨att¨anen, A., Montmessin, F., Lef`evre, F., Bertaux, J.-L., Feb. 2011. Solar Oc-cultation with SPICAM/UV onboard Mars Express: Retrieving Aerosol and Ozone Profiles. In: Forget, F., Millour, E. (Eds.), Mars Atmosphere: Modelling and observation. pp. 191–194.
[4] Bertaux, J., Korablev, O., Perrier, S., Qu´emerais, E., Montmessin, F., Leblanc, F., Lebonnois, S., Rannou, P., Lef`evre, F., Forget, F., Fedorova, A., Dimarel-lis, E., Reberac, A., Fonteyn, D., Chaufray, J. Y., Guibert, S., Oct. 2006. SPICAM on Mars Express: Observing modes and overview of UV spectrometer data and scientific results. Journal of Geophysical Research (Planets) 111 (E10), 10–+.
[5] Smith, M. D., 2004. Interannual variability
in TES atmospheric observations in Mars
during 1999–2003. Icarus 167, 148–165,
doi:10.1016/j.icarus.2003.09.010.
[6] Smith, M. D., Aug. 2009. THEMIS observations of Mars aerosol optical depth from 2002-2008. Icarus 202, 444–452.