DESIGN OF A WATERSHED-BASED NITROGEN TRADING SYSTEM FOR THE BIG AND LITTLE WOOD RIVERS WATERSHED
by
Kristina Elizabeth Lopez-Bernal
Bachelor of Science in Environmental Engineering Science June 2002
Massachusetts Institute of Technology Cambridge, MA
SUBMITTED TO THE DEPARTMENT OF CIVIL AND ENVIRONMENTAL ENGINEERING IN PARTIAL FULFILLMENT OF THE REQUIREMENTS FOR THE DEGREE OF MASTER OF ENGINEERING IN CIVIL AND ENVIRONMENTAL ENGINEERING
AT THE
MASSACHUSETTS INSTITUTE OF TECHNOLOGY
JUNE 2003
Copyright @ Massachusetts Institute of Technology.
All rights reserved.
Signature of Author:
I ~ Department oY9i'l an\Envikmmental Engineering
May 09, 2003
()IA
Certified by:
David Marks Professor, Engineering Systems and Civil and Environmental Engineering Director, Laboratory for Energy and the Environment
Thesis Supervisor
Accepted by:
Acpe bOral Buyukozturk
Chairman, Departmental Committee on Graduate Studies
MASSACHUSETTS INSTITUTE OF TECHNOLOGY
JUN 0 2 2003
DESIGN OF A WATERSHED-BASED NITROGEN TRADING SYSTEM FOR THE BIG AND LITTLE WOOD RIVERS WATERSHED
by
Kristina Elizabeth Lopez-Bernal
Submitted to the Department of Civil and Environmental Engineering on May 09, 2003 In Partial Fulfillment of the Requirements for the Degree of
Master of Engineering in Civil and Environmental Engineering ABSTRACT
A watershed-based nitrogen trading system was designed for the Big and Little Wood Rivers Watershed in south-central Idaho as a policy tool to help manage increasing nitrogen loads within the Watershed. The study was performed on behalf of the Blaine County Commissioners in response to concerns regarding increasing population growth and nitrogen loading in the Watershed. A trading framework was developed based on case studies and existing trading frameworks. The developed framework included selection of a trading arrangement,
development of a trading cap, design of a credit distribution system, establishment of a trading ratio, and qualification of transaction costs. Potential problems with trading, including
administration of the trading program, pre-quantification of transaction costs, uncertainty in data collection and source monitoring, spatial and temporal distribution of pollutants, and
enforcement of the trading program, are discussed. A water balance was completed in order to understand the hydrologic conditions of the Watershed. Water inflow for the Watershed
included 2.24 kg3/yr of precipitation. Water outflows for the Watershed included 1.87 kg3/yr of evapotranspiration and 0.33 kg3/yr of surface water outflow. A point source/non-point source
trading arrangement was set for the Watershed based on the currently high proportion of non-point nitrogen sources (e.g. agricultural lands and rangeland) and the future potential for
increases in the proportion of nitrogen from point sources (e.g. wastewater treatment plants). A yearly nitrogen cap in the range of 569,300 kg/yr and 720,500 kg/yr was suggested for the Watershed. This range was based on estimates for actual nitrogen stream flow concentration and loading within the Watershed and acceptable nitrogen concentration values from EPA Ecosystem classification data, trophic states, and published data. Trading credits would be distributed to point sources in proportion to their current acceptable discharge levels and to non-point sources in proportion to the amount of land used for agriculture or ranging. The trading ratio set between point and non-point sources varied continuously between 1:1 and 1:2.6 depending on the
distance of the non-point source from the river. Thesis Supervisor: David Marks
Title: Professor, Engineering Systems and Civil and Environmental Engineering Director, Laboratory for Energy and the Environment
Acknowledgements
First and foremost, I would like to thank the Lady, the Sir, and the Kid. I never could have done this without you. I love you guys.
Thank you and love to Alex, for keeping me happy and laughing and for helping me get the MIT monkey off my back.
My gratitude goes out to all of those who provided guidance for my research, especially Dr. David Marks, Dr. Wendy Pabich, and Dr. Peter Shanahan. Thanks also to Sarah Michael, who
made this project possible and welcomed us to her lovely home in Idaho. Finally, I would like to send special thanks to Julianna Connolly and Devin Shaffer, who helped me greatly in my
research, provided great entertainment in Idaho, and taught me how to knit and ski. I would also like to thank the Blaine County community for welcoming our group to their
wonderful town. Particular thanks go out to the following: The Community Library, Ketchum, Idaho
Dr. Lee Brown, Water Resources Consulting Ken Skinner, United States Geologic Survey Ray Hyde, Hailey Public Works Manager Ann, Hailey Public Works
Dave Swindle, Ketchum/Sun Valley Wastewater Superintendent Bob Erickson, Idaho South Central District Health
Linda Haavik, Blaine County Planning and Zoning Dave Odum, Blaine County Planning and Zoning Maryanne Mix, Blaine County Commissioner Dennis Wright, Blaine County Commissioner Rick Turner, Bellevue Wastewater Treatment Plant Amy Williams, Boise State University
Larry Schoen Nick Purdy Robert Gardner
Jo and Bill Lowe, Wood River Valley Watershed Advisory Group The Stanley Family
Jim and Wendy Jacquith Bob Jonas, The Wild Gift Nina Jonas
Table of Contents
L ist o f F ig u res... 5
L ist o f T ab les ... 6
1 In tro d u ctio n ... 7
1.1 Background Information on the Big and Little W ood Rivers W atershed... 7
1.2 Overview of W ater Quality Management in the United States and Idaho... 13
1.3 Nitrogen Enrichment Problems in Rivers and Streams ... 15
1.4 W atershed W ater Quality History and Current Conditions ... 19
1.5 S co p e ... 19
2 Overview of W atershed-Based Pollution Trading ... 21
2.1 Federal Support for Trading Programs ... 22
2.2 Pollution Trading Components... 23
2.2.1 Trading Arrangements... 23
2.2.2 Nutrient Discharge Cap ... 24
2.2.3 Initial Distribution of Trading Credits... 24
2 .2 .4 T rading R atios ... 25
2.3 Issues with Trading Programs... 26
2.3.1 Administration of Program... 26
2.3.2 Pre-Quantification of Transaction Costs ... 26
2.3.3 Uncertainty in Data Collection and Source Monitoring ... 27
2.3.4 Spatial and Temporal Distribution of Pollutants ... 28
2.3.5 Enforcement of Program ... 28
2.4 Trading Program Case Studies... 29
2.4.1 Chesapeake Bay W atershed Nutrient Trading Program, Multi-State... 29
2.4.2 Long Island Sound Trading Program, Connecticut... 30
2.4.3 Fox-W olf Basin W atershed Pilot Trading Program, Wisconsin ... 31
2.4.4 Kalamazoo River Water Quality Trading Demonstration Project, Michigan ... 32
2.4.5 Lower Boise River Effluent Trading Demonstration Project, Idaho... 33
2.4.6 Town of Acton Municipal Treatment Plant, Massachusetts... 33
2.4.7 Tar-Pamlico Nutrient Reduction Trading Program, North Carolina... 34
2.4.8 Lake Dillon Trading Program, Colorado... 35
2.4.9 Cherry Creek Basin Trading Program, Colorado ... 35
3 Big and Little W ood Rivers W atershed Case Study ... 37
3.1 Trading Arrangements ... 37
3.2 Nutrient Discharge Cap... 39
3 .2 .1 W ater B alance ... 39
3.2.2 Nitrogen Discharge Cap Analysis ... 46
3.3 Initial Distribution of Trading Credits ... 57
3 .4 T radin g R atio s... 57
3 .5 T ran saction C o sts... 62
4 Recommendations and Conclusions... 64
4.1 Recommendations for Future Study ... 64
4.1.1 Development of Extensive Monitoring Plan ... 64
4.1.2 Economic Analysis of Trading Plan... 66
4.2 Recommendations for Watershed-Based Trading in the Big and Little Wood Rivers
W atershed R eg ion ... 6 6
List of Figures
Figure 1-1. Big and Little Wood Rivers Watershed...7
Figure 1-2. Counties within the Watershed...8
Figure 1-3. Cities within the Watershed...8
Figure 1-4. Land use estimates in the Watershed (Connolly et al. 2003) ... 9
Figure 1-5. Population growth in counties within the Watershed... 10
Figure 1-6. USGS SPARROW Model nitrogen source allocation within the Watershed (Smith et al. 19 9 7 )...1 1 Figure 1-7. Nitrogen source allocation by land use within the Watershed (Connolly et al. 2003)12 Figure 1-8. Estimated nitrogen loads in year 2025 given residential lot sizes (Connolly et al. 2 0 0 3 )... 13
Figure 1-9. The nitrogen cycle (Miller 1994) ... 15
Figure 1-10. Snake River Plain aquifer (USGS 1994)... 16
Figure 1-11. Eutrophication (EPA 2002b)... 17
Figure 3-1. The water cycle (TERI 2003)...40
Figure 3-2. Location of USGS Malad River Gaging Station near Gooding ... 45
Figure 3-3. Upper Valley and Watershed boundaries ... 47
Figure 3-4. Relationship between nitrogen concentration and nitrogen yield within the Watershed ... 4 8 Figure 3-5. Map of Ecoregions (EPA 2000a) ... 50
Figure 3-6. Map of Ecoregion III with Subecoregions (EPA 2000b) ... 51
Figure 3-7. Travel times within the Watershed (Connolly et al. 2003)...58
Figure 3-8. Relationship between travel time and percent denitrification within the Watershed. 59 Figure 3-9. Land distances to rivers for the Watershed ... 60
Figure 3-10. Relationship between distance to river and travel time within the Watershed...61
List of Tables
Table 1-1. Nitrogen loads by land use within the Watershed (Connolly et al. 2003)... 11
Table 3-1. Watershed nitrogen load reductions from implementation of BMP nitrogen fertilization rates (Connolly et al. 2003) ... 38
Table 3-2. Watershed nitrogen load reductions from the implementation of precision agriculture techniques (Connolly et al. 2003)... 38
Table 3-3. W ater budget for the W atershed ... 40
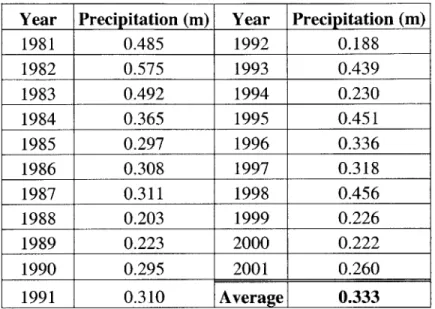
Table 3-4. Yearly precipitation at Craters of the Moon National Park NADP monitoring station (N A D P 20 0 2 ) ... 4 1 Table 3-5. Average monthly reference evapotransporation rates (*Allen et al. 1983)...42
Table 3-6. Monthly specific crop evapotranspiration (*FAO 1998, ** Wetzstein et al. 2000, ***U S G S 200 3) ... 4 3 Table 3-7. Average yearly surface water outflow (*SWAT 2002)...44
Table 3-8. Average yearly runoff by land use (*Connolly et al. 2003, ** Parson 1999) ... 46
Table 3-9. Nitrogen concentrations and yields for the Upper Valley and the Watershed (Connolly et al. 2 0 0 3 )...4 7 Table 3-10. Reference conditions for Aggregate Ecoregion III Streams (EPA 2000b)...52
Table 3-11. Reference conditions for Level II Ecoregion 12 Streams (EPA 2000b)...52
Table 3-12. Suggested boundaries for trophic classification of steams (EPA 2000a)...53
Table 3-13. General trophic classification of lakes and reservoirs in relation to nitrogen (Wetzel 19 8 3 )...5 4 Table 3-14. General relationship in lake productivity to average concentration of eplimnetic nitrogen (W etzel 1983)... 54
Table 3-15. Nutrient and algal biomass criteria limits recommended to prevent nuisance conditions and water quality degradation in streams (EPA 2000a) ... 55
Table 3-16. Summary of acceptable nitrogen concentrations, yields, and loads ... 56
Table 3-17. Nitrogen losses for specific crops within the Watershed...59
1 Introduction
1.1 Background Information on the Big and Little Wood Rivers Watershed
The Big and Little Wood Rivers Valley Watershed (the Watershed) is composed of the land area that drains into the Big Wood and Little Wood Rivers. The Watershed is located in south-central Idaho (Figure 1-1), and is defined by the United States Geological Survey (USGS) Hydrologic Unit Code (HUC) boundaries 17040219 and 17040221. The Watershed covers a land area of
1.65 million acres in south-central Idaho that falls within the boundaries of five counties. The
majority of the Watershed resides within Blaine County, though the Watershed does extend into the neighboring Camas, Gooding, Lincoln, and Jerome Counties (Figure 1-2). There are 16 towns and cities within the Watershed boundaries (Figure 1-3).
Watershed Boundary
LII Blaine County
Camas County B Gooding County
Jerome County
Lincoln County
Figure 1-2. Counties within the Watershed
G na
Ketch Oun Vallev Gimlet T ph Gimlete ul oon,~1 Haile * ( Bellevue 1Iagic Q G c cld in g LttU
The major land uses within the Watershed are forestlands, agricultural lands, rangelands, and urban and suburban uses including residential and commercial development (Figure 1-4). Within the Watershed, agricultural lands, forestlands, and rangelands are being converted into residential areas, as the population of the Watershed grows (IDEQ 2002).
BEANS Land Use Catagories cropland and pasture | feed lots
natural vegetation rangelend
residential areas
ponds and reservoirs
impervious surfaces
Figure 1-4. Land use estimates in the Watershed (Connolly et al. 2003)
The Watershed has undergone substantial population growth in recent decades. Blaine County's population has grown from 4,596 in 1960 to 18,991 in 2000 (Figure 1-5). Year 2000 populations in the neighboring counties are 991 in Camas, 14,155 in Gooding, and 4,044 in Lincoln. The percentage change in population from 1990 to 2000 for Blaine, Camas, Gooding, and Lincoln Counties were 40.1%, 36.3%, 21.7%, and 22.2%, respectively.
20000-18000"
"" Blaine County Population 16000_
p 14000 - Camas County Population
0
012000-- --- Gooding County Population
1000,
S0 0 0 0 - - - - Jerome County Population
8000--- Lincoln County Population _ 6000 -4000 - - 'Estimated Watershed Population 200 0-1960 1970 1980 1990 2000
Figure 1-5. Population growth in counties within the Watershed
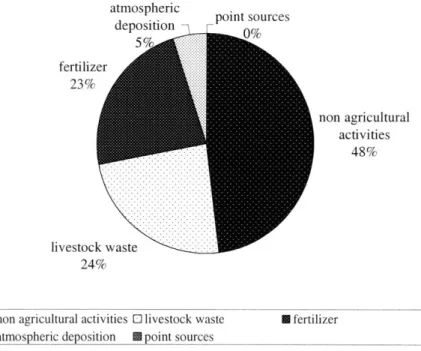
The USGS used the Spatially Referenced Regressions On Watershed Attributes (SPARROW) Model to estimate nitrogen loads from various land uses within the Watershed. SPARROW identifies non-agricultural sources as the largest nitrogen contributor at 48% of the total nitrogen load. SPARROW estimates livestock waste at 24%, fertilizer at 23%, atmospheric deposition at 5%, and point sources at less than 1% of the total nitrogen load (Figure 1-6) (Smith et al. 1997).
atmospheric point sources deposition 5% fertilizer 23% ... ... ......... ... ... ...... ...... . .... ... ... .... ... ... ... ..........I ... ... . ... .......
...
...
...
...
...
livestock waste 24% non agricultural activities 48%* non agricultural activities 0 livestock waste E fertilizer El atmospheric deposition E point sources
Figure 1-6. USGS SPARROW Model nitrogen source allocation within the Watershed (Smith et al. 1997)
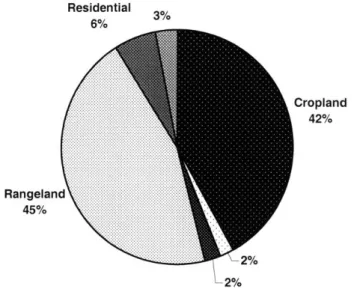
A study by Connolly et al. estimated the current total load of nitrogen within the Watershed as about 664,500 kg/yr (Table 1-1). The study determined that the highest proportion of this load derives from inputs to cropland and rangeland (Figure 1-7) (Connolly et al. 2003).
Table 1-1. Nitrogen loads
Land Use Nitrogen Load (kg N/yr)
Rangeland 302,200
Cropland and Pasture 276,900
Residential 37,100 Feed Lots 12,900 Impervious Surfaces 18,400 Natural Vegetation 16,500 Water 500 Total 664,500
Residential 3% 6% Cropland .. ... ... 42% ... ... ...... ... ... ... ...... ...... ... ... ... I ... ... ... ... .... ... . ......... ............... ...... ....................I .. ... ......... .. .. .... ....... ... ... ... ...... .. . ...... ... ......... ... .... ...... ... ... ... ..... ... ... ...... .. .... ... ... .. .. .. .. .. .. ... ... ... .. .... ... ... ..... .... ... ... ... ... ...... Rangeland ':'*'..'..""'.."'.."'.."..."""""',..*""".."".."".."""""'..""..",*,.,................. ...-... ... .1- ...... ... ... 4 5 % ..... ............... .. .. ... .... .... ... ... .... .. ... ..... .. .... .... ... .... ... .I ... ............ ......... ....... ... .... ... .... .... ...... . ... ............ ....... ... ..I ... .... ... ..... ... .................. .. ........ ...I ..... I I ... ... .... ... ... ........... 2% 2%
0 Cropland 0 Feed Lots N Natural Vegetation 0 Rangeland 0 Residential 0 Impervious Surfaces
Figure 1-7. Nitrogen source allocation by land use within the Watershed (Connolly et al. 2003)
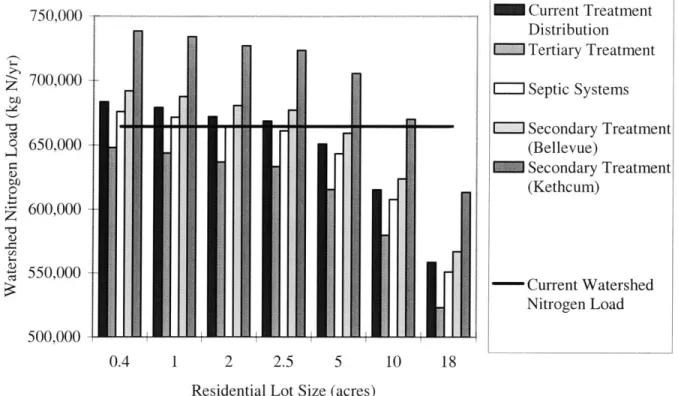
Connolly et al. also estimated that the population of the Watershed would grow by about 40,000 residents by the year 2025. This study estimates land use patterns will evolve to fit this
population growth by altering agricultural lands to residential lands (Connolly et al. 2003). While this prediction is dependent on residential lot size and level of wastewater treatment, it is possible that total nitrogen load will increase and clear that residential sources will become an increasingly larger proportion of total nitrogen load (Figure 1-8).
750,000 - Current Treatment Distribution Tertiary Treatment S700,000 EZSeptic Systems Secondary Treatment 650,000 -(Bellevue) M Secondary Treatment (Kethcum) 600,000 550,000 - Current Watershed Nitrogen Load 500,000 4 0.4 1 2 2.5 5 10 18
Residential Lot Size (acres)
Figure 1-8. Estimated nitrogen loads in year 2025 given residential lot sizes (Connolly et al. 2003)
1.2 Overview of Water Quality Management in the United States and Idaho
Under the Clean Water Act (CWA), enacted in 1972, states and tribes must "restore and maintain the chemical, physical, and biological integrity" of national waters (IDEQ 2002). The federal government "established financial assistance for the construction of publicly owned waste treatment facilities, requirements for area-wide waste treatment management planning and major research and demonstration efforts to develop pollution control technology" (EPA 2002a). Under CWA §303, states and tribes must adopt water quality standards that are protective of fish, shellfish, and wildlife and provide human recreation in and around waters when possible.
Section 303(d) of the CWA requires states to provide a prioritized list of impaired water bodies every two years.
Under CWA §303, states are required to set total maximum daily load (TMDL) requirements for
waters where national "effluent limitations ... are not stringent enough to implement any water
the total amount of the pollutant that may be discharged to the water body ... without violating the water quality standard for that pollutant" (Ashford et al. 2002). Under the TMDL process,
states and territories identify impaired water bodies and compile lists of these water bodies. States then establish TMDL requirements for water bodies on the list, specifying the reductions needed to meet water quality standards. States allocate these reductions among the sources in the watershed.
The CWA National Pollutant Discharge Elimination System (NPDES) permitting program has made great strides in controlling point source' discharges into the nation's waters. The United States Environmental Protection Agency (EPA) notes that by 1990 "over 87% of the major municipal facilities and 93% of major industrial facilities were in compliance with NPDES permit limits" (EPA 2002a). Additionally, annual point source control costs amount to about $14 billion for private firms and $34 billion for public facilities (EPA 2002a). Nonetheless, non-point sources2 remain highly unregulated and "almost 40% of currently assessed rivers, streams, and lakes still do not support their designated uses" (EPA 2002a).
Congress passed the Safe Drinking Water Act (SDWA) in 1974 in order to protect public health by regulating drinking water sources, including rivers, streams, lakes, springs, reservoirs, and groundwater wells. The SDWA sets health-based drinking water standards for various man-made and naturally occurring contaminants, including various forms of nitrogen. The current standards for nitrate and nitrite are ten mg/L and 45 mg/L, respectively.
The State of Idaho has not set numeric water quality criteria for nutrients. Instead, it has a narrative standard which suggests that "if the designated and existing beneficial uses are not
I Point sources are defined by the EPA as "any discernable, confined and discrete conveyance, including but not limited to any pipe, ditch, channel, tunnel, conduit, well, discrete fissure, container, rolling stock, concentrated animal feeding operation, or vessel or other floating craft, from which pollutants are or may be discharged. This term does not include agricultural stormwater discharges and return flows from irrigated agriculture" (EPA 2003a)
2 Non-point sources are diffuse sources, largely caused by rainfall and snowfall runoff. As defined by the EPA,
non-point sources include: excess fertilizers, herbicides, and insecticides from agricultural lands and residential areas; oil, grease, and toxic chemicals from urban runoff and energy production; sediment from improperly managed construction sites, crop and forest lands, and eroding streambanks; salt from irrigation practices and acid drainage from abandoned mines; bacteria and nutrients from livestock, pet wastes, and faulty septic systems; atmospheric deposition; and hydromodification (EPA 2003b).
impaired by the effects of excessive nutrients in the water body, nutrients are not exceeding the narrative water quality standard" (LBRWQP 2002).
1.3 Nitrogen Enrichment Problems in Rivers and Streams
Nitrogen is an essential element that is naturally fixed (usually by nitrogen-fixing bacteria or lightning) and used by organisms in the form of ammonium (NH4) and nitrate (NO3). However,
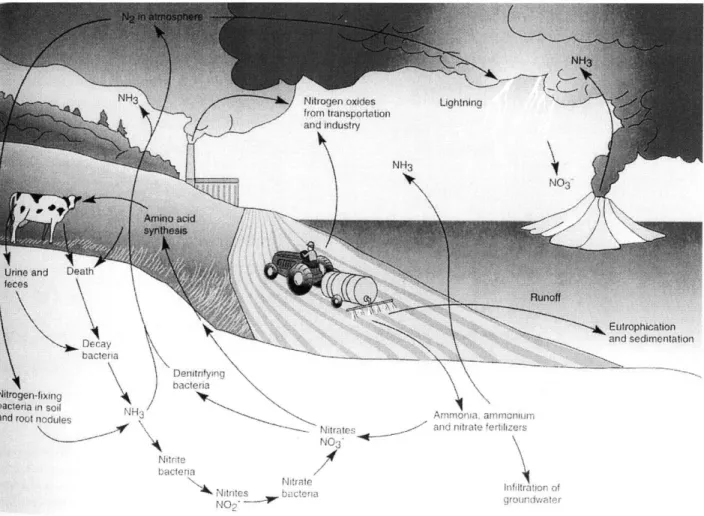
during the past century, humans have increased the rate of nitrogen fixation, thus increasing the amount of available nitrogen. Human-induced nitrogen fixing processes include production of nitrogen fertilizer, increases in nitrogen-fixing crops (including soybeans, alfalfa, and legumes), and combustion of fossil fuels (Vitousek et al. 1997). Figure 1-9 provides a diagram of the nitrogen cycle.
Denitriying
ba~cteria
Arnrnonoa.. arnrnanhon
Niti. Arnd nitrate fe rtifizers
Niraeta
'Tteri
Figure 1-9. The nitrogen cycle (Miller 1994)
Due to human disturbances of the nitrogen cycle, nitrogen, and particularly nitrate, enrichment has become a major cause of water quality impairment. Impairment of a water body occurs when the water quality of a body does not meet its CWA designated use criteria. This impairment may have adverse ecological, aesthetic, human health, and economic effects.
Nitrogen affects the productivity and well being of water sources and the wildlife that lives in them. Wetzel notes, "a positive correlation has been found between high sustained productivity of algal populations and average concentrations of inorganic and organic nitrogen" (Wetzel 1983). Moreover, while phosphorus may often be the limiting nutrient in fresh water systems (including lakes, rivers, and streams), nitrogen is the limiting nutrient in marine systems. The Big Wood River is a tributary of the Snake River, which flows into the Columbia River and eventually empties into the Pacific Ocean off the coast of Washington state (Figure 1-10). Therefore, elevated nitrogen levels in the Big and Little Wood Rivers may have negative effects on a regional level. EXPLAN4ATION~ IN Sac i PA ew. tM tr ye VA., ~ / ( ~L ~ -v~ *} w~ P ~ QJ.
Eutrophy, a physical state that occurs in nutrient rich water bodies, can have devastating effects to aquatic habitats (Figure 1-11). Eutrophication causes the occurrence of harmful algal blooms, which can lead to decreased water clarity and reduce habitat availability for aquatic life, as algae form mats on the top of the water body and decrease the amount of dissolved oxygen available. Moreover, several species of algae may produce toxins, which can cause harm or death to marine species and illness and death to humans who come in contact with the toxins or ingest fish or shellfish with elevated levels of toxins.
I
Figure 1-11. Eutrophication (EPA 2002b)
At extreme levels, eutrophication can lead to hypoxia, or an inadequacy in oxygen. In the state of hypoxia, dissolved oxygen concentrations in the river or stream become very low as the overgrowth of algae depletes the availability of dissolved oxygen. Therefore, organisms that can tolerate low dissolved oxygen concentrations tend to dominate the habitat (Wetzel 1983).
Hypoxia leads to the death of fish and other wildlife that require oxygen to survive, and may lead to virtually no biological activity. This has occurred in the Gulf of Mexico at the outlet of the
Mississippi River, where nitrate levels have more than doubled since 1965 (Vitousek et al. 1997).
Eutrophication can also lead to degradation of the aesthetic qualities of the water body and interference with water body recreational uses. There may be significant economic impacts to recreational and commercial fisheries at the local level or downstream of the water body as the frequency of fish kills increases.
Dietary nitrogen sources have an important role in human health. Wolfe et al. note that a human in good health should intake about two kg/yr of biologically available nitrogen. Low nitrogen intake may lead to growth retardation, wasting of muscle, accumulation of fat in the liver,
edema, changes to skin pigmentation, changes to hair texture and color, altered mental status and capacity, lethargy, fatigue, anemia, and susceptibility to infectious disease (Wolfe et al. 2002).
While nitrogen is necessary for life, intake of too much nitrogen may cause various adverse human health effects. Methemoglobinemia, or "blue baby syndrome," occurs when nitrogen preferentially binds to hemoglobin, thereby lowering the amount of oxygen in the blood system. The syndrome can be fatal in infants under the age of six months. The EPA drinking water
standards for nitrate and nitrite are set to prevent this from occurring in infants (Wolfe et al. 2002).
When eutrophication occurs, Pfiesteria piscicida, an estuarine dinoflagellate alga, may be present. When humans are exposed to this organism, it may cause various negative health effects including memory loss, headache, skin rash, eye irritation, upper respiratory irritation, muscle cramps, and gastrointestinal upset (Wolfe et al. 2002).
Wolfe et al. also cite various studies that link nitrate to bladder, ovarian, stomach, and liver cancers and studies that possibly link nitrate to genotoxic and cytogenic effects (Wolfe et al. 2002). Nitrate concentrations of four mg/L and higher have also been linked to an increased risk of non-Hodgkins lymphoma (EPA 2000a).
Finally, elevated nitrogen levels may impose high costs to drinking water treatment facilities, as elevated nutrient levels have been shown to cause corrosion of water intake valves and algae has been shown to cause filters in the treatment plants to clog (EPA 2000a).
1.4 Watershed Water Quality History and Current Conditions
The Idaho Department of Environmental Quality (IDEQ), the Idaho State Department of
Agriculture (ISDA), and the Idaho Department of Water Resources (IDWR) all identify nitrate as the "most widespread preventable groundwater contaminant in Idaho." While only three percent of sites sampled in the Statewide Ambient Ground Water Quality Monitoring Program tested higher than the nitrate MCL of 10 mg/L, 30 percent of sites tested between two mg/L and 10 mg/L. Moreover, the nitrate contamination problem is becoming increasingly severe with most sites showing increases in nitrate over an eight-year period of sampling (IDEQ 2001).
The State of Idaho has listed various sections of the Big and Little Wood Rivers as EPA CWA §303(d) impaired water bodies due to nutrients (nitrogen and phosphorus), bacteria, dissolved oxygen, flow alterations, and sediments. The IDEQ has developed TMDL requirements for the Big Wood River, for E. coli, total suspended solids (TSS), substrate sediments, and total
phosphorus (TP). Additionally, TMDL requirements for temperature and dissolved oxygen will be set in 2003. The IDEQ has not set TMDL requirements for nitrogen for the Big Wood River because "the concentrations of NOx in the streams [are] not considered toxic to fisheries, nor is there evidence that nuisance aquatic plant growths, algae, slimes, or molds are present to affect beneficial uses" of the streams in the Watershed. However, the IDEQ also notes that nitrogen TMDL requirements may "be seriously considered for development" in the future (IDEQ 2002). The IDEQ has not completed the Little Wood River Watershed Management Plan that would set TMDL requirements for the Little Wood River.
1.5 Scope
Currently, the Big and Little Wood Rivers are not listed for nitrogen impairment. However, future residential developmental pressures and associated increasing nitrogen loads may threaten the Watershed. Excess nitrogen may lead to eutrophication and its harmful effects in the Big and Little Wood Rivers. This study will identify the advantages and disadvantages of employing a market-based nitrogen management system and develop a watershed-based nitrogen trading
system for the Watershed. Residents of the Watershed will be able to use the research completed in this document as a policy tool to ensure that nitrogen does not damage their Watershed.
2 Overview of Watershed-Based Pollution Trading
Nutrient trading is a market-based policy approach used in conjunction with a regulatory
framework to protect or enhance water quality. There are three basic steps to devising a nitrogen trading plan. The first step is to set a limit, or cap, on the total amount of nitrogen entering the watershed allowable for a given period of time. This concept is similar to that of setting TMDL requirements for a body of water, and often the limit is set equivalent to TMDL values. The second step is to allocate weighted nitrogen credits to each nitrogen source within the Watershed. The final step is to allow sources within the watershed to trade so that each source manages its nitrogen outputs in a cost effective manner such that a watershed is meeting water quality goals (WRI 2000).
A closed trading program, "[o]ften called 'cap and trade,' ... include[s] a mandatory 'cap' on ...
discharges and individual allowances to sources within a defined trading area (WRI 2000). Once a cap on discharge has been placed and pollution credits have been allocated to sources, "sources with low cost pollution reduction options have an incentive to reduce nutrient loading beyond what is required of them and to sell the excess credits to sources with higher costs" (WRI 2002). Therefore, nutrient trading is cost-effective in the sense that environmental benefits are realized at a low cost
The EPA estimates that "flexible approaches to improving water quality could save $900 million dollars annually compared to the least flexible approach" (EPA 2002a). The EPA notes various economic benefits to trading over a traditional regulatory approach. Trading "reduces costs for individual sources contributing to water quality problems." It also allows for sources to "take advantage of economies of scale and treatment efficiencies that vary from source to source." These two components allow the total cost of improving water quality to dischargers within a watershed to decrease. Moreover, some trading program analyses show that "pushing on point sources alone [is] ... a relatively expensive approach when other sources contribute more to the problem" (WRI 2000). Therefore, including non-point sources in a trading program may further increase the cost-effectiveness of a trading program.
If implemented appropriately, a nutrient trading system is a flexible and cost-effective way to address water quality problems and encourage dialogue among relevant stakeholders and the public. Specifically, watershed-based nutrient trading can be an innovative way to encourage reductions of non-point sources, which are otherwise not covered under the CWA. However, it is important to note that the trading plan is not a substitute for a regulatory framework and will only work if non-point source nutrient concentrations can be quantified and monitored.
Additionally, participation in trading is voluntary and must be approved by the trading regulatory agency.
2.1 Federal Support for Trading Programs
The EPA "actively support[s] and promote[s] nutrient trading within watersheds to achieve water quality objectives, including water quality standards to the extent authorized by the [CWA] and implementing regulations" and has developed a "Draft Framework for Watershed-Based
Trading" in order to carry out these goals (EPA 2002c). Federally acceptable trading programs that are consistent with the CWA and other federal regulations must include "requirements to obtain permits ([CWA] §402 and 404), antibacksliding provisions ([CWA] §303(d)(4) and §402(o)), the development of water quality standards and antidegradation policy ([CWA] §303), federal NPDES permit regulations (40 CFR Parts 122, 123 and 124) and water quality
management plans (40 CFR Part 130)" (EPA 2002a).
The EPA identifies that the policy is "intended to encourage the adoption of trading programs that facilitate implementation of TMDLs, reduce the costs of compliance with CWA regulations, establish incentives for voluntary reductions and promote watershed-based initiatives that result in greater water quality and environmental benefits than would otherwise be achieved under the CWA." Indeed, the EPA suggests that trading boundaries should coincide with watershed boundaries because "matching geographic trading areas with appropriate hydrologic units helps ensure that trades meet and maintain water quality standards throughout a trading area and in downstream or contiguous areas." Moreover, the EPA suggests that trading boundaries should be of "manageable size" (EPA 2002a).
The EPA identifies a need for stakeholder involvement and public participation in all stages of the trading system process. Specifically, the EPA identifies a need for additional monitoring (by
the government, pollutant dischargers, or other agencies using approved sampling, analysis, and reporting methods) and public access to all data collected in monitoring. The EPA notes that
"availability of data is important to all parties involved in maintaining water quality" (EPA 2002a).
2.2 Pollution Trading Components
The major pollution trading framework components that must be evaluated for any trading plan are the trading arrangements, nutrient discharge cap, initial distribution of trading credits, and trading ratios. Each of these is discussed in detail in the following sections.
2.2.1 Trading Arrangements
Pollutant trading can be arranged in various forms including, but not limited to intra-plant
trading, pretreatment trading, point/point source trading, point/point source trading, and non-point/non-point source trading, as described below (EPA 2002a):
" Intra-plant trading: "A point source is allocated pollutant discharges among its outfalls in a cost-effective manner, provided that the combined permitted discharge with trading is no greater than the combined permitted discharge without trading in the watershed." * Pretreatment trading: "An indirect industrial point source that discharges to a publicly
owned treatment works arranges, through the local control authority, for additional control by other indirect point sources beyond the minimum requirements in lieu of upgrading its own treatment for an equivalent level reduction."
* Point/point source trading: "A point source arranges for other point source(s) in a watershed to undertake greater than required control in lieu of upgrading its own treatment beyond minimum technology-based treatment requirements in order to more cost-effectively achieve water quality standards."
" Point/non-point source trading: "A point source arranges for control of non-point source discharge(s) in a watershed in lieu of upgrading its own treatment beyond the minimum technology-based treatment requirements in order to more cost-effectively achieve water quality standards."
* Non-point/non-point source trading: "A non-point source arranges for more cost-effective control of other non-point sources in a watershed in lieu of installing or upgrading its own control."
Trading must be confined within one watershed (NWF 1999). Additionally, all point sources must remain in compliance with their NPDES permits and any technology-based limits. Moreover, "intra-plant trades must also have a technology-based floor, while the technology floor for pretreatment trading is determined by categorical standards" (EPA 2002a).
2.2.2 Nutrient Discharge Cap
Trading programs may be open market or closed market programs. In an open market program, no cap is set on the overall amount of pollution and new sources may easily enter the market. Open market programs set a cap per discharger and any pollution reduction below this cap creates a credit for the discharger to sell to other dischargers. In a closed market system, there is an overall fixed or dynamic cap set for a given area (e.g. watershed). In this system, dischargers are allotted a specific number of tradable credits, and no new credits are supplied for new
sources (Powers 1988). For the purposes of this study, only a closed market program was analyzed.
"Setting a goal for the total amount of nutrients that enter waters in a watershed" is the first major step in developing a nutrient trading program (WRI 2002). A cap may be a mandatory reduction in the total amount of nutrients entering the water or may take a voluntary form, where dischargers may choose to participate. Often, nutrient discharge caps are based on TMDL requirements set forth by the state; however, trading programs may be established in impaired waters where TMDLs have not been established when the program "achieves a net reduction of the pollutant or the pollutants causing impairment as providing a direct benefit and progress towards achieving water quality standards" (EPA 2002a).
2.2.3 Initial Distribution of Trading Credits
There are various options that exist for allocating trading credits to the trading partners. The local government could auction off credits or sell credits for a set fee. This distribution system would be favorable for the government because it could keep the revenues to fund the trading program. However, as Ashford et al. note, polluters may not be accepting of either of these
systems, as they would be forced to pay to emit pollution that they had previously emitted for free. Alternatively, the government could distribute credits for free in proportion to current allowable levels of emission. While this form of distribution may not bring in revenues to offset trading transaction costs, pollutant dischargers may perceive the process to be fairer (Ashford et al. 2002).
2.2.4 Trading Ratios
The EPA defines trading ratios as the number of "units of pollutant reduction a source must purchase to receive credit for one unit of load reduction" (EPA 1996). Trading ratios are used to take into account the fact that the same unit of pollution from two sources may lead to two different loads at a given receptor (Woodward 2001). For example, denitrification during watershed transport may significantly reduce nitrogen loads when sources are far from surface water, as is the case with non-point sources, but may not occur to any significant extent for point sources discharging directly to surface water. Moreover, non-point sources often employ best management practices (BMPs)3 in order to decrease their pollutant loads. The decreases in pollutant loads from instituting BMPs may not be easily quantifiable. Thus, trading ratios address differences in distances between sources (which may lead to greater denitrification when sources are far from surface water)
EPA suggests using lower "than 1:1 point/point source and point/non-point source trading ratios necessary to provide a net water quality benefit unless it can be demonstrated that 1:1 trading ratios are consistent with achieving progress towards meeting water quality standards or a direct environmental benefit beyond pollutant load reductions results in progress towards restoring designated uses" (EPA 1996). Especially in watershed-based pollution trading, ratios are often
set lower than 1:1, because "expected nonpoint loadings are imperfect substitutes for point source emissions" (Horan 2001). Indeed, environmental groups are often more likely to support a trading program if trading ratio is lower than 1:1 (Woodward 2000). A proper balance must be
3 BMPs should be both environmentally and economically practicable. Examples include conservation crop rotation (rotating crops on the same field), nutrient management (managing the amount, form, placement, and timing of applications of plant nutrients), mulching (applying plant residues to the soil surface to reduce evaporation and runoff), and waste utilization (using agricultural waste or other waste on land to improve soil and plant resources) (OnePlan 2003).
struck between economic practicability and environmental objectives. A low ratio may provide high environmental gains, but may not induce trades; conversely, a near 1:1 ratio may be
economically optimal, but may not be environmentally stable (Woodward 2001). 2.3 Issues with Trading Programs
While trading programs have the advantage of being flexible and cost-effective, there are some issues that should be considered in designing and implementing a trading program. These include administration of the trading program, pre-quantification of transaction costs, uncertainty in data collection and source monitoring, spatial and temporal distribution of pollutants, and program enforcement.
2.3.1 Administration of Program
EPA notes that trading is most effective "when integrated into existing regulatory and management frameworks, making changes or adding new responsibilities when necessary" (EPA 1996). Therefore, local and regional government agencies - especially environmental agencies - or another trading facilitator will be required to take on a number of additional administrative duties and costs to ensure the legitimacy of any trading program. These duties include, but are not limited to, establishing guidelines for trading, dissemination of information and educational materials to stakeholders, coordination among participants and enforcement agencies, facilitation and brokering of trading deals, documentation and tracking of trades, source monitoring, and enforcement of trading guidelines (EPA 1996).
2.3.2 Pre-Quantification of Transaction Costs
Transaction costs are costs that public and private trading partners and trading facilitators incur during the trading process that they otherwise would not have incurred had trading not taken place. Because trading may not be economically beneficial in all locations, these costs must be quantified before a trading plan is put into place to determine if trading is economically viable. In other words, the economic trading benefit for an entire watershed or for an individual source may be offset by high transaction costs. The total cost of a trading plan, including transaction costs, should be compared to the total costs of applicable alternative policy actions, in choosing the most environmentally acceptable and most cost effective program. Due to uncertainties of future costs and how the nitrogen plan will develop in reality, transaction costs can not be
calculated precisely. Transaction costs vary from project to project and each should be quantified and minimized as much as possible (EPA 1996).
2.3.3 Uncertainty in Data Collection and Source Monitoring
A comprehensive and reliable monitoring plan is essential to any trading system in order to minimize risks to participants and trading facilitators. Uncertainties in data collection and source monitoring can lead to added risks to some participants; these risks may play a role in whether potential trading participants will choose to enter the market or to use traditional pollution controls to decrease pollutant loads. Thus, minimization of risks is crucial for a successful trading program (Woodward 2000). Properly documenting all trades and monitoring point source and non-point source loads and load reductions can minimize risks.
Trading enforcement agencies can minimize their own risks by incorporating uncertainties into trading ratios. Moreover, agencies may be able to require extensive monitoring and reporting
from traders. If agencies are not satisfied with the level of risk involved in a trade, it may choose to block the transaction (Woodward 2000).
Gathering point source data for a trading program will not differ much from a traditional
regulatory program since point sources are already regulated and routinely monitored. However, non-point sources are not yet regulated under the CWA, are episodic, and cannot be easily measured (WRI 2000). Therefore, pollution from non-point sources may be difficult to quantify. It may be difficult to identify, understand the physical conditions of, and obtain reliable data from non-point sources.
The best way to deal with non-point source monitoring may be to quantify reductions in
pollutant loading rather than loading itself. For example, if site specific data is not available, the EPA recommends estimating the effectiveness and efficiency of best management practice techniques, using runoff and soil loss equations and ecosystem modeling and simulations (EPA
1996). In this case, it may be best if traders track their own reductions, since they know what goes into the system best. Government agencies or trading facilitators would only be responsible for water quality monitoring and overall program assessments (CBP 2001).
2.3.4 Spatial and Temporal Distribution of Pollutants
All forms of trading shift pollution loads from one site to another within a watershed (EPA 1996). A pollution source that is far from surface water will have a different effect on the
surface water than one that is close to the surface water. Change in distance of a source can have effects on the transport time to surface water and the level of pollutant decomposition (e.g. denitrification for nitrogen pollutant sources) reached before a pollutant reaches surface waters. While pollution trading may decrease the amount of pollutant throughout a watershed, it may cause "hot spots" of highly concentrated pollutants in particular spots within the watershed. This is especially problematic when diffuse, non-point source pollutant loads are traded with
concentrated, point source pollutant loads (NWF 1999).
Changing the location of a pollutant source can also change the timing of delivery of a load to surface water due to soil properties and land use patterns. Soil properties and land use patterns can affect infiltration and runoff rates and travel times to surface water (EPA 1996).
Additionally, trading that allows polluters to bank credits (hold pollution credits over a given period of time) can change the temporal distribution of pollutants (Ashford et al. 2002).
Trading programs should ensure that high pollutant loads are not concentrated over one area or period of time. Trading facilitators may do so by carefully considering spatial and temporal distribution of pollutants before trades are approved and employing distance dependent trading ratios (NWF 1999).
2.3.5 Enforcement of Program
Trading is only successful when controls placed on sources are enforceable (NWF 1999). In order to enforce standards, a trading facilitator must assess the performance of dischargers by monitoring ambient water quality, individual discharger loading, proper BMP implementation and maintenance (by non-point sources), and proper technology implementation and
maintenance (by point sources) (CBP 2001). As noted above, monitoring of point sources is relatively easy because they are subject to federal regulations.
On the contrary, monitoring non-point sources may be difficult because they are not subject to federal regulations and because citizen lawsuits are not a possible enforcement mechanism. Moreover, few states have been compelled to enact non-point source control laws on their own (NWF 1999). Instead, trade facilitators may need to rely on "reasonable assurances" that sources are complying with trading rules. EPA notes that "nonregulatory, non-federal reasonable
assurances are appropriate bases for trades" when "proposed controls are technically feasible" and when government agencies "have a reasonable expectation that a non-point source will implement specified controls" (EPA 1996). The National Wildlife Federation (NWF) also notes the importance of good compliance records by pollutant dischargers in assuring the stakeholders, government agencies, and the public that proposed trades will not harm water quality (NWF
1999).
Nonetheless, trading facilitators must monitor non-point sources to ensure that non-point source dischargers are complying. Trading facilitators should push for accountability and the authority to impose fines, injunction, or another type of administrative penalty if a source is found in violation of its trading agreement (EPA 1996, NWF 1999).
2.4 Trading Program Case Studies
Nutrient trading programs have been designed and implemented across the U.S. with varying success. Each nutrient trading program involves different trading arrangements (point
source/point source trading and point source/non-point source trading), nutrient discharge caps (pre- or post-TMDL), and trading ratios (ranging from 1:1 to 1:9). Case studies can provide insight on what kinds of trading components have been successful under a given set of circumstances. Nine nutrient trading case studies are summarized in the following sections. 2.4.1 Chesapeake Bay Watershed Nutrient Trading Program, Multi-State
The Chesapeake Bay is the largest estuary in the U.S. The watershed encompasses 64,000 square miles in New York, Pennsylvania, Delaware, Maryland, Virginia, West Virginia and the District of Columbia (CBP 2001). Many of the Chesapeake Bay watershed's waters are listed for impaired water quality. Excessive quantities of nitrogen and phosphorus in the watershed have lead to eutrophication in Chesapeake Bay. A TMDL for the Bay is underway (EPA 1999).
In 1987, various government agencies in the bay area signed the Chesapeake Bay Agreement. This Agreement set goals to reduce nitrogen and phosphorus loading to the Bay by 40 percent of 1985 levels by 2000 and delist the Bay from the impaired water bodies list by 2010. Although many improvements were made to the Bay's water quality, in 1997, the Chesapeake Bay Program (CBP) decided to employ new nutrient reduction methods in order to meet its 2000 goals (CBP 2001). In 1998, the CBP held a workshop on trading; the CBP developed a trading framework by 2001 (EPA 1999).
The CBP trading framework used the 40 percent nutrient reduction as the basis for its nutrient cap. The framework identifies only "like" trades as allowable; this means point sources trading only with other point sources and non-point sources trading only with other non-point sources. BMPs must meet certain standards identified by the CBP. Within the framework, stakeholders that are not sources may purchase credits. Because the program encompasses such a large area, states are responsible for day-to-day management of trading, while the CBP is responsible for general baywide oversight. While trading ratios have not been set, trading ratios should take into account source losses due to attenuation, uncertainty, retirement, and any other special needs. Finally, the program identified the need for stakeholder involvement (CBP 2001). Because the trading framework is still being developed, no trades have been completed to date.
2.4.2 Long Island Sound Trading Program, Connecticut
The Long Island Sound watershed is bounded by New York and Connecticut. It is 110 miles long and 21 miles wide at its broadest point. Because it is home to over eight million people, wastewater treatment plants, atmospheric deposition from cars and industrial sources, and urban runoff account for the highest proportion of nitrogen loads in the watershed (EPA 2003c). Human activity has caused nitrogen levels to increase in the Sound, leading to increased algae growth and dissolved oxygen readings of two mg/L or lower in the summer months. In 2001, EPA approved a nitrogen TMDL analysis for the watershed. The TMDL analysis noted nitrogen trading as a possible cost-saving option for achieving nitrogen load reductions within the
Shortly after EPA approved the TMDL analysis, the Governor of Connecticut authorized a trading framework and established a trading advisory board for a nitrogen trading program. Within the framework of this program, 79 wastewater treatment facilities must decrease their nitrogen loads to the watershed by 58.8 percent by 2014. Each facility has been assigned a nitrogen discharge cap. Facilities may come into compliance with the cap by lowering their nitrogen loads and selling their superfluous credits to the Connecticut Department of
Environmental Protection (CT DEP) or by purchasing additional credits from the CT DEP. Because nitrogen naturally attenuates as it flows down the river and into the sound, trading ratios vary from 1:1 to 1:9 (point source: non-point source), based on the differential impacts that each source will have on water quality. Long-term banking of credits is not expected; nitrogen credits would likely be valid for up to one year (CTDEP 2003).
2.4.3 Fox-Wolf Basin Watershed Pilot Trading Program, Wisconsin
The Fox-Wolf River watershed is located in east-central Wisconsin and is comprised of three sub-watersheds (Lower Fox, Upper Fox, and Wolf). The basin drains over four million acres of land into Green Bay before reaching Lake Michigan. The watershed is the third largest land area draining into the Great Lakes. Point and non-point sources (including agricultural and urban runoff) have lead to increasing levels of phosphorus loading and eutrophication in Green Bay (UWEX 2003). In 1988, the State of Wisconsin established a mandatory 1 mg/L phosphorus limit on point sources and a future 0.3 mg/L limit (EPA 1999). The State has also established non-point runoff regulations for agricultural, urban, and transportation areas, effective October 2002. Specifically, these regulations require that agricultural sources meet performance
standards and manure management prohibitions and for cost sharing to be available to sources not in compliance. Moreover, local officials are given the authority to implement and enforce trading rules (UWEX 2003).
In 1992, a team of stakeholders examined trading possibilities for the watershed. A study completed by these stakeholders concluded that trading would be appropriate for the Lower Fox River Basin because non-point phosphorus loads would be less expensive to reduce than point source loads. It also concluded that the Upper Fox River Basin would not be an appropriate area for trading since non-point source reductions would be costlier than point source reductions. The
study's final conclusion was that the Wolf River Basin may or may not be appropriate for trading depending on future discharge limits imposed on wastewater treatment plants. The study team also completed extensive modeling and monitoring of processes in the watershed. While
TMDLs have been developed for some segments of the rivers, the stakeholders suggested further application of TMDLs for phosphorus and other pollutants. To date, no trading program has been implemented, but the program is part of a statewide initiative to evaluate nutrient trading (EPA 1999).
2.4.4 Kalamazoo River Water Quality Trading Demonstration Project, Michigan The Kalamazoo River watershed covers 2000 square miles in southwest Michigan. The area includes parts of ten counties, which is comprised mostly by cropland and pasture (57 percent), forest (21 percent), and urban areas (eight percent). Point sources of phosphorus include over 50 NPDES dischargers (mostly wastewater treatment plants and paper mills); the major non-point phosphorus source is from agricultural sources (ETN 2002).
In 1995, the Michigan Department of Environmental Quality (MDEQ) began developing a statewide, voluntary nutrient trading program in order to improve water quality. Within this program, closed trading would occur where a TMDL has been established and open trading will occur where a TMDL or other cap has not been established. The Kalamazoo River Water Quality Trading Demonstration Project became a two-year pilot program under the statewide program. A TMDL assessment has been completed for the watershed because of nuisance algae conditions due to phosphorus in Lake Allegan (EPA 1999).
In order to complete the project, the various stakeholders formed a Steering Committee, which was to provide outreach to stakeholders and promote, design, implement, and monitor the trading program (ETN 2002). Within the Kalamazoo River framework, point sources will receive credit for voluntary phosphorus load reductions by non-point sources. Half of the load reduction credits from non-point sources will be retired, while the other half will go directly to non-point sources (EPA 1999). At least six non-point sources participated in the project - reducing phosphorus loading to the river by 2,142 pounds - by implementing BMPs, including
was considered successful because phosphorus loadings were decreased at a lower cost than with traditional regulation, the project did identify various drawbacks, including uncertainties in credit generation, variable risks to creditors and debtors, and lack of broad-based participation (ETN 2002).
2.4.5 Lower Boise River Effluent Trading Demonstration Project, Idaho
The Lower Boise River runs for 64 miles between Lucky Peak Dam, Idaho and the Snake River, south of Parma, Idaho. Various segments of the Lower Boise River are listed on EPA's 303(d) list for multiple pollutants, including nutrients (LBRWQP 2002). Conditions for nuisance growth are present in the Boise River and actual nuisance growth is present in the Snake River watershed (EPA 1999).
The trading project is coordinating development of trading in conjunction with the completion of TMIDL implementation. EPA Region 10 and IDEQ developed the trading project (EPA 1999). The trading demonstration project began in 1998 and was carried out in two phases: one to focus on the potential supply and demand for trading and a second to develop a framework for carrying out the trading process. This framework suggested a TMDL with adjustable wasteload
allocations, permits with adjustable effluent limits, point/point source or point/non-point source trading, and three types of distant dependent trading ratios (IDEQ 2000). However, as of late 2002, no trades had taken place, although BMP lists had been distributed to stakeholders. 2.4.6 Town of Acton Municipal Treatment Plant, Massachusetts
The Assabet River runs for 30 miles, beginning in Westborough, MA and flowing to Concord, MA. Portions of the Assabet River, including the area around the Town of Acton, do not meet water quality standards for nitrogen, phosphorus, dissolved oxygen, and pathogens. A TMDL study is currently underway; Phase I of the TMDL found that the river is significantly impaired by nutrients, with wastewater treatment facilities contributing the highest load to the river and non-point sources contributing significantly less (OAR 2003). The Town of Acton (with a population of about 17,000) currently does not have a wastewater treatment facility and is looking to replace failing septic systems. However, new discharges of phosphorus into the river are not allowed because of already high phosphorus levels (EPA 1999).
A trading system has been proposed for the area in order to offset any discharges caused by the building of a new wastewater treatment facility in the area. The wastewater treatment plant would be allowed to discharge one unit of phosphorus for every three units of phosphorus removed by non-point sources (EPA 1999). Non-point sources would be able to reduce their loads through a variety of BMPs, including lawn fertilizer management, pet waste management, road sanding and landscaping (OAR 2003). However, connecting septic systems to the
wastewater treatment facility would not be considered a possible trade, as the two sources are related (EPA 1999).
2.4.7 Tar-Pamlico Nutrient Reduction Trading Program, North Carolina
The Tar-Pamlico River runs for 180 miles from the Piedmont region to the Pamlico Sound and the Atlantic Ocean. Non-point sources, including agriculture, account for about 92% of the nitrogen loadings to the river, while point sources, primarily municipal wastewater treatment plants, contribute the remaining 8% (EPA 1996). In the early 1980s, increasing fertilizer use and development began to affect the river, causing occurrences of diseased fish, sporadic fish kills, increased sediment and nutrient loads, phytoplankton blooms, and low dissolved oxygen (DO) levels (NCDWQ 2002).
Because of the increasing nutrient loading concerns, the North Carolina Division of
Environmental Management (NCDEM) implemented stricter nutrient effluent standards. Due to the high cost of compliance, a coalition of dischargers, working with government officials and non-government organizations, developed a point/non-point source nutrient trading framework. The first phase of the project allowed point sources to reduce their nutrient loads through cost-effective measures, while the second phase established a program for non-point sources to reduce their loads through BMPs, including fertilizer management programs and riparian buffering (EPA 1996, NCDWQ 2002).
The first phase of the program established an annually decreasing, collective nutrient load cap for point source nutrient dischargers. Dischargers would meet this collective load cap by
allowing wastewater treatment facilities to make small, cost-effective changes to their machinery and operations in order to meet the common cap (EPA 1996). Overall, 14 wastewater treatment facilities joined the trading association and nutrient loads decreased by 20 percent. The first