Development of Machine Learning Algorithms for
Screening of Pulmonary Disease
by
Christian Infante
Submitted to the Department of Electrical Engineering and Computer
Science
in partial fulfillment of the requirements for the degree of
Master of Engineering in Electrical Engineering and Computer Science
at the
MASSACHUSETTS INSTITUTE OF TECHNOLOGY
September 2017
c
○ Massachusetts Institute of Technology 2017. All rights reserved.
Author . . . .
Department of Electrical Engineering and Computer Science
August 28, 2017
Certified by . . . .
Richard R. Fletcher
Research Scientist, D-Lab
Thesis Supervisor
Accepted by. . . .
Christopher Terman
Development of Machine Learning Algorithms for Screening
of Pulmonary Disease
by
Christian Infante
Submitted to the Department of Electrical Engineering and Computer Science on August 28, 2017, in partial fulfillment of the
requirements for the degree of
Master of Engineering in Electrical Engineering and Computer Science
Abstract
Pulmonary diseases are a leading cause of death worldwide. Much of their burden disproportionately affects the developing world. The MIT Mobile Technology Lab has developed a Mobile Kit which screens and diagnoses COPD and asthma. In this thesis, we analyze and further develop tools in this kit.
All of the data for this thesis were collected as part of a large medical study with our partner, the Chest Research Foundation (CRF), in Pune, India. The data consisted of 325 patients (135 healthy, 76 asthma, 46 COPD, 29 allergic rhinitis, and 39 other). Among the asthma and COPD patients, 67 had allergic rhinitis. All patients were examined using a mobile diagnostic kit designed at MIT consisting of a mobile stethoscope, peak flow meter, and questionnaire. All patients were also examained using the convential gold standard pulmonary function testing (PFT) lab. The performance of our Mobile Kit platform was previously analyzed and presented in a prior Master’s thesis.
Building on our group’s prior work, in this thesis we present three main contri-butions: 1) we have created a classifier for a new disease category, allergic rhinitis, which accounts for roughly half of all respiratory clinic patients; 2) we have explored and anlayzed the value of cough sounds as a diagnostic tools for pulmonary disease; and 3) we have analyzed data from a pulmonary function testing lab which were collected in parallel with our group’s Mobile Diagnostic Kit, and have compared the performance.
In the first section of this thesis, we created a classifier for allergic rhinitis diagno-sis, using the same multi-layer classification structure as was used in our group’s prior
work. This integrated classifier demonstrated moderate performance with AUCs ranging from 0.87 to 0.90. As a second approach, a standalone classifier was also explored, which produced much better results, with an AUC of 0.96. Going forward, we plan to use an independent classifier as part of our diagnostics.
In the second part of this thesis, we explored the value of cough sounds for pul-monary diagnosis. Various classifiers were created for the screening and diagnosis of pulmonary disease through the analysis of cough sounds. We first created a classi-fier for the detection of Wet and Dry coughs (which can indicate overall pulmonary health), which had a high classification performance but limited diagnostic value. We then explored the diagnostic value of specific physical features of the cough sounds, including kurtosis, variance, zero crossing irregularity, and rate of decay. the utility of these features were then analyzed both in isolation and integrated with other Mo-bile Kit tools. It was discovered that these cough sound features do have value as a simple diagnostic tool to distinguish between asthma and COPD, as well as basic pulmonary health; however, it was found that cough sounds alone provide less value than other diagnostic tools for providing disease-specific diagnosis. When integrated with the Mobile Kit tools, cough sounds only improved performance on lung sounds; otherwise, coughs did not have any added benefit. Given the ease of data collection, we demonstrated that cough sounds can play a role in simple disease screening for use with community health workers.
For the third major part of this thesis, we did a thorough analysis of pulmonary function testing (PFT) data, which is the gold standard for pulmonary disease di-agnosis. The PFT laboratory tools included spirometry, impulse oscillometry, body plethysmography, and lung gas diffusion (DLCO). We first explored a multi-layer classification structure. Using this structure, the PFT machines produced good re-sults on each classification layer: Healthy vs. Unhealthy [AUC=0.90 (0.04)], Obstruc-tive (Obs.) vs. Non-obstrucObstruc-tive [AUC=0.95 (0.05)], Obs. AR vs. Obs. Non-AR [AUC=0.72 (0.10)], COPD + AR vs. Asthma + AR [AUC=0.95 (0.15)], COPD vs. Asthma [AUC=1.00 (0.04)], Non-Obs. AR vs. Non-Obs. Non-AR [AUC=0.92 (0.12)]. These results are only moderately better than the results yielded by our Mo-bile Diagnostic Kit: Healthy vs. Unhealthy [AUC=0.98 (0.02)], Obstructive (Obs.) vs. Non-obstructive [AUC=0.96 (0.04)], Obs. AR vs. Obs. Non-AR [AUC=0.90 (0.06)], COPD + AR vs. Asthma + AR [AUC=0.93 (0.09)], COPD vs. Asthma [AUC=1.00 (0.00)], Non-Obs. AR vs. Non-Obs. Non-AR [AUC=0.87 (0.12)]. Al-though these results are moderately good, the compounded error represents an un-acceptable level of misclassification.
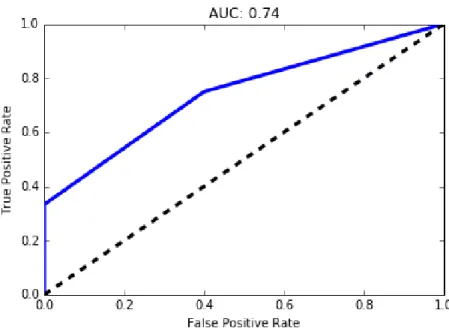
data, the individual classifiers produced the following results: asthma [AUC=0.96 (0.04)], COPD [AUC=0.99 (0.03)], and allergic rhinitis [AUC=0.74 (0.08)]. For the Mobile Kit data, the individual classifiers produced the following results: asthma [AUC=0.90 (0.05)], COPD [AUC=0.94 (0.05)], and allergic rhinitis [AUC=0.96 (0.03)].
In summary, building on our group’s prior work, in this thesis we have expanded the capability of our Mobile Diagnostic Kit to include allergic rhinitis, as well as improved the diagnostic specificity to account for co-morbidities (asthma + AR, COPD + AR). Although our multi-layer classifier design has value in providing diagnostic insight and feedback to clinicians, we recommend that future versions of our Mobile Kit also include individual classifiers for specific disease categories (asthma, COPD, allergic rhinitis, asthma + AR, COPD + AR) in order to improve performance.
Thesis Supervisor: Richard R. Fletcher Title: Research Scientist, D-Lab
Acknowledgments
First and foremost, I would like to thank my supervisor, Rich Fletcher, for his tireless commitment to the work on which this thesis is based. His vast and eclectic source of knowledge inspired and motivated much of this work.
I would also like to thank everyone at the Chest Research Foundation (CRF) in Pune, India, for being wonderful hosts and sharing with me most, if not everything, I know about pulmonary disease. I would especially like to thank Dr. Rahul Kodgule, for his insight and kindness; Yogesh Thorat, for his dedication and devotion; Dr. Sundeep Salvi, for his knowledge; and Dr. Shrikant Pawar, for his hard work in planning the next clinical study.
At MIT, I would like to thank the Tata Center for Development and Design, for funding and guiding my work. I would especially like to thank Dr. Rob Stoner and Dr. Chintan Vaishnav, for their teachings in the Tata Seminar; and Dr. Nevan Hanumara, for all his advice.
Finally, I would like to thank my my mother and father, without whose guidance, love, and support, I would not be.
Contents
1 Introduction 23
1.1 Burden of Pulmonary Disease . . . 23
1.1.1 Worldwide . . . 23
1.1.2 India-specific . . . 24
1.2 Gold Standard for Pulmonary Disease Diagnosis . . . 26
1.3 The Need for AI-Based Diagnostic Support . . . 27
1.4 Previous Work in AI for Pulmonary Diagnostics . . . 28
1.4.1 MIT Mobile Dianostic and Screening Kit . . . 28
1.4.2 Commercial Products . . . 29
1.5 Scope of Thesis . . . 30
1.5.1 Overview . . . 33
2 Diagnosis of Allergic Rhinitis (AR) 35 2.1 Data Collection . . . 35
2.2 Feature Extraction . . . 37
2.2.1 Risk Factor and Symptom Questionnaire . . . 37
2.2.2 Peak Flow Meter . . . 37
2.3 Classification Scheme . . . 39
2.4 Ideal Tool for AR Diagnosis . . . 40
2.5 Unsupervised Analysis . . . 41 2.5.1 Methods . . . 42 2.5.2 Results . . . 44 2.5.3 Discussion . . . 46 2.6 Independent Classifier . . . 47 2.6.1 Methods . . . 47 2.6.2 Results . . . 47 2.6.3 Discussion . . . 48
2.7 Integration of AR Classification into Full Diagnostic Protocol . . . 48
2.7.1 Methods . . . 48
2.7.2 Results . . . 48
2.7.3 Discussion . . . 49
3 Use of Cough Sounds for Screening and Diagnosis of Pulmonary Disease 53 3.1 Motivation . . . 54
3.1.1 Previous Work . . . 55
3.2 Data Collection . . . 56
3.3 Data Preprocessing . . . 57
3.4 Cough Feature Selection . . . 58
3.4.1 Segmentation . . . 58
3.4.2 Feature Extraction . . . 58
3.5.2 Pulmonary Health and Disease . . . 59
3.6 Unsupervised Analysis . . . 61
3.6.1 Methods . . . 61
3.6.2 Results . . . 61
3.6.3 Discussion . . . 63
3.7 Supervised Analysis (Trained with Non-Comorbid and Comorbid Pa-tients) . . . 64
3.7.1 Methods . . . 64
3.7.2 Results (Coughs in Isolation) . . . 65
3.7.3 Results (Coughs Integrated into Mobile Kit) . . . 68
3.7.4 Discussion . . . 70
3.8 Supervised Analysis (Trained with Non-Comorbid Patients) . . . 76
3.8.1 Methods . . . 76
3.8.2 Results . . . 77
3.8.3 Discussion . . . 81
3.9 Future Improvements . . . 82
4 Analysis of Pulmonary Function Testing (PFT) Data 85 4.1 Motivation . . . 86
4.1.1 Past Work . . . 86
4.2 Machine Overview . . . 86
4.3 Data Collection . . . 88
4.4 Data Pre-processing and Feature Selection . . . 92
4.4.1 Spirometry and DLCO . . . 92
4.4.2 Impulse Oscillometry . . . 92
4.5 Unsupervised Learning Analysis . . . 94
4.5.1 Choice of Methods . . . 94
4.5.2 Cluster Analysis Results . . . 94
4.5.3 Discussion of Cluster Analysis Results . . . 100
4.6 Supervised Learning Analysis of PFT Data in Isolation . . . 101
4.6.1 Motivation . . . 101
4.6.2 Classification Design . . . 101
4.6.3 Methods . . . 101
4.6.4 Results of Supervised Learning Analysis . . . 103
4.6.5 Discussion of Individual Classifier Results . . . 105
4.6.6 Recommendations . . . 111
4.7 Supervised Analysis of PFT Data with Clinical Features . . . 113
4.7.1 Motivation . . . 113
4.7.2 Methods . . . 114
4.7.3 Results of Supervised Learning Analysis . . . 114
4.7.4 Discussion . . . 115
4.8 Supervised Learning Analysis of PFT Data Using Independent Clas-sifiers . . . 117 4.8.1 Motivation . . . 117 4.8.2 Classification Design . . . 118 4.8.3 Methods . . . 118 4.8.4 Results . . . 118 4.8.5 Discussion . . . 118
4.9 Performance Comparison of PFT vs. Mobile Kit . . . 119
5 Summary of Findings and Recommendation for Mobile Diagnostic
Kit 123
5.1 Summary of Findings . . . 123
5.1.1 Allergic Rhinitis Classifier . . . 123
5.1.2 Cough Sound Analysis . . . 124
5.1.3 Pulmonary Function Testing (PFT) Analysis . . . 124
5.2 Mobile Pulmonary Screening Application . . . 125
5.2.1 Current Application Design . . . 125
5.2.2 Recommendations for Future Versions . . . 125
List of Figures
1-1 Previous classification scheme. . . 31 1-2 New classification scheme. Dotted lines denote classifiers that will be
created in the future. Yellow boxes denote additions to the old scheme. 32 2-1 New classification scheme. Dotted lines denote classifiers that will be
created in the future. Yellow boxes denote additions to the old scheme. 39 2-2 Cattel Scree plot from factor analysis of questionnaire data . . . 43 2-3 Top 10 coefficients of independent AR classifier when utilizing only
the questionnaire . . . 47 3-1 Sample sound file showing raw cough data . . . 59 3-2 Smoothed cough signal magnitude and detected peaks (circled) . . . . 60 3-3 Plot of extract cough segment (blue); computed upper envelope (red);
exponential fit (green) . . . 61 3-4 Classification scheme used in cough sound analysis . . . 63 3-5 Plot of patients (Unhealthy vs. Healthy) using Kurtosis and Rate of
Decay . . . 65 3-6 Plot of paatients (Obstructive vs. Non-obstructive) using Zero Cross
3-7 Plot of wet/dry coughs comparing the features kurtosis and rate of decay . . . 67 3-8 Receiver operator curve for wet-dry cough classifier . . . 68 3-9 Receiver operator curve for Healthy vs. Unhealthy classifier using
cough features in isolation . . . 70 3-10 Receiver operator curve for Obstructive vs. Non-obstructive classifier
using cough features in isolation . . . 71 3-11 Receiver operator curve for COPD vs. Asthma classifier using cough
features in isolation . . . 72 3-12 Top 10 coefficients of pulmonary health classifier when utilizing
fea-tures extracted from all mobile kit tools . . . 74 3-13 Top 10 coefficients of obstructive pulmonary disease classifier when
utilizing features extracted from all mobile kit tools . . . 75 3-14 Top 10 coefficients of COPD/asthma classifier when utilizing features
extracted from all mobile kit tools . . . 76 3-15 New classification scheme. Dotted lines denote classifiers that will be
created in the future. Yellow boxes denote additions to the old scheme. 83 4-1 Top 10 coefficients of pulmonary health classifier when utilizing
fea-tures extracted from all PFT machines . . . 95 4-2 Top 10 coefficients of pulmonary health classifier when utilizing
fea-tures extracted from all PFT machines . . . 96 4-3 Top 10 coefficients of pulmonary health classifier when utilizing
fea-tures extracted from all PFT machines . . . 97 4-4 New classification scheme. Dotted lines denote classifiers that will be
4-5 Top 10 coefficients of pulmonary health classifier when utilizing fea-tures extracted from all PFT machines . . . 109 4-6 Top 10 coefficients of obstructive pulmonary health classifier when
utilizing features extracted from all PFT machines . . . 110 4-7 Top 10 coefficients of AR vs. Non-AR (Obstructive) classifier when
utilizing features extracted from all PFT machines . . . 111 4-8 Top 10 coefficients of COPD/asthma (comorbid) classifier when
uti-lizing features extracted from all PFT machines . . . 112 4-9 Top 10 coefficients of COPD/asthma (pure) classifier when utilizing
features extracted from all PFT machines . . . 113 4-10 Top 10 coefficients of AR vs. Non-AR (Non-obstructive) classifier
when utilizing features extracted from all PFT machines . . . 114 5-1 Previous classification scheme. . . 126 5-2 Figure from Daniel Chamberlain’s thesis summarizing the workflow of
the Pulmonary Screener Application. . . 127 5-3 New classification scheme. Dotted lines denote classifiers that will be
List of Tables
2.1 Disease distribution within the cough analysis dataset . . . 36 2.2 Summary of lung sound features . . . 38 2.3 Performance of independent AR classifier trained on PFT vs. Mobile
Kit . . . 40 2.4 Performance of full diagnostic protocol’s AR classifier (obstructive)
trained on PFT vs. Mobile Kit . . . 40 2.5 Performance of full diagnostic protocol’s AR classifier (non-obstructive)
trained on PFT vs. Mobile Kitnobs . . . 41 2.6 Results of variance test for determining number of factors for factor
analysis of questionnaire data . . . 43 2.7 Summary of k-means cluster analysis on questionnaire features . . . . 45 2.8 Disesase composition of clusters from k-means analysis of risk factor
and symptom questionnaire . . . 46 2.9 Performance of independent AR classifier trained on the questionnaire 47 2.10 Performance of Healthy vs. Unhealthy classifier utilizing different
2.11 Performance of Obstructive vs. Non-obstructive classifier utilizing dif-ferent Mobile Kit feature set combinations under the new classification scheme . . . 50 2.12 Performance of Pure COPD vs. Pure Asthma classifier utilizing
differ-ent Mobile Kit feature set combinations under the new classification scheme . . . 51 2.13 Performance of AR classifier (non-obstructive) utilizing different
Mo-bile Kit feature set combinations under the new classification scheme 51 2.14 Performance of COPD vs. Asthma (comorbid) classifier utilizing
dif-ferent Mobile Kit feature set combinations under the new classification scheme . . . 52 2.15 Performance of AR classifier (obstructive) utilizing different Mobile
Kit feature set combinations under the new classification scheme . . . 52 3.1 Disease distribution within the cough analysis dataset . . . 56 3.2 Summary statistics of the cough analysis dataset . . . 57 3.3 Description of extracted cough sound features . . . 62 3.4 Results of k-means cluster analysis utilizing cough sound features . . 62 3.5 Summary of normalized feature values from k-means cluster analysis . 64 3.6 Wet/Dry Classifier Results . . . 66 3.7 Performance of classifiers utilizing cough features in isolation . . . 67 3.8 Performance of Healthy vs. Unhealthy classifier utilizing different
fea-ture set combinations . . . 69 3.9 Performance of Obstructive vs. Non-obstructive classifier utilizing
dif-3.10 Performance of COPD vs. Asthma classifier utilizing different feature set combinations . . . 73 3.11 Performance of Unhealthy classifier trained on all patients (comorbid
and non-comorbid) vs. trained on pure patients (non-comorbid) . . . 78 3.12 Performance of Obstructive classifier trained on all patients (comorbid
and non-comorbid) vs. trained on pure patients (non-comorbid) . . . 79 3.13 Performance of COPD/Asthma classifier trained on all patients
(co-morbid and non-co(co-morbid) vs. trained on pure patients (non-co(co-morbid) 80 4.1 Summary of PFT fields which were included in the analysis . . . 89 4.2 Summary of PFT fields which were included in the analysis . . . 90 4.3 Summary statistics of patients who completed various combinations
of the PFT machines . . . 91 4.4 Intra-cluster disease breakdown within PFT dataset . . . 96 4.5 Results of unsupervised analysis of COPD patients from PFT dataset 98 4.6 Results of unsupervised analysis of asthma paptients from PFT datset 99 4.7 Performance of Healthy vs. Unhealthy classifier different PFT feature
set combinations . . . 103 4.8 Performance of Obstructive vs. Non-obstructive classifier different
PFT feature set combinations . . . 104 4.9 Performance of AR vs. Non-AR (Obstructive) classifier different PFT
feature set combinations . . . 105 4.10 Performance of COPD vs. Asthma (Comorbid) classifier different PFT
feature set combinations . . . 106 4.11 Performance of COPD vs. Asthma (Non-comorbid) classifier different
4.12 Performance of AR vs. Non-AR (Non-obstructive) classifier different PFT feature set combinations . . . 108 4.13 Performance of Healthy vs. Unhealthy classifier when trained on
dif-ferent combinations of PFT and clinical data . . . 115 4.14 Performance of Obstructive vs. Non-obstructive classifier when trained
on different combinations of PFT and clinical data . . . 115 4.15 Performance of AR classifier (obstructive) when trained on different
combinations of PFT and clinical data . . . 116 4.16 Performance of COPD vs. Asthma (comorbid) classifier when trained
on different combinations of PFT and clinical data . . . 116 4.17 Performance of COPD vs. Asthma (non-comorbid) classifier when
trained on different combinations of PFT and clinical data . . . 117 4.18 Performance of AR (non-obstructive) classifier when trained on
differ-ent combinations of PFT and clinical data . . . 117 4.19 Performance (sensitivity and specificity) of independent classifiers when
trained using data from all PFT machines . . . 119 4.20 Classification results of running patients through full diagnostic
pro-tocol trained on PFT data . . . 121 4.21 Classification results of running patients through full diagnostic
pro-tocol trained on Mobile Kit data . . . 122 4.22 Performance (sensitivity and specificity) of independent classifiers when
Chapter 1
Introduction
1.1
Burden of Pulmonary Disease
1.1.1
Worldwide
Pulmonary diseases are a leading cause of death worldwide. Lower respiratory infec-tions, chronic obstructive pulmonary disease (COPD), lung cancer, and tuberculosis accounted for 14% of deaths worldwide in 2012, and 11% of disability-adjusted-life-years (DALYs) lost worldwide in 2008 [11, 7]. Lower respiratory infections alone were the leading cause of DALYs lost (5.4%) [7].
An estimated 235 million people suffer from asthma, and 200 million people suffer from COPD [5, 6]. Asthma is characterized by airway inflammation whose symptoms include coughing, wheezing, breathlessness, and/or chest pain. Asthma patients usually also suffer from allergies [13].
An estimated 180,000 people die annually from asthma, with over 80% of these deaths occurring in low and lower-middle income countries [5, 9]. Most of these deaths occur in middle-aged patients and are considered preventable (either due to
inadequate or lack of care) [9]. The burden of asthma is expounded in developing countries, where patients have limited access to medications and proper care [9].
COPD is characterized by restricted air flow due to damaged air sacs (alveoli) and/or inflamed airways [8]. COPD is not exclusively a smoker’s disease, as previ-ously thought, even though smoking is its leading cause [13]. Other factors, such as poor air quality and poorly ventilated indoor biomass cooking, also cause COPD [10]. It causes irreversible lung damage, though the prevention of further deterioration is possible with appropriate treatment and lifestyle changes.
Most of the information known about COPD (its prevalence, morbidity, and mortality) is from data obtained in affluent countries; however, over 90% of COPD deaths occur in low- and middle-income countries [6]. COPD disproportionately affects these regions due to increased exposure to harmful environmental factors, such as air pollution and fumes from indoor biomass cooking.
1.1.2
India-specific
High Prevalence
In India, non-communicable diseases accounted for 53% of all deaths in 2005. Of these, 7% were due to chronic respiratory disease [42]. It is believed that around 20 million people suffer from COPD, and 30 million from asthma, in India [43]. Additionally, the country is suffering from a significant growing percentage of COPD mortality, believed to be one of the highest in the world [44].
Tobacco Use
and chillum.)
It is estimated that 275 million people use tobacco in India, many under the age of 15. There is an increase in hookah use within Indian young adults, with prevalence reports within 5-14% [49]. Studies have shown that hookah smoking leads to an increased risk of lung disease; for example, lung cancer has been found to be six times more likely in hookah smokers than non-smokers [41].
Air Pollution Outdoor
Air pollution is another concern. India has 13 of the 20 most polluted cities in the world [37]. Since 2010, there has been a 30% increase in acute respiratory infections cases. Many doctors blame this on poor air quality [36].
Indoor
Another aspect of Indian life that might indicate why pulmonary disease is so preva-lent is the use of biomass cooking stoves, many of which are used indoors. In India, 70% of homes use biomass fuels for cooking in kitchens with poor ventilation [39]. The disparity between rural and urban settings is stark: 90% of rural homes use biomass stoves, whereas 32% of urban homes do [40]. In the rural settings, the negative effects of biomass stoves tend to affect women more [38].
Shortage of Doctors
Another reason for the high burden of pulmonary disease on India is a shortage of medical professionals, especially in rural areas. According to the WHO, there are only 0.725 physicians per 1000 citizens, a figure that has decreased since 1991 (when India had 1.225 physicians per 1,000 citizens. As reference, the United States has
2.554 physicians per 1,000 citizens [58]. Alternative Medicine
A study of pulmonary patients from Asian-Pacific countries (including India) quanti-fied the burden of pulmonary disease, mainly looking at the utilization of healthcare and cost to the patient. It found that patients with rhinosinusitis (sinus infection), COPD, or asthma most frequently used a general practitioner (GP), while patients with allergic rhinitis (AR, an inflammation in the nose caused by allergens) tended to visit a pharmacist or a traditional medicine practitioner. The study also showed the use of drugs for these patients. When the patients were interviewed, 80% in-dicated that they had taken medication (usually inhalers, antibiotics, or antihis-tamines) within the previous four weeks. One interesting note is the popularity of traditional medicine among AR patients (23% of them visited a traditional medicine practitioner).
The direct (like medications) and indirect (like lost work hours) annual costs for an average patient of a pulmonary disease was found to be, on average, 637 USD. The biggest component of this was productivity loss. It should be noted that most of people used in this study had full-time jobs, most likely leading to the large annual cost due to work productivity loss [35].
1.2
Gold Standard for Pulmonary Disease Diagnosis
The gold standard for the diagnosis of many pulmonary diseases, as per the American Thoracic Society (ATS) and the European Respiratory Society (ERS) is Pulmonary Function Testing (PFT) [45]. these instruments include:
i) Body plethysmograph: a transparent box in which the patient sits and breathes in and out of a mouthpiece. The pressure within the box can change, allowing for a determination of lung volume.
ii) Spirometry: a recording of the amount and rate of air breathed in and out over a period of time.
iii) Diffusing capacity of the lungs for carbon monoxide (DLCO): a measurement of the how much oxygen passes through the lungs into the blood.
iv) Impulse Oscillometry: a measurement of pulmonary resistance and reactance.
Many people in developing countries are unable to undergo PFT, either because it is too expensive, not available, or is administered by someone without adequate training. Therefore, many of the diagnoses in these regions rely on stethoscopes and/or clinical histories. To further aggravate the situation, many patients in these regions use traditional, non-Western medicine.
The burden of these diseases, coupled with the inadequacies of current diagnostic procedures in the developing world, creates a distinct need for high-quality, accurate, and affordable tools. There is increasing interest in mobile health technology, specif-ically through smart phone applications. For example, India has recently launched the Mobile Health Program, training community health worker to use a mobile health platform to improve maternal and child care in rural regions [4].
1.3
The Need for AI-Based Diagnostic Support
In the developing world, there is a scarcity of pulmonologists. This creates a dilemma: even if these areas had access to Pulmonary Function Testing (PFT), there are not sufficient trained professionals to accurately interpret the results. Additionally, many
patients in these regions seek help from practitioners of traditional (non-Western) medicine, which does not appropriately cover pulmonary disease.
Diagnostic tools based on an artificial intelligence foundation would address the above concerns. For one, the tool would be built from an analysis of data validated by the current gold standard for diagnosis. Also, utilizing these tools would require no knowledge of how they were created. These tools would therefore empower indi-viduals without a medical background to accurately screen for pulmonary disease.
1.4
Previous Work in AI for Pulmonary Diagnostics
1.4.1
MIT Mobile Dianostic and Screening Kit
Work done by a former MIT student, Daniel Chamberliain, culminated in a Mobile Kit to screen for COPD and asthma, which provide the laragest burden of pulmonary disease worldwide. The Mobile Kit is hosted entirely on an Android phone. There are three main components to the Kit:
(i) Questionnaire: An electronic questionnaire was created with the guidance of a pulmonologist, using various other questionnaires as guidance. The questionnaire ultimately captured basic patient information (sex, weight, height, etc.), as well as "the onset, duration, and progress of breathlessness, coughing, chest pain, fever, and nasal symptoms".
(ii) Peak Flow Meter : An inexpensive tool commonly used by asthma patients to determine lung performance. A test involves taking a deep breath and blowing into the tube; the results are in liters per minute. Various trials of this tool are recorded by the Mobile Kit. The data are collected via augmented reality.
microphone and an auxiliary port. It allows lung and cough sounds to be recorded directly onto the Android device.
Previous work showed that the questionnaire and the peak flow meter provide the best diagnostic guidance for distinguishing between COPD and asthma.
1.4.2
Commercial Products
There are commercial products aimed at the developed world that allow users to monitor pulmonary health. One such product is Eko Device’s DUO, an electronic stethoscope and EKG which continually monitors a user for any cardiac abnormalities [56]. Another product is StethoMe, which is an electronic stethoscope aimed for quick check-ups on children to determine whether or not a doctor’s visit is required [57]
Many of the solutions for pulmonary disease screening in developing countries (and of any disease in general) is to check symptoms through the completion of a questionnaire. There are questionnaire-based solutions that focus on specific diseases, COPD and asthma being the most common. For COPD, sample solutions include the Lung Function Questionnaire and the COPD Population Screener questionnaire [52, 53]. These tools ask a couple questions related to smoking, age, and symptoms; however, patients determined to be at risk are advised to complete diagnostic exams (i.e. spirometry). Similarly, asthma has tools such as the Asthma Control Test, the Asthma Control Questionnaire, and the Asthma Therapy Assessment Questionnaire. Unlike the COPD tools described above, some of these asthma questionnaires are also very lengthy, making them tedious [54].
Another proposed solution, specific to COPD, is COPD-6, a mobile tool which mimics a spirometer. However, creating an entirely new piece of hardware as a solu-tion proves costly (the COPD-6 is priced around 100-125 USD) [50, 51]. Financially,
this solution would not be viable in developing areas.
This leads to the desire to integrate a solution within pre-existing hardware. Given the rising interest of mobile health technology in developing countries, the natural progression is to host pulmonary disease screening software tools on a mobile device.
The current research is in using machine learning to create these tools. One Australia-based group, ResApp, is trying to diagnose disease through voluntary coughs [46]. However, all of their work so far relies on involuntary coughs, which are more cumbersome to acquire (since a microphone must be placed near a patient for hours). It is unclear whether it is proper to use their results on involuntary coughs and associate them to voluntary ones. Research has been done within the medical community to analyze the diagnostic value of involuntary coughs, but work still must be done to determine the value of voluntary coughs [55].
1.5
Scope of Thesis
This thesis continues from the work of Daniel Chamberlain, who developed and ana-lyzed the first version of our group’s Mobile Kit. There are three main contributions from my work:
1) The Mobile Kit has been further validated by comparing its results to Pul-monary Function Testing (PFT) data
2) Disease classification has been expanded to include allergic rhinitis (AR) 3) A new data source (cough sounds) has been analyzed
Figure 3-4.
Figure 1-1: Previous classification scheme. This classification scheme has been updated with the following:
1) A classifier to detect infective pulmonary diseases (tuberculosis, pneumonia, upper respiratory infection). While this thesis does not validate this classifier due to a lack of patients in the dataset with these diseases, the structure has been included for an upcoming study funded by the National Institutes of Health (NIH).
2) A classifier to differentiate between chronic (tuberculosis) and acute (pneu-momnia, URI) infective pulmonary diseases. This classifier is not validated in this
Figure 1-2: New classification scheme. Dotted lines denote classifiers that will be created in the future. Yellow boxes denote additions to the old scheme.
thesis, but the structure has been included for the NIH study.
3) Classifiers to detect interstitial lung disease (ILD) and cancer. These classifiers are not validated in this thesis, but the structure has been included for the NIH study. 4) A classifier to detect AR. Before, unhealthy patients were distinguished as hav-ing either an obstructive pulmonary disease (COPD or asthma) or a non-obstructive pulmonary disease (AR). Then, the patients classified as having an obstructive
dis-that many COPD and asthma patients also have AR. Therefore, in the new classifi-cation scheme, all non-infective patients go through two classifiers: one that checks for AR, and another that checks for COPD/asthma.
This new scheme is summarized in Figure 4-4.
1.5.1
Overview
Chapter 2 summarizes the development of a new classifier which detects allergic rhinitis. First, an unsupervised analysis was done on the full risk factor and symptom questionnaire data to detect if an allergic rhinitis cluster emerged, and if so, what specific questions were useful to diagnose it. Second, a supervised analysis was done in which the new AR classifier was trained and validated. A coefficient analysis for this second portion determined the most important features (questions) from the questionnaire.
Chapter 3 analyzes cough sounds, a potential new feature source for the Mobile Kit. This analysis was done in three parts. First, an unsupervised analysis was done in search of any clusters within the data that corresponded to disease. Second, a supervised analysis was done for various classifiers, including Wet vs. Dry cough. Finally, the supervised analysis was repeated with the classifiers being trained on non-comorbid patients, but tested on both non-comorbid and comorbid patients. This was done under the hypothesis that non-comorbid patients would yield more accurate classifiers.
Chapter 4 analyzes raw Pulmonary Function Testing (PFT) data. We first sum-marize an unsupervised analysis. This was done in search of any inherent clusters, and if they emerged, how they correlated to disease. The second part of Chapter 2
analyzes the performance of data extracted from the PFT machines, both in isola-tion and in combinaisola-tion, when used to train our classifiers. These results were then compared to those of the Mobile Kit.
Chapter 5 summarizes all of the above findings, and suggests future improvements that can be made to the Mobile Kit implemented on a smart phone.
Chapter 2
Diagnosis of Allergic Rhinitis (AR)
Up to now, the Mobile Kit has focused on the diagnosis of COPD and asthma. However, allergic rhinitis is a common disease in developing nations, and oftentimes presents itself as a comorbidity. In this chapter, we address the diagnosis of allergic rhinitis. We begin by conducting an unsupervised analysis of the risk factor and symptom questionnaire (determined to be the most effective tool for the diagnosis of AR). We then integrate the AR classifer within the full diagnostic protocol. We conclude by analyzing an independent AR classifier.
2.1
Data Collection
Data were collected as part of a clinical trial hosted at a pulmonary research hos-pital (Chest Research Foundation) in Pune, India. Aside from the healthy controls, subjects were recruited from an equal sample of all patients arriving at the clinic exhibiting pulmonary symptoms. Table 3.1 shows the distribution of diseases within the dataset. The most common pulmonary diseases exhibited by patients were
res-piratory infections, Asthma, and COPD; this distribution is typical of that found in many developing countries.
All patients underwent our Mobile Kit’s tools, which consisted of a clinical ques-tionnaire, peak flow meter test, and auscultation (lung sounds) from 11 standard sites on the torso administered by a trained pulmonologist. The presence of any abnormal (adventitious) lung sounds at each site were noted manually by the pulmonologist.
Following the use of the mobile phone tools, each patient also underwent pul-monary function testing (PFT), which consisted of spirometry, body plethysmogra-phy, gas diffusion test (DLCO), and impulse oscillometry. Based on the PFT data and the clinical examination, the pulmonologist provided the final disease diagnosis, which was used as our labels for model training.
The protocol for this study received ethics approval from the appropriate boards at the Chest Research Foundation (Pune, India) and the Massachusetts Institute of Technology (Cambridge, USA).
Diagnosis Count No Pulmonary Disease 130
COPD Only 35
Asthma Only 47 Allergic Rhinitis Only 29 COPD + Allergic Rhinitis 11 Asthma + Allergic Rhinitis 56
Total 308
2.2
Feature Extraction
A description of each of the Mobile Kit’s tools (developed and analyzed as part of Daniel Chamberlain’s work), along with an explanation of the features extracted from each, is provided below. All of the extracted features were standardized to have zero-mean and unit-variance.
2.2.1
Risk Factor and Symptom Questionnaire
The Mobile Kit questionnaire was created with the aid of a pulmonologist to obtain details about the onset, duration, and progress of breathlessness, coughing, chest pain, fever, and nasal symptoms in a patient. The questionnaire also captures basic demographic information (age, sex, weight, etc.).
All binary responses were converted to Boolean variables, if they were not Boolean already. For example, the questionnaire asks if a patient is experiencing breathlessness– this question was converted to the feature Breathlessness Flag, True if the patient is breathless and False otherwise.
2.2.2
Peak Flow Meter
The second feature source consisted of five trials of a peak flow meter test. Each result can range from 0 to 800 L/min. Two features were extracted from these trials: 1) the maximum value, and 2) the ratio between the maximum value and the ex-pected value given the patient’s age, sex, and height (using equations 1 and 2 below). We call this feature "Peak Flow Meter Measure Over Reference".
(2) Female: -1.454 *Age (years) + 2.368 * Height (cm)
2.2.3
Lung Sounds
During the 11-site auscultation, the pulmonologist noted the presence of abnormal (adventitious) lung sounds at each site (if any). The pulmonologist labeled the sound heard at each site as: Normal, Wheeze (polyphonic, monophonic), Crepita-tions (coarse, fine), Pleural Rub, or Squeak.
From these labels, 10 features were extracted. They are summarized in Table 2.2 Feature Description
abnormal_sound_flag True if at least 1 abnormal lung sound was noted at any of the 11 sites; False otherwise
num_abnormal_sounds Total number of abnormal lung sounds heard across the 11 sites
wheeze_flag True if at least 1 wheeze was noted at any of the 11 sites; False otherwise
num_wheezes Total number of wheezes heard across the 11 sites crackle_flag True if at least 1 crackle was noted at any of the 11 sites;
False otherwise
num_crackles Total number of crackles heard across the 11 sites num_wheezes_lower Total number of wheezes heard in the lower lungs num_wheezes_upper Total number of wheezes heard in the upper lungs num_crackles_lower Total number of crackles heard in the lower lungs num_crackles_upper Total number of crackles heard in the upper lungs
2.3
Classification Scheme
We updated the diagnostic protocol to account for allergic rhinitis. We did so by in-cluding an AR classifier among two subpopulations: obstructive and non-obstructive patients.
This scheme is summarized in Figure 2-1.
Figure 2-1: New classification scheme. Dotted lines denote classifiers that will be created in the future. Yellow boxes denote additions to the old scheme.
2.4
Ideal Tool for AR Diagnosis
In order to determine the best feature set for the diagnosis of allergic rhinitis, we trained two separate classifiers, one trained on all of the PFT data, and the other trained on all of the Mobile Kit tools. We did so under two scenarios:
1. We assumed the final classifier would be used within the full diagnostic pro-tocol. Therefore, both classifiers had their testing and training sets extracted from patients with pulmonary disease.
2. We assumed the final classifier would be used independently. Therefore, both classifiers had their testing and training sets extracted from patients with and without pulmonary disease.
Tables 2.4 and 2.5 summarize the AR classifiers (under the obstructive and non-obstructive branches of the full diagnostic protocol) under Scenario #1. Table 2.3 summarizes the results of AR classifier under Scenario #2.
Features Used AUC Sensitivity Specificity PFT 0.69 - 0.74 - 0.77 0.50 - 0.71 - 0.86 0.56 - 0.71 - 0.86 Mobile Kit 0.94 - 0.96 - 0.97 0.94 - 0.94 - 1.00 0.87 - 0.89 - 0.92 Table 2.3: Performance of independent AR classifier trained on PFT vs. Mobile Kit
Features Used AUC Sensitivity Specificity PFT 0.65 - 0.69 - 0.73 0.50 - 0.80 - 0.90 0.45 - 0.64 - 0.82 Mobile Kit 0.87 - 0.90 - 0.93 0.85 - 0.92 - 1.00 0.73 - 0.80 - 0.87 Table 2.4: Performance of full diagnostic protocol’s AR classifier (obstructive) trained on PFT vs. Mobile Kit
Features Used AUC Sensitivity Specificity PFT 0.88 - 0.92 - 1.00 0.75 - 1.00 - 1.00 0.67 - 1.00 - 1.00 Mobile Kit 0.81 - 0.87 - 0.93 0.67 - 0.83 - 1.00 0.67 - 0.89 - 0.89 Table 2.5: Performance of full diagnostic protocol’s AR classifier (non-obstructive) trained on PFT vs. Mobile Kitnobs
0.93) result in similar performance under the non-obstructive branch (Table 2.5). However, for the classifier under the obstructive branch (Table 2.4, the Mobile Kit (median AUC: 0.90) has a clear advantage over PFT (median AUC: 0.69).
Additionally, when the classifier is standalone (Scenario #2 above), the Mobile Kit (median AUC: 0.96) has a clear advantage over PFT (median AUC: 0.74). From the supervised learning analysis of cough data, we determined that the questionnaire and the peak flow meter are the most useful tools for determining if a pulmonary disease is obstructive or not. Therefore, for the rest of this analysis, we focus on determining the efficacy of each questionnaire question for allergic rhinitis diagnosis.
2.5
Unsupervised Analysis
We began by running a factor analysis of the full questionnaire to determine the main features (or factors) it captures to determine how a future version of the tool could be shortened. We then ran a k-means cluster analysis on the full questionnaire in search of any clusters that correlated with allergic rhinitis, and if so, what risk factors and symptoms defined it.
2.5.1
Methods
Factor Analysis
Factor analysis assumes independent features. This condition failed, and so 5 fea-tures were removed (red sputum; colorless sputum; fever chills; fever rigors; fever sweating). This was due to a lack of positive examples in the dataset for these fea-tures. Additionally, the few positive examples tended to also be positive for some of the other features, creating a linear dependence.
The 65 features were pre-processed by their z-scores and the full feature space un-derwent the Kaiser-Meyer-Olkin (KMO) test for sampling adequacy, which attempts to determine if it is appropriate to explain the variance in dataset by a small number of factors. Generally, a value greater than 0.60 denotes appropriateness. Our dataset had a KMO score of 0.78.
In order to determine the appropriate number of factors, we used three methods: the Kaiser test, a Cattel scree plot, and an analysis of the cumulative variance. The Kaiser test states that all factors with eigenvalues greater than 1.00 should be kept. In our case, the test recommended we keep 17 factors. It should be noted that while this is a common technique, it has been criticized for overestimating the number of required factors.
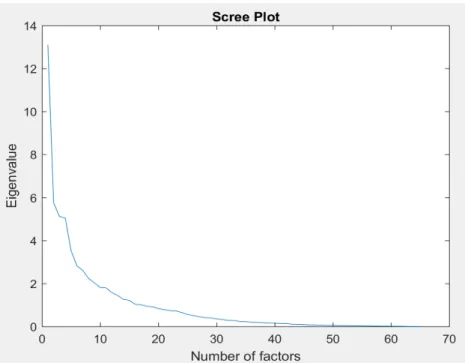
We also used the Cattel Scree plot, which plots the number of features against their eigenvalues. Generally, these plots have a ’kink’, after which point the eigen-values level out. This method suggests the number of factors used is determined by this location. Figure 2-2 shows the scree plot for our data. It suggests using 10 factors. Like the Kaiser test, this method is criticized, specifically for being highly subjective.
Figure 2-2: Cattel Scree plot from factor analysis of questionnaire data
The threshold for how much variance should be explained is research-dependent. Table 2.6 shows the minimum number of factors necessary to explain various amounts of data variance.
Percent of Variance Explained 50 60 70 80 90 95 Minimum Factors Required 5 8 11 16 24 31
Table 2.6: Results of variance test for determining number of factors for factor analysis of questionnaire data
Ultimately, we decided to run a factor analysis with 15 factors. Loadings less than 0.40 were suppressed.
k-Means Analysis
The data were standardized to have zero mean and unit variance. In order to deter-mine the appropriate number of clusters, the mean silhouette score was calculated for cluster sizes ranging from 2 to 20 over 100 trials. The maximum silhouette score (0.21) occurred with 4 clusters.
2.5.2
Results
Factor Analysis
The following features failed to have a loading of at least 0.4 for any of the 15 factors: weight, height, paroxysmal nocturnal dyspnea, yellow sputum, green sputum, weight loss, loss of appetite, headache, somnambulance, family history of COPD, personal history of allergies, and alcohol intake. Of the 15 factors, 6 failed to have at least 3 loadings. The final 9 factors can be described as: Nasal Symptoms, Coughing, Breathlessness, Fever, Sputum Abnormalities, Chest Pain, Tobacco Use, Biomass Cooking, and Throat Symptoms.
K-means
The final k-means cluster analysis ran with 4 clusters. Table 2.7 summarizes the relevant aspects of each cluster. Cluster 1 was defined by a mean age of 62.49 years, and high incidences of chest pain (7.25%), family history of COPD (4.35%), and smoking (37.68%), relative to the other clusters. We initially believed this was indicative of a COPD cluster, given the older age of the group and the percentage of smokers. However, the group had almost even numbers of COPD patients (27.5%),
patients in our dataset were included in this cluster. We ultimately believe that COPD did not arise as a dominant cluster due to a class imbalance; specifically, our dataset had many more patients with asthma and/or allergic rhinitis.
Cluster 2 was defined by low incidences of breathlessness (23.8%) and coughing symptoms (0.0%), relative to the other clusters. 83.5% of this cluster were subjects with no pulmonary disease, which we expected. Cluster 3 was small (5 patients). Interestingly, it captured all of the patients in the dataset with fever. We believe this is an outlier, potentially infectious, cluster. Cluster 4 was defined by high incidences of nasal symptoms (97.32%) and family history of allergies (41.96%). 78.5% of this cluster were patients with allergic rhinitis.
Feature Cluster 1 Cluster 2 Cluster 3 Cluster 4 Age (yrs.) 62.49 41.11 44.20 50.71 Breathlessness (%) 92.8 23.8 80.0 89.3 Cough (%) 100.00 0.00 100.00 83.93 Chest pain (%) 7.25 3.28 40.00 3.57 Fever (%) 0.00 0.00 100.00 0.00 Nasal Symptoms (%) 0.00 2.46 80.00 97.32 Loss of appetite (%) 14.50 4.10 80.00 5.40 Family history of COPD (%) 4.35 0.82 0.00 1.79 Family history of asthma (%) 26.09 23.77 20.00 41.96 Smoke (%) 37.68 12.30 20.00 27.68 Number of Patients 69 122 5 112
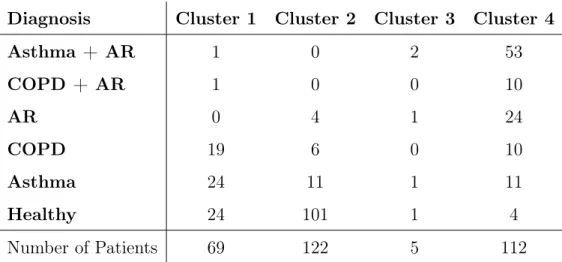
Diagnosis Cluster 1 Cluster 2 Cluster 3 Cluster 4 Asthma + AR 1 0 2 53 COPD + AR 1 0 0 10 AR 0 4 1 24 COPD 19 6 0 10 Asthma 24 11 1 11 Healthy 24 101 1 4 Number of Patients 69 122 5 112
Table 2.8: Disesase composition of clusters from k-means analysis of risk factor and symptom questionnaire
2.5.3
Discussion
The k-means analysis shows clear clusters for subjects without pulmonary disease and patients with allergic rhinitis. A clear COPD cluster potentially did not emerge due to a lack of COPD samples in the data. Future iterations of this analysis should aim to acquire more data to balance the classes out. A clear asthma cluster also did not emerge. Among asthma patients, most appeared in cluster 1 (51%), and the rest appeared evenly between clusters 2 and 3. The confusion between asthma and allergic rhinitis is expected, given they oftentimes go hand-in-hand. Overall, this analysis predicted some pertinent features for diagnosing allergic rhinitis, specifically: age, smoking, family history of allergies, nasal symptoms, coughing, breathlessness, and fever.
Factor analysis provided evidence that it is possible to explain the dataset with 9 latent factors. We predict that a relatively short questionnaire which captures these
2.6
Independent Classifier
2.6.1
Methods
We retrained the independent AR classifier with only the questionnaire to confirm that it was the most useful tool in the Kit. We then performed a coefficient analysis to determine the most useful questions.
2.6.2
Results
Table 2.9 summarizes the results of the AR classifier trained solely on the question-naire data. Figure 2-3 summarizes the classifier’s top coefficients.
Features Used AUC Sensitivity Specificity Questionnaire 0.94 - 0.96 - 0.97 0.95 - 1.00 - 1.00 0.85 - 0.88 - 0.90 Table 2.9: Performance of independent AR classifier trained on the questionnaire
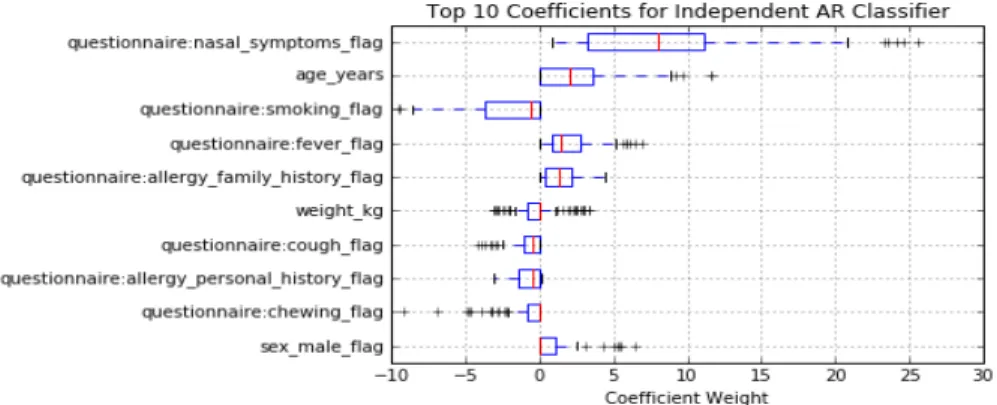
Figure 2-3: Top 10 coefficients of independent AR classifier when utilizing only the questionnaire
2.6.3
Discussion
As shown in Table 2.9, the independent classifier had comparable performance when it was trained with all of the Mobile Kit tools to when it was trained with just the questionnaire data. This further reinforces our previous finding that the question-naire is the most useful feature for AR diagnosis, and an AR-specific questionquestion-naire would be the ideal tool within the Mobile Kit.
The coefficient analysis (Figure 2-3) aligns with the findings from the unsuper-vised analysis. The most important features were determined to be Nasal Symptoms, Age, Smoking, Fever, and Family History of Allergy. This suggests that a very short questionnaire which captures these data may accurately diagnose allergic rhinitis.
2.7
Integration of AR Classification into Full
Diag-nostic Protocol
2.7.1
Methods
We restructured the old classification scheme by introducing allergic rhinitis classi-fiers. These are found under the Obstructive vs. Non-obstructive Pulmonary Disease branch; one handles patients labeled as having obstructive disease, while the other handles patients labeled as having a non-obstructive disease.
2.7.2
Results
Table 2.15 shows the results of the AR classifier under the obstructive branch. Table 2.13 shows the results of the AR classifier under the non-obstructive branch. For
testing the other classifiers in the new diagnostic protocol. They are summarized in Tables 2.10, 2.11, 2.12, and 2.14.
Features Set(s) AUC Sensitivity Specificity L 0.61 - 0.63 - 0.66 0.22 - 0.27 - 0.31 1.00 - 1.00 - 1.00 Q 0.97 - 0.98 - 0.99 0.91 - 0.93 - 0.98 0.94 - 1.00 - 1.00 P 0.83 - 0.86 - 0.88 0.55 - 0.70 - 0.80 0.81 - 0.94 - 1.00 Q + P 0.97 - 0.98 - 0.99 0.90 - 0.92 - 0.95 1.00 - 1.00 - 1.00 Q + L 0.98 - 0.99 - 0.99 0.91 - 0.95 - 0.98 1.00 - 1.00 - 1.00 P + L 0.85 - 0.88 - 0.90 0.60 - 0.68 - 0.78 0.88 - 0.94 - 1.00 Q + P + L 0.97 - 0.98 - 0.99 0.90 - 0.92 - 0.95 1.00 - 1.00 - 1.00 Table 2.10: Performance of Healthy vs. Unhealthy classifier utilizing different Mobile Kit feature set combinations under the new classification scheme
2.7.3
Discussion
For the AR classifier handling patients with obstructive disease (Table 2.15), the questionnaire (median AUC: 0.91) greatly outperforms lung sounds (median AUC: 0.59) and the peak flow meter (median AUC: 0.68). While the questionnaire achieves the best specificity of any combination of feature sets, it is not ideal (median speci-ficity: 0.82) and has a large interquartile range (17%).
For the AR classifier handling patients with non-obstructive disease (Table 2.13), both the questionnaire and peak flow meter have comparable performance (for both, median AUC: 0.91). However, the questionnaire outperforms the peak flow meter in sensitivity (median sensitivity of 0.86, compared to 0.83 for the peak flow meter) and specificity (median specificity of 0.90, compared to 0.89 for the peak flow meter).
Features Set(s) AUC Sensitivity Specificity L 0.60 - 0.65 - 0.68 0.23 - 0.26 - 0.39 0.83 - 1.00 - 1.00 Q 0.87 - 0.89 - 0.92 0.60 - 0.77 - 0.90 0.83 - 0.83 - 1.00 P 0.88 - 0.91 - 0.95 0.71 - 0.79 - 0.89 0.80 - 1.00 - 1.00 Q + P 0.92 - 0.96 - 0.98 0.79 - 0.86 - 0.96 0.80 - 1.00 - 1.00 Q + L 0.90 - 0.94 - 0.96 0.68 - 0.81 - 0.90 0.83 - 1.00 - 1.00 P + L 0.88 - 0.93 - 0.96 0.71 - 0.82 - 0.89 0.80 - 1.00 - 1.00 Q + P + L 0.94 - 0.96 - 0.98 0.81 - 0.89 - 0.93 0.95 - 1.00 - 1.00 Table 2.11: Performance of Obstructive vs. Non-obstructive classifier utilizing dif-ferent Mobile Kit feature set combinations under the new classification scheme
It is clear from the performance of these two classifiers that the questionnaire is the best Mobile Kit tool for detecting allergic rhinitis. However, a lower-than-ideal specificity, coupled with any error carrying over from higher branches, will decrease performace of the new diagnostic protocol when used in the field. Therefore, it is recommended that an independent classifier be used for the detection of allergic rhinitis, based on relevant questionnaire questions. The restructuring of the full diagnostic protocol to one of multiple, independent, and disease-specific classifiers is explored in the PFT analysis chapter.
Features Set(s) AUC Sensitivity Specificity L 0.56 - 0.63 - 0.66 0.83 - 0.92 - 1.00 0.25 - 0.38 - 0.63 Q 0.96 - 1.00 - 1.00 1.00 - 1.00 - 1.00 0.86 - 1.00 - 1.00 P 0.73 - 0.81 - 0.87 0.60 - 0.80 - 1.00 0.68 - 0.71 - 0.86 Q + P 0.98 - 1.00 - 1.00 1.00 - 1.00 - 1.00 0.96 - 1.00 - 1.00 Q + L 0.95 - 1.00 - 1.00 1.00 - 1.00 - 1.00 0.86 - 1.00 - 1.00 P + L 0.76 - 0.83 - 0.89 0.65 - 0.90 - 1.00 0.57 - 0.71 - 0.86 Q + P + L 1.00 - 1.00 - 1.00 1.00 - 1.00 - 1.00 1.00 - 1.00 - 1.00 Table 2.12: Performance of Pure COPD vs. Pure Asthma classifier utilizing different Mobile Kit feature set combinations under the new classification scheme
Features Set(s) AUC Sensitivity Specificity L 0.58 - 0.60 - 0.65 0.29 - 0.43 - 0.86 0.33 - 0.90 - 1.00 Q 0.86 - 0.91 - 0.95 0.71 - 0.86 - 1.00 0.79 - 0.90 - 1.00 P 0.86 - 0.91 - 0.96 0.79 - 0.83 - 1.00 0.78 - 0.89 - 0.89 Q + P 0.83 - 0.88 - 0.93 0.67 - 0.83 - 1.00 0.67 - 0.78 - 0.89 Q + L 0.84 - 0.90 - 0.94 0.71 - 0.86 - 0.86 0.79 - 0.89 - 0.90 P + L 0.85 - 0.89 - 0.94 0.67 - 0.83 - 1.00 0.78 - 0.89 - 0.89 Q + P + L 0.81 - 0.87 - 0.93 0.67 - 0.83 - 1.0 0.67 - 0.89 - 0.89 Table 2.13: Performance of AR classifier (non-obstructive) utilizing different Mobile Kit feature set combinations under the new classification scheme
Features Set(s) AUC Sensitivity Specificity L 0.67 - 0.70 - 0.77 0.33 - 0.58 - 0.67 0.73 - 1.00 - 1.00 Q 0.91 - 0.93 - 0.97 1.00 - 1.00 - 1.00 0.73 - 0.82 - 0.91 P 0.77 - 0.82 - 0.91 0.50 - 1.00 - 1.00 0.55 - 0.73 - 1.00 Q + P 0.90 - 0.94 - 0.98 1.00 - 1.00 - 1.00 0.73 - 0.82 - 0.91 Q + L 0.89 - 0.93 - 0.97 1.00 - 1.00 - 1.00 0.73 - 0.82 - 0.91 P + L 0.64 - 0.67 - 0.70 0.54 - 0.77 - 0.92 0.40 - 0.53 - 0.75 Q + P + L 0.86 - 0.93 - 0.95 1.00 - 1.00 - 1.00 0.72 - 0.82 - 0.91 Table 2.14: Performance of COPD vs. Asthma (comorbid) classifier utilizing different Mobile Kit feature set combinations under the new classification scheme
Features Set(s) AUC Sensitivity Specificity L 0.55 - 0.59 - 0.64 0.21 - 0.39 - 1.00 0.24 - 0.82 - 0.96 Q 0.87 - 0.91 - 0.94 0.86 - 0.93 - 1.00 0.71 - 0.82 - 0.88 P 0.65 - 0.68 - 0.72 0.62 - 0.77 - 0.92 0.40 - 0.53 - 0.68 Q + P 0.89 - 0.92 - 0.95 0.85 - 0.92 - 1.00 0.73 - 0.80 - 0.87 Q + L 0.87 - 0.90 - 0.93 0.86 - 0.93 - 1.00 0.71 - 0.81 - 0.88 P + L 0.64 - 0.67 - 0.70 0.54 - 0.77 - 0.92 0.40 - 0.53 - 0.75 Q + P + L 0.87 - 0.90 - 0.93 0.85 - 0.92 - 1.00 0.73 - 0.80 - 0.87 Table 2.15: Performance of AR classifier (obstructive) utilizing different Mobile Kit feature set combinations under the new classification scheme
Chapter 3
Use of Cough Sounds for Screening
and Diagnosis of Pulmonary Disease
In this chapter, we analyze the screening and diagnostic value of adding cough sound analysis to the Mobile Kit. We do so in four parts. First, we summarize an ex-ploratory analysis involving unsupervised learning to detect any inherent clusters that map cough sound features to disease. Second, we analyze the value of coughs in isolation via a supervised learning approach, first to discern between wet and dry coughs, and then to discern between various levels of pulmonary disease screening and diagnosis. Third, we integrate cough sounds with the other Mobile Kit tools (questionnaire, peak flow meter, and lung sounds) to analyze the use of coughs as an additional feature. Finally, we extend the supervised learning analysis by training the classifiers with non-comorbid patients, and seeing if there are any improvements when compared to the classifier trained on both comorbid and non-comorbid patients.
3.1
Motivation
Cough is one of the earliest symptoms of many pulmonary diseases. It is also very simple to record, not requiring any special tools. Whereas the recording of lung sounds in the current Mobile Kit requires the use of an electronic stethoscope, coughs can be recorded directly with the phone. This can be of use in resource-lacking areas where the use of our current kit’s peripherals (like the peak flow meter or the stethoscope) might be too costly, or too difficult (for example, a very young child might have trouble completing the peak flow meter test).
A cough is generally categorized as wet or dry. However, these categories are highly subjective, with wet coughs tending to be characterized by the presence of phlegm, and dry coughs characterized by the lack of phlegm. Given the subjectiv-ity of classification, it is very enticing for pulmonologists to have a tool that can accurately (and automatically) classify coughs.
Knowing whether a cough is wet or dry can give some insight into a patient’s pulmonary health. For example, a wet cough can indicate conditions like lower respiratory tract infections, pneumonia, and bronchitis, while dry coughs can indicate conditions like allergies and asthma. Recent work on cough analysis has primarily focused on naturally occurring involuntary coughs. This form of data collection requires continuous recording, often over many hours, to ensure a sufficient number of coughs are collected [33, 34]. However, for the purpose of a screening tool, it is more relevant to study voluntary coughs that can be readily acquired. Many groups who are trying to create a diagnostic tool using voluntary coughs are extending on
3.1.1
Previous Work
Aside from wet/dry classification, there are three main areas of research within the cough community:
Segmentation
Cough segmentation involves the automatic extraction of individual coughs from a recording containing multiple coughs. Many studies involving cough sounds manually segment coughs. However, for use in final products, automatic segmentation methods are required. Much of the recent work in cough segmentation involves complex, computationally-intensive models, such as neural networks.
Detection
Cough detection involves the automatic classification of a sound as a cough. This is of great interest to the smart home community, especially with the growing work being done in telemedicine. The general application within this context is to continuously record sound and be able to detect when a user coughs. Just like cough segmentation, many of the recent approaches are computationally expensive. However, this process is not a requirement for our Mobile Kit.
Analysis
Cough analysis involves a combination of signal analysis and machine learning. Much of the work done in this area involves: a) extracting relevant time- and frequency-domain features from cough signals, and b) creating machine learning classifiers to
screen for various pulmonary disease (asthma, COPD, allergic rhinitis, pneumonia, etc.).
3.2
Data Collection
Cough recordings (30 seconds in length) were captured from each patient at the trachea, during which time patients were asked to cough multiple times. Each indi-vidual cough used for training was also labeled as Wet (containing phlegm) or Dry (not containing phlegm). Since cough sound data were only available for a portion of the patients in our study, we used a sample of a larger data set which was used for our larger diagnostic study. The disease distribution within the dataset is shown in Table 3.1. Summary statistics are shown in Table 3.2.
Diagnosis Count No Pulmonary Disease 33
COPD Only 7
Asthma Only 15 Allergic Rhinitis Only 11 COPD + Allergic Rhinitis 4 Asthma + Allergic Rhinitis 17
Total 87
Statistic Value Statistic Value Male (%) 52.05 Family History of COPD
(%) 0.00
Age (years) 46.34 Family History of Allergies
(%) 32.88
Weight (kg) 61.38 Personal History of
Aller-gies (%) 15.07
Breathless (%) 58.90 Exposed to Biomass
Cook-ing (%) 13.70
Coughing (%) 42.47 Smoke (%) 19.18 Chest Pain (%) 42.47 Chew Tobacco (%) 26.03 Fever (%) 1.37 Consume Alcohol (%) 9.59 Nasal Symptoms (%) 35.62 Max Peak Flow Meter
Reading (L/min) 296.71 Table 3.2: Summary statistics of the cough analysis dataset
3.3
Data Preprocessing
From each cough sound recording, the first complete cough (defined as having 100 milliseconds of silence before and after the cough event) was extracted manually using the Audacity software. For some patients, it was impossible to detect a single, distinct cough (usually due to uncontrollable coughing episodes common in COPD or asthma patients). These patients were discarded from the analysis.
Figure 3-1 shows a sample signal of a full recording lasting 30 seconds, containing seven complete coughs; Figure 3-3 shows the extracted cough signal.
3.4
Cough Feature Selection
3.4.1
Segmentation
The first step in cough analysis is to find the presence of a cough within the recorded sound file. We implemented a cough segmentation algorithm which extracts the first complete cough in a recording using the following algorithm:
1. The original sound file (Figure 3-1) is smoothed by applying local regression (weighted least squares with a 2nd degree polynomial model) using a span of 2% of the data. The signal is then normalized to span from 0 to 1. Figure 3-1 shows an example of a complete recording. Figure 3-2 shows the smoothed signal.
2. A peak detection algorithm is applied to the smoothed signal (Figure 3-2) to find all cough peaks present in the file.
3. In order to select the first complete cough in the series, each peak is analyzed individually. The zero-crossing of the first derivative is used to determine the starting point of the cough, and the slope of the trailing edge of the cough is used to determine the end of the cough.
4. The flatness of the slope is used as a criterion to determine if the cough segment is complete. If the algorithm encounters a new peak before the previous cough sound has settled (defined as the slope being below a pre-determined threshold), then the algorithm discards the current cough segment and starts a new search using the next available cough peak.
3.4.2
Feature Extraction
Figure 3-1: Sample sound file showing raw cough data extracted cough signal from the original signal (Figure 3-1).
Starting from an initial set of approximately 30 features published in the litera-ture, we selected features which have been previously used for diagnostic prediction and also gave good results on initial trials. They are summarized in Table 3.3.
3.5
Classification
3.5.1
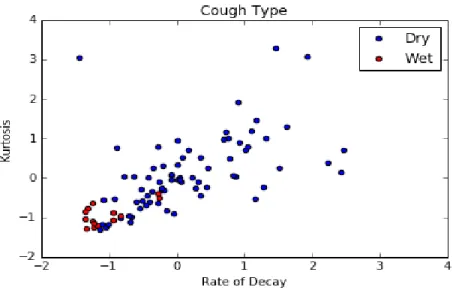
Wet vs. Dry Cough
The first classification we performed with the cough data was to discern between wet (containing phlegm) and dry (not containing phlegm) coughs.
3.5.2
Pulmonary Health and Disease
Given the fact that much of the data had to be removed due to the inability to extract a single valid cough from patients’ cough recordings, we followed the classification
Figure 3-2: Smoothed cough signal magnitude and detected peaks (circled)
scheme used in Daniel Chamberlain’s work. It is a tree-like structure composed of three layers. The first layer determines whether a patient has a pulmonary disease or not (Respiratory vs. Non-Respiratory, or Unhealthy vs. Healthy). Respiratory patients then go through the next layer of classification which determines whether they have an Obstructive or Non-obstructive pulmonary disease. Obstructive pa-tients then go through the final layer, which determines whether they have COPD or asthma. For this analysis, at any given layer, we assume perfect classification from the previous layer, if applicable. For example, we assume that the Obstructive clas-sifier is perfect, and only train the COPD vs. Asthma clasclas-sifier on patients known to have Obstructive pulmonary disease.
Figure 3-3: Plot of extract cough segment (blue); computed upper envelope (red); exponential fit (green)
3.6
Unsupervised Analysis
3.6.1
Methods
In order to explore any potential hidden correlations between cough features and disease, we performed a standard k-means clustering analysis. The ideal number of clusters was determined to be three (by averaging the silhouette score over a range of cluster sizes from two to ten, over 100 trials).
3.6.2
Results
The results of the cluster analysis are shown in Table 3.4. Table 3.5 show the average feature values (normalized) within each cluster.
Feature Description
Kurtosis
The fourth-order moment of the signal, computed from the magnitude, |x(t)|, which is a measure of its "Gaussianity". This feature has been used to automatically detect pertus-sis (whooping cough). [24]
Variance The variance of the signal’s magnitude. This feature has been used to detect abnormal pulmonary function. [20] Zero cross irregularity
A measure of the deviation between time intervals in which the cough signal crossed the x-axis. This measure has been used in previous analyses to detect wheezes. [15]
Rate of decay
The exponent value of an exponential curve fitted to the magnitude of the cough signal, |x(t)|: Figure 3-3 shows the computed upper envelope and the fitted curve for the automatically extracted cough described above.
Table 3.3: Description of extracted cough sound features
Diagnosis Cluster 1 Cluster 2 Cluster 3
Asthma 7 0 5
Asthma + Allergic Rhinitis 4 4 7
Allergic Rhinitis 4 3 4
COPD 1 1 4
COPD + Allergic Rhinitis 0 2 2
Healthy 13 1 17
Total 29 11 39
Figure 3-4: Classification scheme used in cough sound analysis
3.6.3
Discussion
While other types of clustering analysis are possible, the results from our simple k-means cluster analysis shown in Table 3.4 and Table 3.5 do not reveal any clear clusters in this set of features that map to disease diagnosis.
However, there are some results worth noting. Cluster 1 contained relatively few instances of COPD patients. This might indicate two difficulties: 1) differentiating patients with asthma from those with allergic rhinitis (since they appear in equal quantities in this cluster), and 2) differentiating asthma/allergic rhinitis patients from healthy patients. Additionally, the two features defining this cluster were Rate
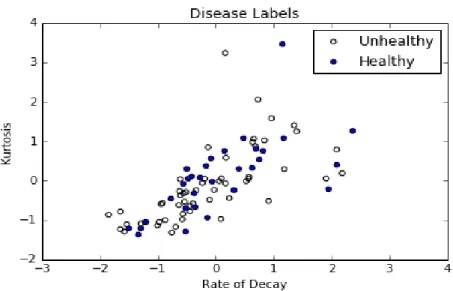
Feature Cluster 1 Cluster 2 Cluster 3 Rate of Decay 1.01 -0.47 -1.01 Zero Crossing Irregularity -0.06 0.08 -0.12 Variance -0.33 -0.35 2.12 Kurtosis 1.00 -0.49 -0.91 Number of Patients 29 11 39
Table 3.5: Summary of normalized feature values from k-means cluster analysis of Decay and Kurtosis. Figure 3-5 illustrates the difficulty of determining pulmonary health when using these two features.
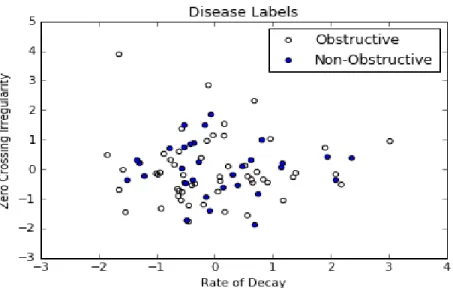
Cluster 2, though containing the smallest quantity of patients, is mostly composed of asthma and allergic rhinitis patients. When analyzing the average feature values for this cluster, we noted that the main difference came from the Zero Crossing Irregularity feature. Figure 3-6 shows the difficulty of detecting Obstructive vs. Non-obstructive pulmonary disease when using Zero Cross Irregularity and Rate of Decay.
Cluster 3 had many examples of all disease types, and no clear insight can be gained from it.
3.7
Supervised Analysis (Trained with Non-Comorbid
and Comorbid Patients)
3.7.1
Methods
All of the cough features were treated as continuous variables and standardized to have zero-mean and unit-variance. Logistic regression models with L1-penalty were