HAL Id: hal-02268410
https://hal.archives-ouvertes.fr/hal-02268410
Submitted on 3 Aug 2020
HAL is a multi-disciplinary open access
archive for the deposit and dissemination of
sci-entific research documents, whether they are
pub-lished or not. The documents may come from
teaching and research institutions in France or
abroad, or from public or private research centers.
L’archive ouverte pluridisciplinaire HAL, est
destinée au dépôt et à la diffusion de documents
scientifiques de niveau recherche, publiés ou non,
émanant des établissements d’enseignement et de
recherche français ou étrangers, des laboratoires
publics ou privés.
sheep-meat farms does not fully fit with the meat
industry demands
Marc Benoit, Rodolphe Sabatier, Jacques Lasseur, Philip Creighton, Bertrand
Dumont
To cite this version:
Marc Benoit, Rodolphe Sabatier, Jacques Lasseur, Philip Creighton, Bertrand Dumont. Optimising
economic and environmental performances of sheep-meat farms does not fully fit with the meat
indus-try demands. Agronomy for Sustainable Development, Springer Verlag/EDP Sciences/INRA, 2019,
39 (4), pp.40. �10.1007/s13593-019-0588-9�. �hal-02268410�
RESEARCH ARTICLE
Optimising economic and environmental performances
of sheep-meat farms does not fully fit with the meat
industry demands
Marc Benoit1 &Rodolphe Sabatier2&Jacques Lasseur3&Philip Creighton4&Bertrand Dumont1
Accepted: 4 July 2019 / Published online: 31 July 2019
# INRA and Springer-Verlag France SAS, part of Springer Nature 2019
Abstract
Ruminant farming systems are questioned for their contribution to climate change and feed-food competition. Here, we analyse the economic and environmental performances of five sheep farming systems optimised in terms of ewe productivity and feeding costs. Systems are located in contrasting biogeographical areas along a gradient of decreasing agronomic potential from Ireland to the French Mediterranean rangelands. Applying a mechanistic model of flock and farm operation management to evaluate these five systems made it possible to highlight trade-offs between their economic performance under standardised economic conditions, environmental performances, and feed-food competi-tion, but also discrepancies between sheep farm strategy and meat industry demands. Different management strategies resulted in ewe productivity ranging from 0.82 to 1.66 lambs ewe−1year−1between farming systems and concentrate use from 0 to 148 kg ewe−1year−1. The two systems relying the most on grassland and rangelands show the best economic and environmental performances while minimising feed-food competition. This results from a good match between animal feed requirements and forage availability; these systems, however, generate a high seasonality of production that does not meet the industry demand for a regular meat supply throughout the year. The Irish system also follows a forage autonomy strategy, but with poorer environmental and economic performance due to intensification, higher price of land, and lower meat price. Both the accelerated reproduction system with three lambing periods in two years and the organic system generate a more regular lamb supply, but require a higher level of concentrate feed, which negatively affects performances. These results highlight for the first time that optimising economic and environmental performances at farm level does not fully fit with the meat industry demand for a regular lamb meat supply throughout the year and lamb conformation. Low-productivity but fully self-sufficient fodder livestock systems can achieve excellent economic performance, but require both specific skills and marketing adequacy.
Keywords Ruminants . Farming system . Feed-food competition . Modelling . Trade-offs . Agroecology . Organic farming . Pastoralism
1 Introduction
European sheep farming has faced several difficult decades despite support for production via European subsidies. This is the result of a conjunction of three factors (European Parliament2008; Rossi2017): (i) cheap sheep-meat imports from Australia and New Zealand put strong competitive pres-sure on local production systems during the 1990s and early 2000s, (ii) sheep farming is labour intensive and among the less remunerative agricultural activities, which often discour-aged sheep farming, (iii) the Common Agricultural Policy
* Marc Benoit marc-p.benoit@inra.fr
1
Université Clermont Auvergne, INRA, VetAgro Sup, UMR Herbivores, F-63122 Saint-Genès-Champanelle, France 2 INRA UR 767 Ecodeveloppement, F-84000 Avignon, France 3
INRA UMR Selmet, F-34000 Montpellier, France 4
Teagasc, Mellows Campus, Athenry, Co. Galway H65 R718, Ireland
(CAP) largely focussed on cropping systems from 1992 to 2010. From 2010, two processes combined in offsetting pres-sure on low sheep-meat prices: (i) the drop in European pro-duction that was initiated by the 2001 foot-and-mouth disease crisis in Great Britain and (ii) a decline in sheep production in New Zealand. As a consequence, sheep-meat prices have been relatively high and stable since 2010 in Europe. However, the production is still declining in most European countries (OECD2015). Indeed, the profitability of sheep farms can remain low because of high production costs, mainly associ-ated with animal feeding. Sheep farmer’s working conditions are moreover still considered to be demanding.
A specificity of sheep farming is the wide diversity of pro-duction systems (Ripoll-Bosch et al.2014; O’Rourke et al. 2016). Given ewe reproductive specificities (short gestation period, prolificacy from 100 to 250% according to breed) and with accelerated breeding programmes, ewe productivity was shown to vary from 0.50 to 2.50 lambs per ewe per year across French sheep-meat farms (Benoit and Laignel2011), which corresponds to a potential production of 8 to 50 kg of lamb carcass. In addition, feeding strategies are extremely variable, ranging from a large amount of concentrates used to situations where only forage resources are used. The wide range of ewe productivity and concentrate consumption levels make these two variables key drivers of economic and envi-ronmental performance as greenhouse gas (GHG) emissions and non-renewable energy consumption (Benoit and Laignel
2011). Sheep production is present across a very wide range of bioclimatic and grazing land conditions in Europe, from pro-ductive lowland areas to dry pastoral areas in Mediterranean regions (Rossi2017). A number of sheep breeds have proven to be very well adapted to this diversity of production and environmental conditions.
Livestock production is often blamed for its role in global warming and for its relative inefficient protein conversion into animal products. When partly fed on cereal crops, herbivores also compete with human food from arable lands. However, when fed on grasslands and with by-products from human food that are inedible by humans, herbivores have a high efficiency of conversion to human-edible proteins (Ertl et al.
2015). Beyond production, herbivore farming systems also provide a wide range of services including regulatory and cultural services, so-called bundles of services vary according to livestock management, with a key effect of stocking density and proportion of forages in the diet (Dumont et al.2019). Ecosystem services are assumed to be both enhanced and valued in agroecological livestock production systems (Dumont et al.2018), in particular those making the best use of local resources.
In this article, we compare the technical, economic, and environmental performance of five contrasting sheep farming systems. Each of them are optimised for forage autonomy according to local environmental conditions. Our hypothesis
is that under highly contrasting conditions from an agronomic point of view, there is variability in management conditions that optimise farm multi-performance (Fig.1). Applying a modelling framework to the evaluation of these five systems made it possible to highlight (i) relationships between re-source characteristics and farmers’ strategy, (ii) the specific-ities and multi-performance of these contrasting farming sys-tems, and (iii) trade-offs between economic and environmen-tal performances, but also discrepancies between sheep farm performance and meat industry demands.
2 Materials and methods
2.1 Choice of five efficient farms
A preliminary analysis of a database of 1462 farm years (Benoit and Laignel2011) based on 118 farms, each surveyed on average over 12 years, shows the high variability of two key economic indicators: ewe productivity and concentrate feed requirements. These two variables are good proxies for farm efficiency. Indeed, concentrate feed is the main produc-tion cost for sheep farming, representing on average 64% of the operational costs in this group of farms. Ewe productivity is the most correlated indicator to gross margin per ewe, which is the most correlated indicator to farm net income (Benoit and Laignel 2011). This leads us to consider that the ratio
Fig. 1 Various forage-based strategies and sheep breeds to adapt to the diversity of local context in search of high performances. Pictures represent lowland and upland areas. (Pictures M.Benoit)
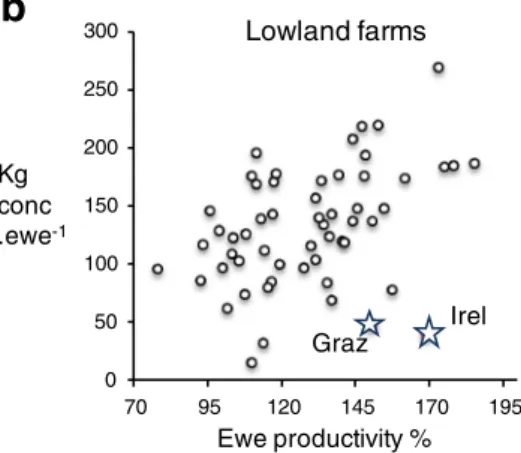
[Quantity of concentrates per ewe]/[Ewe productivity] is a key determinant of flock efficiency from a technical and economic point of view. Figure2illustrates the wide variability of con-centrate feed use among farms. It also shows the balance be-tween the two key criteria across the whole network of 118 farms distributed in either uplands or lowlands.
Among the 118 farms, we selected the five farms in which the lowest amount of concentrate feed was needed for a given ewe productivity level, that is to say the farms with a very high level of fodder self-sufficiency, along various levels of ewe productivity. For example, according to Fig.2, the farms rep-resented by stars calledOF and Graz have a numerical pro-ductivity of approximately 150% and a concentrate feed con-sumption of 85 kg and 48 kg per ewe per year, respectively. They thus outperform other farms from the same areas experiencing the same level of ewe productivity but with a concentrate feed consumption around 150 kg per ewe per year.
We notice that the five farms are located on a gradient of decreasing agronomic potential, from Ireland (Irel: humid oceanic conditions) to four French production areas: the west-ern lowlands (Graz, grazing farm), the Massif central uplands (accelerated reproduction system with three lambings every 2 years3x2, and organic farming OF), and the Mediterranean rangelands (very mobile, dual transhumant,DT). Three farms (3x2, Graz, OF) came from the previous database (Benoit and Laignel2011); the two others (DT) (Vigan et al.2017) andIrel (Earle et al.2017) were selected in order to extend the biogeo-graphical conditions and to better match the reality of European forage-based sheep production systems. In both up-lands and lowup-lands, there are disparities between farms (Benoit and Laignel2011) (Fig.2), but our goal was to assess the multi-performance of farms adapted to their biophysical environment rather than to describe sheep-meat farm perfor-mance within and across areas. The pedoclimatic conditions
of the five farms studied do not differ from those of the other farms in their region. Table 1 summarises the pedoclimatic context of the five farms, the assets and constraints they face, and farmer management strategies. The analysis was conduct-ed over 3 to 5 years in order to buffer variability in animal reproduction performance and climatic hazards.
2.2 Choice of performance indicators
We selected 23 variables to describe farm structure, flock management and technical performance, farm economic and environmental performance, and feed-food competi-tion. These indicators, presented in Table2, allow ten key indicators for assessing farm multi-performance to be calculated.
A first set of three indicators relates to technical perfor-mance: ewe productivity, consumption of concentrates, and feed self-sufficiency. Ewe productivity and consumption of concentrates are indeed major determinants of sheep farm profitability (Benoit and Laignel 2011; Bellet and Ferrand
2014), while feed self-sufficiency is a direct indicator of farm autonomy. Feed self-sufficiency was calculated as the share of the flock energy requirements met from farm resources (fod-der and crops) (Benoit and Laignel 2006). As none of the farms produced crops that were used to feed the animals, feed self-sufficiency highly depended on the efficiency of forage utilisation and on the quantity of concentrate feed offered per ewe and per year.
Three economic indicators were calculated. We assessed farm profitability from added value per total worker that is derived from the net income, i.e. gross product minus total production costs. We opted for added value as it does not account for subsidies, nor for wages and social costs, taxes, amortisation, and financial expenses. Added value thus re-veals the ability of the farm to produce sheep-meat with the
0 50 100 150 200 250 300 70 95 120 145 170 195 Ewe productivity % 3x2 DT OF Upland farms
a
Kg conc .ewe-1 0 50 100 150 200 250 300 70 95 120 145 170 195 Ewe productivity % Graz Irel Lowland farmsb
Kg conc .ewe-1Fig. 2 Position of 118 sheep farms (one point representing on average 12-year monitoring) for concentrate feed requirements per ewe per 12-year relative to ewe annual productivity, i.e. a proxy of concentrate feed use efficiency. The five farms studied are represented by stars. On the left (a): farms in North Massif Central, withOF for Organic Farming and 3x2 for
accelerated reproduction system, and rangeland farm in Provence with DT for Dual Transhumant system. On the right (b): pasture based farms from lowlands, in France South Vienne withGraz for Grazing system and in Ireland withIrel system
minimum of physical inputs (in particular concentrate feed, fertilisers, fuel), and so with the maximum utilisation of on-farm resources. In order to understand the drivers of on-farm profitability, we calculated two other widely used indicators (Benoit and Laignel2011; Ripoll-Bosch et al.2014): Gross margin per ewe reveals ewe production level reached with a minimum of inputs and structural cost per Equivalent Livestock unit acounts for mechanisation costs, housing facil-ities, management, financial, and wage costs. As stocking rate could be very different across farms, we did not compare structural cost per ha, and rather calculated it per Equivalent Livestock Unit, defined as the sum of Livestock Unit and ha of arable land (Benoit and Laignel2006). This can be done as structural costs per ha are similar between arable and fodder areas in our database of 1462 farm years, with a stocking rate averaging 1 LU ha−1. All these economic indicators are cal-culated for a full production year.
Feed-food competition was assessed by an indicator that ac-counts for ewe and lamb feeding resources with regard to the use of human-edible resources (Wilkinson 2011; Ertl et al.2015; Mottet et al. 2017). We used the Efficiency of Conversion of Edible Proteins by Human (ECCPH) defined as [Proteins sup-plied (meat, offal) consumable by humans/proteins consumed by the animals which were also human-edible] × 100.
Farm environmental impacts are assessed through three key indicators: GHG emissions, non-renewable energy consumption, and N balance at the farm scale. Contribution to global warming is assessed through GHG emissions calculated as gross emis-sions minus carbon sequestration in the soil. Carbon sequestra-tion in grasslands was calculated from Dollé et al. (2013). Greenhouse gas emissions and non-renewable energy (NRE) consumption are expressed per kg of carcass produced after al-location of the share of GHG or NRE corresponding to wool production, on a protein content basis. Greenhouse gas emissions
Table 1 Context of the five farms studied, assets and constraints, strategies implemented to optimise farm performances, and consequences on lamb selling. Systems are ranked from lowland (Irel for Irish system andGraz for Grazing system) to upland areas (3x2 for
accelerated reproduction system andOF for Organic Farming) and pastoral Mediterranean conditions (DT for Dual Transhumant farming system)
Farms Irel Graz 3x2 OF DT
Pedo-climatic context
Oceanic climate Unfavorised lowlands Continental climate Short winter Dry summer
Massif central uplands Continental climate Altitude 800 m Volcanic soil
Massif central uplands Continental climate Altitude 800 m Granitic soil
Mountain and pastoral areas in Alpine pastures, Provence hills and lowlands Mediterranean and Alpine climate Farming
system
Intensive use of pastures in a farmlet experiment
Grassland-based Intensive reproduction (3 lambings every 2 years) Grassland-based organic system Traditional dual transhumance (Royer 1988). Very low stocking rate. Harsh conditions. Very low inputs use Ref. years 2013–2014–2015 1992–1993–1994 2004–2005–2006–2007 2014–2015–2016 2013–2014–2015 Strengths Favourable area
(oceanic climate) with regular grass growth. Ploughable area (temporary pastures) Cheap land renting
Fertile soils. High quality forages for stocks (silage) High lamb price
in winter
Higher price of organic lamb meat
Large range of altitude (0 to 2500 m asl) Marketing to Muslims
(6–15 months badly conformed lambs). Constraints Expensive price
of land.
Summer drought Six months indoor. Few land available.
Low grassland productivity
Very low rangeland productivity and stocking rate. Wolf predation. Solution One lambing (end of
winter) Grass fattened lambs with high meat production per ha and ewe productivity. High N fertilisation and low forage stocks. Belclare breed.
One lambing (end winter). Grass fattened lambs. No N fertilisation. All year grazing. Mouton Vendéen
and Texel breeds.
High ewe productivity (accelerated reproduction without hormones use) Concentrate fattened
lambs Productive and rustic breed (Rava) crossed with “meat breed”. Reproduction: 2/3 spring lambings (lambs fattened on grass); 1/3 autumn lambongs Full year grazing for a part of the flock.
Optimisation of forage used. Limousine breed.
Two lambing periods (March–October). Large pastoral areas, with 500 ha of vineyards in winter. 6 weeks spring transhumance (200 km). No buildings nor stocks. Rustic, low prolificacy
breed, Mourerous Lamb selling Seasonal: July to
October
Seasonal: mainly July to November
Nearly all the year round
From February to November
Seasonal: August to November for males. Early selling for female
and NRE values were calculated from the Life Cycle Assessment methodology used in the French Dia’Terre tool based on the Gestim model (Gac et al.2011). Methane is the main component of GHG emissions; methane emissions by the animals were cal-culated from Vermorel et al. (2008) according to estimated daily intake of forages, concentrate feed, and animal metabolic weight. We also calculated nitrogen balance at farm scale according to the Economic Input:Output (EIO) budget, which accounts for purchases and sales of nitrogen over the farm gate without ac-counting for N symbiotic fixation (Watson and Atkinson1999). Positive nitrogen balance reveals a risk for N leaching.
2.3 Simulation tool to calculate indicator values
A mechanistic model of flock and farm operation manage-ment (Ostral) was used to simulate the diversity of
reproduction strategies that occur in sheep-meat production systems (seasonality, “acceleration” of reproduction), while accounting for the types of resources (various fodder types, crops used as concentrate feed and cash crops). Ostral was initially used to settle precisely flock functioning in terms of reproduction and to calculate flock indicators of performance such as ewe productivity (Benoit 1998).We used Ostral to simulate farm operations and to calculate the technical perfor-mance of each farm studied. Farm data (3–5 years) from case studies, combined with expert knowledge when needed, are used to describe feeding strategy (i.e., the quantity and type of concentrates and forages offered to each batch of sheep throughout the year according to animal feeding needs), crop and grassland fertilisation, crop yields, etc. According to the different farm characteristics and practices (quantity of each type of stored fodder, ha of crops, tons of manure to be spread,
Table 2 Characteristics of the five farms (Structure, flock size), technical performances for reproduction, concentrate use and type of lambs, and economic, environmental, and feed-food competition indicators. Figures in italic characters correspond to the indicators
selected for farm selection (Fig.2) and indicators discussed.Irel for the Irish system,Graz for Grazing, 3x2 for accelerated reproduction system, OF for Organic Farming, and DT for Dual Transhumant system
Farms Irel Graz 3x2 OF DT
Structure
Total agricultural area (ha) 36.8 81.9 53.9 91.9 4463 Stocking rate (ewe/ha fodder area) 11.4 6.6 8.7 4.4 0.5
No ewe (> 6 months) 420 541 470 405 2105
Workers (UWH) 1.00 1.50 1.50 1.00 4.67
Work productivity (eq.Livestock Unit W−1) 66.3 54.6 46.0 59.7 72.5 Flock management, lambs, and feeding
Prolificacy (%) 218 155 166 174 109
Ewe productivity (+ 6 months) (%) 154 133 166 132 82
Ewe mortality (%) 8.3 3.3 5.8 4.8 18.9
Lamb weight (kg carc hd−1) 19.9 20.0 16.3 17.0 16.6 Price of fattened lambs (€ kg carc−1) 4.76 6.43 6.64 7.03 7.82 Concentrates (kg ewe + 6 months−1) 36.5 42.2 134.6 77.1 0.0 Concentrates (kg carc−1) 1.22 1.55 5.24 3.41 0.00 Feed self-sufficiency (%) 94.9 94.3 78.2 88.1 100.0 Economic data and performance
Gross margin (€ ewe−1) 89 132 121 115 74
Structural cost (€ Equivalent Livestock Unit−1) 555 533 642 794 483 Land rental (€ kg carc−1) 1.08 0.50 0.61 1.03 1.91 Added value (€ W−1) (in French economic
situation for lamb price)
21,400 (40,500) 31,700 19,800 22,500 31,900 Environmental performance
N balance (Kg N ha TAA−1) 98 − 1 25 5 − 3
Gross GHG emissions (Eq CO2kg carc−1) 21.7 18.3 22.5 24.8 28.6 CH4/Gross GHG emissions (%EqCO2) 50.1 75.7 58.4 72.6 79.3 Net GHG emissions (EqCO2kg carc−1) 19.2 13.7 16.6 8.5 − 130.0 Total MJ non renew. energy (MJ kg carc−1) 50.6 31.4 50.9 47.6 22.7 Feed/food performance
etc.) Ostral simulates the standard levels and type of equip-ment needed in order to calculate equipequip-ment depreciation. Indeed, equipment has a key impact on economic perfor-mance but also on environmental perforperfor-mances (indirect en-ergy accounted for, in LCA). For the four French farms, we applied the same economic conditions for lamb and input prices (concentrates, fertilisers, fuel, etc.), i.e. those of the year 2015. Economic results ofIrel are also based on the year 2015, but on the Irish context. Social contributions were calculated by Ostral as 28% of the net income for the five farms (France or Ireland). This rate comes from the analysis of the long-term network of farms used to choose the five farms (see above). It is lower than the official French rate (42%) because the net income we calculated from a management perspective is higher than the net income calculated from a tax perspective. Ultimately, the use of the Ostral simulator made it pos-sible to calculate the indicators reported in Table2, some of which are not directly available from farm surveys such as the environmental indicators (Vigan et al.2017). These add to the classical technical and economic indicators (gross margin per ewe, net income, etc.) that are thus calculated from a consistent set of input and output vari-ables. It is noteworthy that the Ostral simulator can also extrapolate farm performances according to flock size, which was used to simulate a 420-ewe commercial Irish farm from a farmlet experiment with 60 ewes. Finally, Ostral allows accounting for various types of technical and market hazards (animal fertility, prolificacy, mortality; economic value on energy, concentrates, meat) affecting farm technical and economic performance (Benoit and Laignel2014).
Data availability The datasets generated during and/or analysed during the current study are available from the cor-responding author on reasonable request.
3 Results and discussion
3.1 Farm structure and technical performance
Table2 gives the main characteristics of the five farms in terms of structure with a huge variability in size and stocking rate. While the number of farm workers across flocks ranged from one to five (405 to 2105 ewes), productivity per worker only ranges from 46 to 72 LU W−1. Technical performance is quite different across farms. If we limit our analysis to key indicators that were previously discussed (ewe productivity and concentrate use) and considered as optimal combinations based on Fig.2, we see a wide range of ewe annual produc-tivity from 82% (DT farm) to 166% (3x2) and of concentrate use from 0 to 134.6 kg concentrates per ewe per year.DT is indeed penalised by a very high ewe mortality rate (19%),
nearly half of it being due to wolf predation in spite of pre-vention devices (Lasseur2008).
3.2 Economic performance
3.2.1 At the level of the sheep enterprise
Gross margin is a core indicator explaining a large part of farm profitability in sheep-meat production systems.Graz gets the highest gross margin per ewe (132€), thanks to high ewe productivity, lamb weight and price (the highest gross product at 187€/ewe), and very low feeding and fertiliser costs (Table 2). Systems 3x2 and OF are not far behind (with 121€ and 115€ gross margin, respective-ly), thanks to high ewe productivity and lamb prices and in spite of the highest input levels in 3x2 (Table2). Ewe productivity was lower in OF but this reduction was coupled with a strong decrease in concentrate use (− 43% compared to 3x2) as a consequence of the high cost of organic concentrate feed (+ 39% compared to conven-tional).Irel gets a − 33% gross margin per ewe compared to Graz (89€) because of the 27% lower lamb price in Ireland (4.76€ carc−1 carcass vs 6.43 for Graz, for the same type of lambs and selling period). If the same lamb price was obtained as in theGraz farm, gross margin per ewe would be 2% higher than inGraz (135 vs 132€ ewe−1 inIrel and Graz, respectively). Irel proportional costs are globally the same as in Graz. However, the management of the fertilisation is quite different: it is based on nitrogen forIrel, while no mineral N fertilisation was used in Graz. That is related with stocking rate which is nearly double for Irel (Table2). DT gets a 44% lower gross margin per
ewe compared to Graz (74€), with a 38% lower ewe pro-ductivity. Sale price was good for male lambs but low for non-fattened females. Sheep operational costs were the lowest (− 72% compared with Graz) due to very low inputs (i.e. no concentrate feed and only 0.5€ ewe−1 for fertilisers).
3.2.2 At farm level
Beyond gross margin, structural costs account for mechanisation, housing facilities, management, financial and wage costs, etc. DT shows the lowest structural costs per Equivalent Livestock Unit (483€ per equivalent livestock unit, LU) and OF the highest (794€). Indeed, DT has very little equipment (due to no fodder stock) and buildings. Its main structural cost is social contribution (46% of total) that results from a high net income. Structural costs per LU is rather low for Graz and Irel (534€ and 555€ respectively) where the share of equipment is 35% and 38% respectivelyvs 24% for DT. The share of each of the components of the structural costs were very different across farms; land renting is the main cost
forIrel, as the price of land is very expensive (370€ ha−1) and represents 38% of the total structural costs, at 1.1€ kg car-cass−1(23% of the lamb price). Land renting price is only 9.0€ ha−1for DT but, as both rangeland agronomic potential and ewe productivity are very low, it accounts for 1.9€ kg carcass−1(i.e. 24% of lamb price). OF structural costs per equivalent livestock unit are the highest as (i) the low stocking rate leads to expensive land rental per ewe (1.0€ kg carcass−1), (ii) equipment and mechanisation are costly as a part of the flock is kept indoors from November to April with large for-age stocks needed for winter feeding (as for3x2), and (iii) social contributions are high, as net income is quite high.
Finally, added value is the most suitable indicator of farm economic performance to illustrate the farms ability to use local resources for producing meat. The highest added values are forDTand Graz (31,900 and 31,700€, respectively) which have a flock management driven by the search for maximum autonomy combined with a high animal productivity forGraz and a high work productivity forDT. Added values in 3x2 and OF systems are significantly lower (19800 and 22500, respec-tively) as they show lower fodder self-sufficiency and/or a high price of inputs (concentrate, forOF). The Irel added value is comparable to that of3x2 and OF (21,400 €) but, under French economic conditions for lamb prices, it would be the highest, at 40,500€. Finally, the good economic perfor-mance of the five farms is confirmed by the comparison to French national references. According to the RICA (National Accounts Network for Agriculture) database, meat sheep farms with more than 250 ewes (n = 142) get a 2814€ added value per family worker. The lowest of the four French farm-ing systems studied (3x2) is 19,800€, and this is despite our case study upland farm facing strong pedoclimatic constraints.
3.3 Feed-food competition and environmental
performance
3.3.1 Feed-food competition
Because of high concentrate consumption in3x2 farm, 10.1% of the total proteins consumed by ewes are human-edible, which is the highest value for all five farms, the lowest value being 0% forDT in which sheep are feed on forages only (values between 8.1 and 9.1% for the three other farms). Protein conversion efficiency (protein production compared to total protein intake) is however low forDT (5.5% vs be-tween 8.3 and 10.1 for the four other farms) because of low ewe productivity and late male-lamb slaughtering (type of lambs requested by Muslim markets). Finally, as animals do not consume feed that are human-edible inDT, the conversion efficiency for protein consumable by humans (ECCPH) is infinite. ECCPH is higher than 100% for Irel and Graz (158% and 125%, respectively), which reveals that meat pro-duced from these three grass-based farming systems yields
more human-edible proteins than they utilise, so that these systems are very interesting for food security.
3.3.2 Nitrogen balance
Three of the five farms get close to a zero N balance (Graz, OF, DT) as there is no or very low N mineral fertilisation and no or very moderate use of concentrate feed (Table 2). Nitrogen surplus is 25 kg ha−1for3x2, because of the amount of concentrate feeds. The Irish farm has the highest N surplus, at 98 kg N ha−1because of a high N fertilisation application rate (103 kg N ha−1). However, we can consider that the risk of N leaching is limited, as the agricultural area of the farm con-sists only of pastures and as nitrogen supply is fragmented along the grazing season.
3.3.3 Greenhouse gas emissions
When calculating gross GHG emissions per kg carcass,Graz appears as the most efficient farming system (Table2) as it is the second most productive in term of meat produced per ewe (30.8 kg carcass ewe−1year−1) with very low input levels, in particular no mineral N fertilisation (providing N2O emis-sions). Its GHG emissions are the lowest, at 18.3 Eq CO2kg carc−1.Irel and 3x2 are two productive farming systems with some inputs (N fertiliser forIrel and concentrates for 3x2) and get 21.7 and 22.5 Eq CO2carcass kg−1, respectively. OF is less productive and its production is partly based on concentrate feed; its gross GHG emissions is 24.8 Eq CO2/kg carcass.DT is based on nearly no concentrate feed, nor mineral fertilisation. As the ewe productivity is low and male lambs are sold late resulting in significantly higher CH4emission over their lifetime, CH4contribution is high when expressed per kg of carcass. It accounts for 79.3% of the total GHG emissions, whereas it only represents 50.1% of it for Irel. However, farm ranking is strongly modified when accounting for carbon sequestration in pastures and rangelands. Indeed, the less animal-intensive systems are also the less land-intensive ones, with a low stocking rate and thus the highest carbon sequestration per kg carcass. Net GHG emissions are thus very low for OF (8.5 Eq CO2/kg Carc) and negative (positive carbon balance) forDT, which highlights the impor-tance of considering both GHG emissions and sequestration when evaluating the effect of a farming system on GHG. 3.3.4 Non-renewable energy (NRE) consumption
System ranking is quite different for NRE consumption com-pared with gross GHG emissions (Table2). Three farms (Irel,
3x2, and OF) get the highest NRE consumption (between 47.6 and 50.9 MJ kg carc.−1), as they use a high amount of mineral fertilisation (Irel) and sometimes concentrate feed that repre-sent up to 30% of total NRE (3x2). In the OF farm, input levels
are lower, but NRE consumption per kg of carcass is high because of a lower ewe productivity and meat production per ewe, and a high quantity of forage stocks required per ewe. SystemGraz has a low level at 31.4 MJ kg−1andDT system has the lowest, at 22.7 MJ kg−1carcass with its very limited inputs and very little mechanisation (no stocks for winter). In this farm, fuel however accounts for 62% of total NRE (for flock surveillance and animal transportation). In the Irish farm fuel accounts for 10% of NRE only, while energy for mineral fertilisation accounts for 38%.
3.3.5 Comparisons of GHG emissions and energy consumption to French networks
Average GHG emissions calculated from the database of 1180 farm years (Benoit and Laignel2011) in the Inra network is 31.6 kg Eq CO2kg−1carcass (Benoit and Dakpo2012). All five farms are below this level, evenDT at 28.6 kg Eq CO2 kg−1(− 10%) in spite of its low ewe productivity. Graz, Irel, 3x2, and OF are 42%, 31%, 29%, and 21% lower, respective-ly, thanks to good ewe productivity and high lamb weight for Graz and Irel that are “diluting” emissions of enteric CH4.
Regarding energy consumption, Bellet et al. (2016) showed that conventional farming systems based on grass utilisation or pastoral systems use an average 27.1 and 30.1 MJ kg live ani-mal−1, respectively (without indirect MJ of equipment), which corresponds to 60–70 MJ/kg carcass. Non-renewable energy consumption is around half this average inGraz and DT and 20% lower in3x2, OF, and Irel systems.
3.4 Synthesis of overall performance
Overall, this analysis shows how the different systems com-pare in the four dimensions of performance. The three farms (DT, Graz, Irel) maximising the use of local resources with a long grazing season and low feed stocks provide (i) the best economic performance in terms of added value (31,900, 31,700, 40,500€ W−1 (in the same economic situation)vs 19,800 and 22,500€ W−1for3x2 and OF, respectively) and (ii) the lowest feed/food competition (158%, 125%, and∞ compared to 33% and 51% for3x2 and OF, respectively). DT and Graz also show the lowest NRE consumption (22.7 and 31.4 MJ kg carc−1, respectively) compared toIrel, 3x2, andOF (47.6 to 50.9 MJ kg carc−1). However, these high performing system production systems require (i) lambs to be fattened during the grass growing season and thus to be sold mainly between July and November and (ii) to have a specific market for old male lambs in the case ofDT. In situ-ations of very low (DT) or lenient (Graz) stocking rates and levels of pasture intensification, we observe very good envi-ronmental results at farm level. In the Irish farm, the high price of land requires to enhance lamb production per ha which utilises high levels of N mineral fertilisation and increases
GHG emissions (N2O) as well as indirect energy consump-tion, thus leading to poorer environmental performance. In the less productive farms, high CH4emissions per kg of carcass is mitigated by high carbon sequestration per kg carcass in pas-tures (OF and DT). In the case of very low ewe productivity as forDT, the need to achieve high economic and environmental performance is to be fully self-sufficient for feed and to use nearly no inputs. The two farms that adopted counter season lambing require more inputs (especially concentrate feeds) with three direct consequences: lower added value, poorer environmental performance in term of energy consumption (concentrate feeds and equipment for stock), and high levels of feed-food competition (especially, cereals from concentrate feeds and pulses). Conversely, they better match the meat industry demand for a higher and more regular lamb meat supply (3x2) and quality sign lambs (OF) throughout the year.
3.5 Optimisation of local resources and market
constraints. What convergence and trade-offs?
Concentrate feed gives a great flexibility to farmers to modify reproduction periods and to fatten lambs easily in all contexts while increasing meat production in particular when land area is limited. It also secures production when grassland-based systems face feed shortages for example as the consequence of summer droughts, and facilitate the supply of lamb car-casses of stable quality (regular growing, homogeneity of batches). These systems are affected little by fluctuations in grass quality and quantity and offer opportunities to maximise animal genetic merit and high prices for lambs (see 3x2). Using concentrates may also have some sanitary benefits, in particular to limit parasitism by increasing the sheep resistance depending on diet offered (Coop and Kyriazakis1999). One of the main negative aspects is the impact on farm profitability due to the high and fluctuating cost of concentrate feeds, while pastures and rangelands represent a cheap and potentially high-nutritive resource. The limitation of concentrate use at farm scale implies that ewes have the ability to mobilise and recover body reserves. Although often showing low lamb conformation, rustic breeds can offer such ability to valorise various types of forage, in particular in harsh grazing condi-tions. They however often have to be crossbred so as to in-crease lamb conformation, which complicates farm manage-ment. Rustic breeds also display advantages for reproduction, with good fertility for spring mating, therefore avoiding hor-monal treatments that concern the large majority of French grass-based systems using well-conformed breeds.
Choice of breeds is central in farmers’ strategies and suc-cess, with various capacities and production levels, and some-times low adaptation to industry requirements. As summarised in Table1, this choice differed across the five farms and breed appeared as a key lever to adapt to contrasting opportunities and constraints.
Figure3 summarises the main findings of our work. It outlines the strategies of farmers that more or less optimise the use of fodder resources under contrasted environmental conditions, while aiming to meet the expectations of the lamb meat industry. TheX-axis accounts for the gradient of grass potential, while theY-axis accounts for farm fodder self-suffi-ciency. The majority of the sheep farms in our database (Fig.
2) are in the lower part of the graph, with fodder self-sufficiency usually between 70 and 85%. These farms usually plan part of their lambing in counter season, providing lambs in winter, with good conformation in lowland conditions. Farm3x2 is close to the bottom-right quarter of the graph, providing the best answer to the sheep industry demand among the five farms. FarmsGraz and Irel provide good qual-ity lambs (conformation) but only between July and November.DT provides lambs only during 4 months, with quality not matching the global sheep industry standards, but meeting local demand (old males lambs), while female lambs are sold before fattening.OF is in an intermediate position.
In our study, even with optimised flock management and in a rather good economic situation (price of the meat), the profit-ability remains lower in concentrate-based than in grass-based farming systems, and the added-value indicator confirms the lower optimisation of local resources. One can also conclude that the lamb price is too low in counter season production systems considering the extra costs of lamb production.
Moreover, energy consumption, feed/food competition, and sometimes net GHG emissions are poor in very productive concentrate-based farming systems.
Interestingly, this analysis illustrates that reaching high economic performance is de-correlated with the achievement of the different market standards, especially seasonality. The farming systems that reach the highest levels of added value are those that do not respect market seasonality, which illus-trates an advantage to adapt for climatic variability and agro-nomic potential before to meat industry demand. So, if they perform so well, what does limit the scaling-up of such agro-ecological systems? These grass-based sheep farming systems indeed require both specific skills and marketing adequacy. Some specific markets can be an opportunity, such as the Muslim market for male lambs in southeast France or short chains marketing channels meeting alternative consumer ex-pectations (referring to the “naturality” of products). For farmers who cannot access alternative markets, this antago-nism between farm strategies to reduce inputs (in particular concentrate feeds) and demands from the lamb meat industry are a major issue. In order to meet the requirement of lamb supply to the sheep industry, a larger-scale strategy would be to explore farming systems complementarities both within and between livestock production areas. Autumn lambing farming systems with adapted breeds (natural mating in spring but often low conformation) can be considered as complementary
Fodder self-sufficiency ++ Fodder S-S -Grass potential (quality-duration) ++ Grass potential -(heterogeneous in time and space)
DT OF 3x2 Irl Market Conf. Regul.
-
-
+
-+ -+
-
+
Majority of French sheep farming systems
Rustic breeds
Grass and conformed breeds
F a rm s e c o n o m ic p ro fitab ility Graz Market Conf. Regul. Market Conf. Regul. Market Conf. Regul.
Fig. 3 Schematic representation to position sheep farming systems on both grass potential and grass level of utilisation (fodder self-sufficiency), and consequences on market adequacy: in the graph corners, we estimate the level of adaptation to market demand in term of lamb conformation (‘Conf.’) and selling regularity along the year (‘Regul’ as regular selling). Horizontal blue arrows show the type of breeds used in low or high grass potential situations, in relation with
lamb conformation. Diagonal arrow points out the sensitivity to economic hazards, in relation with levels of animal intensification and input use, and vertical arrow indicates that best farm profitability is on top part.DT for Dual Transhumant system, OF for Organic Farming, 3x2 for accelerated reproduction system,Graz for Grazing system, Irel for the Irish system
to the end of winter lambing farming systems such asGraz or Irel, with well-conformed breeds (Benoit and Laignel2011). However, this raises the question of homogeneous lamb char-acteristics (age, conformation, taste, etc.) (Prache2014) and requires adaptation from the sheep industry to deal with lamb carcass variability. There is indeed some evidence that feeding lambs on grass-based diets affect carcass quality and meat nutritional quality, with either positive consequences (desir-able fatty acid or antioxydant compounds) (Aurousseau et al.
2007) or negative ones on meat flavour (Prache2014).
4 Conclusion
The economic performance of the five farms studied are far above the sheep farm average. Each type develops a specific strategy in regard to environmental conditions for an overall high efficiency of concentrate feed utilisation.
The analysis of these five very efficient farming systems points out the antagonism between the maximisation of on-farm forage utilisation and on-farm profitability on the one hand, and lamb’s ideotype required by the sheep-meat industry on the other hand. It shows that farmers who manage to reach high profitability are those who give a greater importance to adapting their system to the environment than to the demands of the meat industry. Such grass-based and efficient farming systems are rather scarce in France. They require high technicity, observation and adaptation capability from farmers, as illustrated byDT farm that provide high environ-mental and economic performances with very low inputs.
It would be worthwhile to extend this analysis to a wider range of regulating and cultural services provided by sheep grassland-based farming systems. The bundle of services framework proposed by Ryschawy et al. (2019) allows ac-counting for a wider range of sustainability drivers (labour and employment, social and cultural factors, biodiversity) be-yond the economic and environmental performance indicators that were calculated in this article. It thus provides a wider basis for comparing sheep-meat production systems.
Compliance with ethical standards
Conflict of interest The authors declare that they have no conflict of interest.
References
Aurousseau B, Bauchart D, Faure X, Galot AL, Prache S, Micol D, Priolo A (2007) Indoor fattening of lambs raised on pasture. Part 1: influ-ence of stall finishing duration on lipid classes and fatty acids in the longissimus thoracis muscle. Meat Sci 76(2):241–252.https://doi. org/10.1016/j.meatsci.2006.11.005
Bellet V, Ferrand M (2014) Leviers de réduction des coûts de production en élevage ovin viande. Renc Rech Ruminants 21:187–190 Bellet V, Experton C, Gac A, Laignel G, Morin E (2016) Les systèmes
ovins biologiques sont-ils plus durables que les conventionnels ? Renc Rech Ruminants:243–246
Benoit M (1998) A tool for simulation of sheep flock functioning, with it’s economic results: a help for adaptation to new contexts. INRA Prod Anim 11(3):199–209
Benoit M, Dakpo H (2012) Greenhouse gas emissions on french meat sheep farms: analysis over the period 1987-2010. Emissions of Gas and Dust from Livestock, Edits. Hassouna M., Guigand N. Proceedings Emili 2012 congress, pp 384-387
Benoit M, Laignel G (2006) Methods for processing technical and eco-nomic data on suckling sheep. The case of plain and mountain areas in France. Options Mediterraneennes. Serie A, Seminaires Mediterraneens (70):57-65http://om.ciheam.org/om/pdf/a70/ 00800006.pdf
Benoit M, Laignel G (2011) Long term analysis of meat sheep farming systems in France. Which dynamics of evolution and which factors can explain the economical performance? Inra Productions Animales 24(3):211–220
Benoit M, Laignel G (2014) Sheep-for-meat farming systems in French semi-upland area. Adapting to new context: increased concentrates and energy prices, and new agricultural policy. Int J Sustain Dev 17(1):35–48.https://doi.org/10.1504/ijsd.2014.058435
Coop RL, Kyriazakis I (1999) Nutrition–parasite interaction. Vet Parasitol 87: 187-204
Dollé J, Faverdin P, Agabriel J, Sauvant D, Klumpp K (2013) Contribution de l’élevage bovin aux émissions de GES et au stockage de carbone selon les systèmes de production. Fourrages 2015:181–191
Dumont B, Groot JCJ, Tichit M (2018) Review: make ruminants green again - how can sustainable intensification and agroecology con-verge for a better future? Animal 12(S2):s210–s219.https://doi. org/10.1017/S1751731118001350
Dumont B, Ryschawy J, Duru M, Benoit M, Chatellier V, Delaby L, Donnars C, Dupraz P, Lemauviel-Lavenant S, Méda B, Vollet D, Sabatier R (2019) Review: associations among goods, impacts and ecosystem services provided by livestock farming. Animal 13(8): in press.https://doi.org/10.1017/s1751731118002586
Earle E, Boland TM, McHugh N, Creighton P (2017) Measures of lamb production efficiency in a temperate grass-based system differing in ewe prolificacy potential and stocking rate. J.ANim. Sci 95(8): 3504–3512.https://doi.org/10.2527/jas2017.1427
Ertl P, Klocker H, Hörtenhuber S, Knaus W, Zollitsch W (2015) The net contribution of dairy production to human food supply: the case of Austrian dairy farms. Agric Syst 137:119–125.https://doi.org/10. 1016/j.agsy.2015.04.004
European Parliament (2008) The future of sheep and goat sector in Europe. Policy Department. Structural and Cohesion Policies. IP/ B/AGRI/IC/2007_043: 109p
Gac A, Cariolle M, Deltour L, Dollé JB, Espagnol S, Flénet F et al (2011) GES’TIM – des apports pour l’évaluation environnementale des activités agricoles. Innovations Agronomiques 17:83–94
Lasseur J (2008) What means adapting to wolf reappearance for sheep farmers in French Southern Alps? Book of abstracts of the 59th annual meeting of the European Association for Animal Production
https://prodinra.inra.fr/ft?id={1D097F8C-9D8A-40FD-A1D0-87ACD256FB50Accessed July 2018: 7p
Mottet A, de Haan C, Falcucci A, Tempio G, Opio C, Gerber P (2017) Livestock: on our plates or eating at our table? A new analysis of the feed/food debate. Glob Food Sec 14:1–8.https://doi.org/10.1016/j. gfs.2017.01.001
O’Rourke E, Charbonneau M, Poinsot Y (2016) High nature value moun-tain farming systems in Europe: case studies from the Atlantic
Pyrenees, France and the Kerry Uplands, Ireland. J Rural Stud 46:
47–59.https://doi.org/10.1016/j.jrurstud.2016.05.010
OECD (2015) OECD-FAO Agricultural Outlook 2015. Editions OECD, Paris 159p
Prache S (2014) Advances, issues and challenges in organic lamb meat quality. In: S Bellon & S Penvern (eds) Organic farming, prototype for sustainable agricultures. Chapter 17: 313-324
Ripoll-Bosch R, Joy M, Bernues A (2014) Role of self-sufficiency, pro-ductivity and diversification on the economic sustainability of farm-ing systems with autochthonous sheep breeds in less favoured areas in Southern Europe. Animal 8(8):1229–1237.https://doi.org/10. 1017/S1751731113000529
Rossi R (2017) The sheep and goat sector in the EU Main features, challenges and prospects. European Parliamentary Research Service: 8p
Royer JY (1988) Le journal de Noé de Barras, un entrepreneux de trans-humance au XVe siécle. Les Alpes de lumière 98: 75p
Ryschawy J, Dumont B, Therond O, Donnars C, Hendrickson J, Benoit M, Duru M (2019) Review: an integrated graphical tool for analysing im-pacts and services provided by livestock farming. Animal 13(8): in press.https://doi.org/10.1017/S1751731119000351
Vermorel M, Jouany JP, Eugène M, Sauvant D, Noblet J, Dourmad JY (2008) Evaluation quantitative des émissions de méthane entérique par les animaux d’élevage en 2007 en France. INRA Prod Anim 21(5):403–418
Vigan A, Lasseur J, Benoit M, Mouillot F, Eugène M, Mansard L, Vigne M, Lecomte P, Dutilly C (2017) Evaluating livestock mobility as a strategy for climate change mitigation: combining models to address the specificities of pastoral systems. Agric Ecosyst Environ 242:89–
101.https://doi.org/10.1016/j.agee.2017.03.020
Watson CA, Atkinson D (1999) Using nitrogen budgets to indicate nitro-gen use efficiency and losses from whole farm systems: a compar-ison of three methodological approaches. Nutr Cycl Agroecosyst 53: 259–267
Wilkinson JM (2011) Re-defining efficiency of feed use by livestock. A n i m a l 5 ( 7 ) : 1 0 1 4– 1 0 2 2 . h t t p s : / / d o i . o r g / 1 0 . 1 0 1 7 / S175173111100005X
Publisher’s note Springer Nature remains neutral with regard to jurisdictional claims in published maps and institutional affiliations.