HAL Id: hal-03126325
https://hal.uca.fr/hal-03126325
Submitted on 14 Feb 2021
HAL is a multi-disciplinary open access
archive for the deposit and dissemination of sci-entific research documents, whether they are pub-lished or not. The documents may come from teaching and research institutions in France or abroad, or from public or private research centers.
L’archive ouverte pluridisciplinaire HAL, est destinée au dépôt et à la diffusion de documents scientifiques de niveau recherche, publiés ou non, émanant des établissements d’enseignement et de recherche français ou étrangers, des laboratoires publics ou privés.
Relationship between adaptation and cardiovascular
response to tonic cold and heat pain : Adaptability to
tonic pain and cardiovascular responses
Laurent Devoize, Philippe Chalaye, Sylvie Lafrenaye, Serge Marchand,
Radhouane Dallel
To cite this version:
Laurent Devoize, Philippe Chalaye, Sylvie Lafrenaye, Serge Marchand, Radhouane Dallel. Relation-ship between adaptation and cardiovascular response to tonic cold and heat pain : Adaptability to tonic pain and cardiovascular responses. European Journal of Pain, Wiley, 2015, 20 (5), pp.731 - 741. �10.1002/ejp.799�. �hal-03126325�
1 Relationship between adaptation and cardiovascular response to tonic cold and heat
pain
Laurent Devoize1,2, Philippe Chalaye3, Sylvie Lafrenaye4, Serge Marchand3, Radhouane
Dallel1,2
1Clermont Université, Université d’Auvergne, Neuro-Dol, BP 10448, F-63000,
Clermont-Ferrand & Inserm U1107, F-63001Clermont-Clermont-Ferrand, France; 2CHU Clermont-Ferrand,
Service d’Odontologie, F-63003 Clermont-Ferrand, France; 3Departement de Chirurgie,
Université de Sherbrooke, Sherbrooke, Québec, Canada ; Département de Pédiatrie, Centre Hospitalier Universitaire de, Sherbrooke, Québec, Canada
Running title: Adaptability to tonic pain and cardiovascular responses
Category for the manuscript: original article
Correspondence to:
Radhouane Dallel: radhouane.dallel@udamail.fr
INSERM/UdA U1107, Neuro-Dol: Douleur Trigéminale et Migraine Faculté de Chirurgie Dentaire, 2 Rue de Braga,
63100 Clermont-Ferrand, France
2 Funding Sources: This research was supported by Pr. Marchand’s research grants from CIHR (Canada) and FRSQ (Québec). Laurent Devoize would like to thank “La fondation de l’Université d’Auvergne Clermont 1, France” for her financial support.
Conflict of interest: The authors report no conflict of interest.
Text pages: 25, Figures: 3; Tables: 3, Supplementary table: 1; References: 40 Abstract: 250 words; Introduction: 379 words; Discussion: 1485 words
3 Questions:
What's already known about this topic?
Adaptability to tonic pain varies between subjects.
Cardiovascular and pain regulatory systems interact with each other.
However, whether pain adaptability is related to the cardiovascular system is unknown.
What does this study add?
Two groups of participants, pain adaptive and pain non-adaptive, were identified according to their response to tonic thermal pain.
These findings indicate that pain adaptation is related to initial pain rating and latency to peak pain but not to cardiovascular responses.
4 Abstract
Background: The mechanisms of adaptation to tonic pain are not elucidated. We hypothesized that the adaptability to tonic pain is related to the cardiovascular systems. Methods: Twenty-six subjects received over two sessions in a random order: tonic cold (7 ± 0.2°C) and heat pain (47.5 ± 0.5°C) on the hand for 5 minutes. Pain intensity, blood pressure (BP), and heart rate (HR) were continuously monitored.
Results: Pain experience during the heat (HIT) and cold (CIT) immersion tests exhibited different average time courses, being approximated with a linear and cubic function, respectively. In each test, two groups of participants could be identified based on the time course of their tonic thermal pain: one-third of participants were pain adaptive and two-thirds non adaptive. The adaptive groups exhibited higher initial pain, lower last pain and shorter latency to peak pain than the non-adaptive one. Interestingly, some participants were adaptive to both pain stimuli, most were not. HIT as well as CIT produced a stable elevation of BP. However, BP was higher during CIT than HIT (p = 0.034). HR was also increased during CIT and HIT, but the two tests differed with respect to the time course of responses. Finally, the intensity and time course of pain rating to both HIT and CIT correlated with neither BP nor HR responses.
Conclusions: These results suggest that individual sensitivity and adaptability to tonic thermal pain is related to the intensity of initial pain rating and the latency to peak pain but not to cardiovascular responses.
Keywords: Pain, Cold, Heat, Adaptability, Temporal Profile, Summation, Autonomic nervous system, Blood pressure, Heart rate
5 1. Introduction
The perception of pain is a complex and dynamic process that is characterized by tremendous inter-individual variability (Nielsen et al., 2009). Previous studies have reported a decrease (Milne et al., 1991; Ernt et al., 1986; Hollins et al., 2011) as well as an increase (Casey et al., 2001; May et al., 2012) in pain experience during exposure to repeated noxious stimuli. Increasing and decreasing pain represent facilitation and adaptation to painful stimulation, respectively. Such inter-individual variability can also occur during continuous painful stimuli that might better mimic clinical pain conditions (Naert et al., 2008). Chen et al. (1989) measured the endurance time during a tonic cold stimulation of the hand and identified pain tolerant and pain sensitive subjects. More recently, Zheng et al. (2014), by computing the difference between peak and last pain ratings to a similar cold stimulation of the hand, also observed two types of participants, pain-adaptive (39%) and pain-nonadaptive (61%). Finally, Naert et al. (2008) identified three forms of responses to tonic heat pain stimulation of the upper leg: 11% of participants reported increased then reduced pain, 55% increased pain, and 34% stable pain. These responses were referred to as pain adaptation, pain summation, and stable pain, respectively.
The mechanisms underlying the adaptation to tonic pain are not completely elucidated. Differences in the peripheral vascular reactions to cold (Kreh et al., 1984; Lautenbacher et al., 1995) or potency of local pain inhibition (Zheng et al., 2014) have been suggested to account for individual pain sensitivity. Interestingly, both humans and animals studies have demonstrated functional interactions between cardiovascular and pain regulatory systems (Bruehl and Chung, 2004). According to these studies, high resting blood pressure (BP) was consistently associated with reduced pain sensitivity (Bruehl and Chung, 2004). Recently, we found that the cardiovascular responses to conditioning cold stimuli were positively correlated
6 with the magnitude of endogenous pain inhibition (Chalaye et al., 2013). These results imply that cardiovascular responses to tonic painful stimuli might be useful predictors of the endogenous capacity to modulate pain. Thus, we hypothesized that the cardiovascular reaction to tonic pain is associated with pain adaptability.
The aims of this experimental study were (i) to characterize the adaptability to tonic cold and heat pain and (ii) to examine the relationship between such adaptability and the cardiovascular parameters in healthy volunteers.
7 2. Methods
2.1 Subjects
Twenty-seven healthy volunteers participated in this study. One participant did not complete the entire experimental procedure and was removed from all analyses based on this criterion. Hence, 26 healthy volunteers (13 men and 13 women, mean age = 26.0 ± 0.9 years) were included in the analyses. All participants signed a written consent form, and all procedures were approved by the Human Ethics Committee of the Centre Hospitalier Universitaire de Sherbrooke (CHUS). None were suffering from known diseases or self-reported hypo/hypertension and none have health problem that needed medications. Subjects were asked to refrain from smoking and/or drinking coffee one hour before testing. Only women in luteal phase of their menstrual cycle or under contraception were included. All subjects received a 20$CAD compensation for their participation.
2.2 Pain perception during cold and hot water immersion tests
Participants were comfortably seated in a quiet room. Cold water immersion test (CIT) and hot water immersion test (HIT) were used to elicit strong and prolonged pain sensations. Immersion tests consisted in the immersion of the right arm (up to the elbow) in circulating cold (7°C) or hot water (47.5°C) during 5 minutes. These temperatures were shown to induce moderate pain in healthy subject (Tousignant et al., 2005; Granot et al., 2008). The sequence of both tests was alternated and participants were randomly assigned to sequence order and parallelized with respect to gender. An interval of at least 60 minutes separated the CIT and the HIT. Subjects rated their perceived pain every 15 seconds during the 5-minute immersion. Ratings of pain intensity and unpleasantness were obtained verbally using separate visual analog scales (VAS) with numeric and verbal descriptors ranging from 0 (no pain/not
8 unpleasant) to 100 (most intense/unpleasant pain imaginable).
2.3 Adaptability to cold and hot water immersion tests
We observed that the time course of VAS pain during HIT (linear function) and CIT (cubic function) are different, and therefore, different methods of calculation were used to identify the individual temporal profile of pain rating. We used the methods of Zheng et al. (2014) for CIT and adapted those of Naert et al. (2008) for HIT. A cut-off of 20 out of 100 was used to classify the participants as pain adaptive or non-adaptive, because this level of pain variation is considered significant in clinical (Todd et al., 1996), and experimental (Zheng et al., 2014) studies. The temporal profile of pain rating to HIT was indicated by subtracting the last pain rating from the first pain rating. Thus, when the difference between the first and last pain ratings was less than or equal to 20/100, participants were classified as pain adaptive (ie, reporting decreased pain or no change during HIT); otherwise pain non-adaptive (ie, reporting increased pain during HIT).The temporal profile of pain rating to CIT was indicated by subtracting the last pain rating from the peak pain rating (maximal pain intensity). For cold stimulation, participants, who showed a decrease of more than 20 points between peak pain and the last cold pain rating were classified as pain adaptive (ie, reporting decreased pain or no change during CIT); otherwise pain non-adaptive (ie, reporting increased pain during CIT).
2.4. Blood pressure
Noninvasive continuous blood pressure measurements were taken during baseline (5 minutes) and during CIT and HIT (5 minutes) using a Nexfin monitor (BMEYE, Amsterdam, Netherlands). The finger cuff was placed on the mid-phalanx of the index or middle finger (with appropriate cuff size) of the left hand. The heart reference system of the Nexfin monitor was used to compensate for differences between finger and heart level. Nexfin monitor
9 showed good accuracy and reliability to track changes in BP compared to invasive intra-arterial pressure measurement (Martina et al., 2012). BP responses to the CIT and HIT were determined by calculating immersion-induced changes in BP (ie, mean BP during CIT or HIT mean blood pressure during baseline before each session).
2.5 Heart rate
Electrocardiograms (ECG) were recorded and analyzed at baseline (5-minute rest at the beginning of the experimental session) and during CIT or HIT (5 minutes). ECG activity was obtained using a standard 3-lead montage sampled at a frequency of 1000 Hz using the PowerLab system and analyzed with Chart software (AD Instruments, Colorado Springs, CO, USA). Mean heart rate was computed from successive R-R intervals of the ECG waveform. Cardiac responses to CIT and HIT were determined by calculating immersion-induced changes in heart rate (ie, mean heart rate during CIT or HIT mean heart rate during baseline before each session).
2.6 Statistical analysis
Statistical analyses were conducted with SigmaStat 2.03 for Windows (SPSS, Erkrath, Germany). The time course of pain rating, blood pressure and HR during CIT and HIT were analyzed by using one-way Repeated Measures (RM) analysis of variance (ANOVA) followed by a post-hoc Tukey test (normally distributed data) or Friedman test on ranks with post-hoc Tukey test (non-normally distributed data). Within-subject effects for pain rating, heart rate, and blood pressure were analyzed using paired t-tests. Student’s t-tests were used to examine the differences between the pain adaptive group and pain non-adaptive group. Fisher’s Exact Test was used to analyze the association between either gender or stimulation-order and the adaptability to tonic cold and heat pain. Pearson’s correlations were used to test
10 the linear relationships between the characteristics of pain response (initial pain rating, peak pain rating, latency to peak pain, and average pain rating), and pain ratings and cardiovascular responses. All data are given as mean ± SEM. Statistical significance was set at P < 0.05. 3. Results
3.1 Pain perception to tonic cold and heat pain
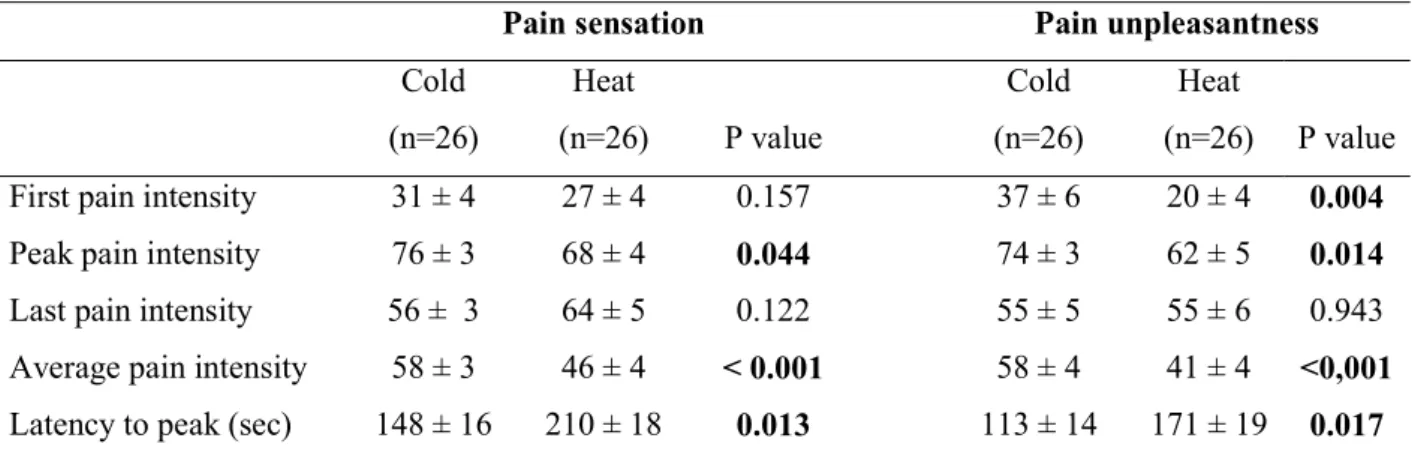
A comparison of response to cold (CIT) and heat (HIT) immersing tests is shown in Figure 1 and Table 1. Pain intensity and time course of pain experience were different for both tests. On average, pain sensation (t = -3.593, P = 0.001) and pain unpleasantness (t = -4.561, P < 0.001) intensity were significantly higher during CIT than during HIT (Table 1). Average pain intensity and pain unpleasantness were highly correlated for both CIT (r = 0.832, P < 0.001) and HIT (r = 0.821, P < 0.001).
Regarding the time course of pain perception, we also found that CIT and HIT were different. The time course of perceived pain sensation and pain unpleasantness intensity is illustrated in Figure 1A and 1B, respectively for the two modalities. During the HIT, the function best describing pain sensation intensity evolution in time is monotonic and approximately linear in form (r = 0.994, P < 0.001). There was a slow and steady increase in pain throughout the 5 min of the test period, without any indication of acceleration or deceleration. In contrast, to the linearity observed with heat pain, pain intensity evoked by cold stimulation (CIT) is better approximated by a cubic function (r = 0.967, P < 0.0001). There was a rapid increase in pain over the first 75 sec, thereafter, the subjects exhibited pain adaptation.
During both tests, the latency to peak pain unpleasantness was significantly shorter than for peak pain sensation (CIT: t = 2.352, P = 0.027, HIT: t = 2.230, P = 0.035). The latency to peak pain sensation and peak pain unpleasantness evoked by CIT was significantly shorter
11 than those evoked by HIT (difference of 60 seconds, Table 1). A significant difference in pain rating between CIT and HIT was observed 45 seconds after the beginning of hand immersion and disappeared after the 180th second.
Pearson's correlation revealed a strong positive relationship between the initial pain sensation rating and the average pain sensation rating (CIT: r = 0.554, P = 0.003; HIT: r = 0.606, P = 0.001), and between initial pain unpleasantness rating and the average pain unpleasantness rating (CIT: r = 0.598, P = 0.001; HIT: r = 0.634, P < 0.001), for both tests. The effect of the order of the presentation of the test (i.e. HIT or CIT first) on the temporal profile was analyzed and was non-significant. These results suggest that the magnitude of pain sensation and pain unpleasantness are related to intensity of the initial pain sensation and the initial pain unpleasantness, respectively.
3.2 Adaptability to tonic cold and heat pain
The analysis of the individual temporal profile of pain ratings during CIT (Fig. 2A, B) and HIT (Fig. 3A, B) revealed that some participants were pain adaptive and some were pain non-adaptive.
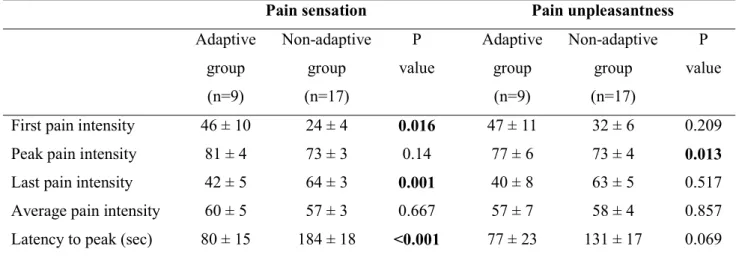
During CIT, 9 (35%) participants (pain adaptive group) showed increased pain to CIT initially, then a gradual, steady decrease after approximately 75 seconds. At the end of the 5 minutes, there was no significant difference (t = 0.475, P = 0.648) between the initial and the last pain sensation rating (Table 2A). The remaining 17 (65%) participants (pain non-adaptive group) reported pain in a similar manner to the pain adaptive group in the first 75 seconds. Thereafter, the pain ratings plateaued. There was a significant difference between the initial and the last pain sensation rating for the pain non-adaptive group (t = - 9.377, P < 0.001). A comparison of the pain adaptive and pain non-adaptive groups based on their responses to CIT is shown in Table 2A. No significant group difference was observed for the average pain
12 sensation and pain unpleasantness. However, the pain adaptive group had significantly higher initial pain sensation (t = - 2.597, P = 0.016) and lower last pain sensation rating than the pain non-adaptive group (t = 3.657, P = 0.001). Moreover, compared to the pain non-adaptive group, the pain adaptive group required significantly less time to attain peak pain sensation (t = 3.919, P < 0.001).
During HIT, 8 (31%) participants (pain adaptive group) showed no change in pain rating over time. At the end of the 5 minutes, there was no significant difference (t = - 0.527, P = 0.615) between the initial and the last pain sensation rating for these participants (Table 2B). The remaining 18 (69%) participants (pain non-adaptive group) reported slow and steady increase in pain throughout the 5 min of the test period. There was significant difference between the initial and the last pain sensation rating (t = 10.529, P < 0.001) for the pain non-adaptive participants. A comparison of pain non-adaptive and pain non-non-adaptive groups based on response to HIT is shown in Table 2B. Similar to those in response to CIT, both groups did not differ with regard the average pain sensation and pain unpleasantness. However, the pain adaptive group had significantly higher initial pain sensation and lower last pain sensation rating than the pain non-adaptive group. Again, the pain-adaptive group required significantly less time to reach peak pain sensation (t = - 4.911, P < 0.001).
There was no correlation between being adaptive to HIT or CIT. Some participants (15 %, n=4) were adaptive to both heat and cold, some were adaptive to only one of the stimulation modalities (35%, n= 9), and 50 % (n=13) of participants were non-adaptive to both.
The adaptability to tonic cold (male vs female: 30.8% (n = 4) vs 38.5% (n = 5) adaptive, Fisher's Exact Test, P = 1), and heat (male vs female: 46.2 % (n = 6) vs 15.4 % (n = 2) adaptive, Fisher's Exact Test P = 0.20) pain was not related to gender. However, this results should be interpreted with caution because our sample size (n = 13 per group) was insufficient to conduct statistical analyses with appropriate power. There was no stimulation-order effect
13 in the adaptability to tonic cold (Fisher's Exact Test, P = 0.66), and heat (Fisher's Exact Test, P = 0.58) pain.
The results suggest that the individual temporal profile of pain sensation is related to both the initial pain intensity and the latency to peak pain.
3.3 Relationships between pain rating and cardiovascular responses
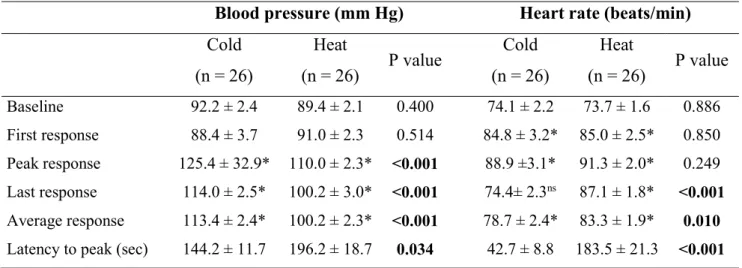
As indicated in Figures 1, 2 and 3 and in supplementary Table 1, there was no difference in pre HIT and pre CIT baseline values of BP and HR. The mean arterial BP response increased significantly during CIT (F= 30.573, P < 0.001) and HIT (F= 9.087, P < 0.001). The time course of BP was comparable for both immersion tests (Fig. 1C). The time course of BP during CIT and HIT is illustrated in Figure 1C and can be approximated by a cubic function (heat: r = 0.908, P < 0.001; cold: r = 0.927, P < 0.001). However, CIT produced a stronger rise in BP than HIT (Table 3, t = 5.760, P < 0.001) and the latency to attain peak BP is significantly shorter for CIT than HIT (Table 3, t = -2.247, P = 0.034).
The HR response also varies during CIT and HIT, but the two tests differed with respect to the time course of responses (Fig. 1D). During CIT, HR increased significantly (F = 17.049, P < 0.001) during the first 30 sec and then decreased throughout the rest of the stimulation period. From 180 seconds, no significant difference in HR is observed from the baseline. During HIT, HR increased significantly (F = 25.397, P < 0.001) during the first 15 sec, then decreased (P<0.001) during the following 75 sec (but remains significantly higher than the baseline, P = 0.001) and finally re-increased (P < 0.001). On average, the increase in HR was significantly higher (Table 3, t = -2.753, P = 0.010) during the HIT compared the CIT. However, the peak HR response is achieved significantly earlier (Table 3, t = -6.941 P < 0.001) during CIT, than HIT. During CIT, the latency to peak BP is significantly shorter than for peak HR (t = 6.694, P < 0.001), while there is no difference during the HIT.
14 Correlation analysis revealed no significant correlations between the BP variation and average pain sensation (r = 0.049, P = 0.810) or pain unpleasantness (r = 0.043, P = 0.833) following tonic cold. Similarly, no linear relationship was observed between the BP variation and average pain sensation (r = 0.117, P = 0.570) or average pain unpleasantness (r = 0.162, P = 0.429) following tonic heat pain. No significant relationship was found between the HR variation and average pain sensation (r = 0.059, P = 0.776) and average pain unpleasantness (r = 0.060, P = 0.770) following tonic cold and between the HR variation and average pain sensation (r = 0.155, P = 0.448) and average pain unpleasantness (r = 0.282, P = 0.162) following tonic heat pain.
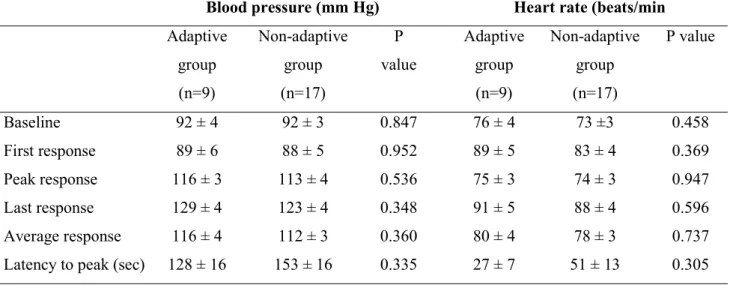
No significant differences in the temporal profile of the BP (Fig. 2C, 3C) and HR (Fig. 2D, 3D) evoked by CIT and HIT was observed between the pain adaptive and pain non-adaptive groups. Overall, there were also no significant differences in magnitude of variations of cardiovascular parameters during CIT and HIT between the groups (Table S1), except for the latency to peak BP during HIT which was slightly but significantly (t = -2.371, P = 0.026) shorter for the pain adaptive group.
15 4. Discussion
The present study characterized : i) the physiological and psychophysical effects of tonic cold and hot water immersion test in healthy adults, ii) the adaptability to tonic cold and heat pain, and iii) the relationships between pain adaptability and cardiovascular parameters.
Consistently with previous studies (Rainville et al., 1992; Lautenbacher et al., 1995; Tousignant-Laflamme et al., 2005; Zheng et al., 2014; but see Streff et al., 2010), we found that the intensity of pain sensation and unpleasantness were significantly higher during CIT than during HIT. Moreover, there was a strong correlation between the initial intensity and the total amount of heat and cold pain. These relationships imply that the total amount of tonic noxious cold and heat-evoked pain can be inferred from the initial pain intensity. Interestingly, the intensity of suprathreshold heat pain has been shown to correlate with postoperative pain (Abrishami et al., 2011).
In this study, continuously rating pain intensity and unpleasantness revealed that the time courses of both CIT and HIT-evoked pains are not only complex but also different. On one hand, during CIT, pain rapidly increases over the first 75 seconds of the test and, thereafter, stabilizes. Similar time-course of pain intensity during CIT has been previously obtained (Wolf and Hardy, 1943; Kreh et al., 1984; Rainville et al., 1992; Lautenbacher et al., 1995; Polianskis et al., 2002; Streff et al., 2010; Zheng et al., 2014). On the other hand, during HIT, pain slowly and steadily increases throughout the 5-min test, as previously observed by studies using water immersion (Zhao and Chen, 2009; but see Streff et al., 2010) as well as contact thermode (Rainville et al., 1992; Lautenbacher et al., 1995; Naert et al., 2008; Zheng et al., 2014, but see Weissman-Fogel et al., 2014). Differences between the time courses of tonic cold and heat pain may result from different peripheral (Kreh et al., 1984; Treede et al.,
16 1995; Peng et al., 2003), spinal (Tiseo et al., 1990), and supraspinal (Cazey et al., 1996; Craig et al., 1996) mechanisms.
Using a tonic cold (t = 0-2°C) stimulation, Chen et al. (1989) identified two types of responses: pain tolerant participants could keep their hand in cold water during at least 3 min and pain sensitive ones could not withstand more than 80 s. Recently, Zheng et al. (2014) proposed a new method to identify different response patterns to tonic painful cold (1-4°C) stimulation: pain adaptability was assessed by computing the difference between peak and last pain ratings. Two groups of participants, pain adaptive (40% of participants) and pain non-adaptive (60% of participants), were thus identified based on whether this difference was < or ≥ 2 (out of 10) (Zheng et al., 2014). Using this method, we found very similar proportions of pain adaptive (35%) and non-adaptive (65%) participants.
Naert et al. (2008) also reported inter-individual variability in the time-course of tonic heat pain. Pain adaptability was assessed by computing the difference between the last and first pain ratings to 7-min tonic heat (47°C) pain stimulation. Setting the cut-off value to 1 (of 10), three forms of responses were identified: 11% of participants reported increased then reduced pain, 55%, continuous increment in pain, and 34%, stable pain. These responses were referred to as pain adaptation, pain summation, and stable pain, respectively (Naert et al., 2008). Using this method, we found that the majority of our participants (85%) were pain non-adaptive. However, setting the cut-off value to 20 (of 100) revealed two groups of participants: pain adaptive (exhibiting pain adaptation or stable pain; 31%) and non-adaptive (or pain summation; 69%). Such proportions are slightly lower than those reported by Naert et al. (2008).
Interestingly, adaptation to both tonic cold and heat pain is related to the latency to peak. Indeed, both adaptive groups required significantly less time to reach peak pain sensation than non-adaptive ones. A recent study of tonic cold pain also found that the pain-adaptive group
17 had a shorter latency to peak than the non-adaptive one (Zheng et al., 2014). Other investigators reported that feeling pain faster was associated with being adaptive to tonic heat pain (Severin et al., 1985). Altogether, these results suggest an association between fast pain facilitation and fast pain inhibition (Zheng et al., 2014).
We also found that the type of temporal profiles to tonic cold and heat pain can be inferred from the intensity of initial pain. Indeed, high initial pain intensity was associated with either fast facilitation followed by fast inhibition (cold pain) or stable pain (heat pain), and low initial pain intensity with either fast followed by slow facilitation (cold pain) or slow and steady facilitation (heat pain). Although, Naert et al., (2008) did not specifically address this issue, their figure 2 clearly indicates that participants with high initial heat pain intensity are pain stable or adaptive whereas those with low initial pain intensity show pain summation. Polianskis et al. (2002) also found that the adaptability to tonic mechanical pain depends on the initial pain intensity. Finally, higher initial pain levels also correlate with habituation (Treister et al., 2010). In animals, the decrease in the number of spikes of WDR neurons (Coste et al., 2008) or the magnitude of spinal nociceptive reflexes (Gozariu et al., 1997) evoked by repetitive noxious cutaneous stimulation, that occurs after the initial increase, is more pronounced when initial responses are high. Likely, an inhibitory mechanism counteracts neuronal facilitation after high-intensity repetitive noxious stimulation or after tonic noxious stimulation. Overall, these data suggest that the adaptability to tonic thermal (present results) or mechanical (Polianskis et al., 2002) pain is related to the intensity of initial pain.
In agreement with previous studies (Streff et al., 2010), mean arterial BP varied during CIT and HIT. The time course of BP was similar in both immersion tests. However, CIT-evoked BP responses showed a steeper rise and a shorter time to peak than HIT-evoked ones. Variations in HR were also observed during CIT and HIT, but the time course of HR
18 responses during the two tests were different. We could not identify any relationship between the variations of cardiovascular responses and pain intensity. Previous reports have provided conflicting results on the association between cardiovascular reactivity and pain perception. Either no (Tousignant-Laflamme et al., 2005; Streff et al., 2010; Huang et al., 2011; Meeuse et al., 2013; Nilsen et al., 2014) or positive (Peckerman et al., 1991; Maixner and Humphrey, 1993; Fillingim et al., 2002; Tousignant-Laflamme et al., 2005; Treister et al., 2012) correlations were found. However, such correlations are usually weak and more frequently observed in men than women (Maixner and Humphrey, 1993; Fillingim et al., 2002; Tousignant-Laflamme et al., 2005). All these observations suggest that the autonomic system responds to heat or cold pain, but these responses do not reflect pain intensity.
Our study is one of the first addressing the issue of an association between pain adaptability and cardiovascular responses. There was no difference in the temporal profile and magnitude of the CIT- and HIT-evoked BP and HR responses between the adaptive and non-adaptive groups. Only the latency to peak BP during HIT was shorter in the non-adaptive compared with the non-adaptive group. Thus, although we found previously an association between BP reactivity to tonic cold stimulation and conditioned pain modulation (CPM) (Chalaye et al., 2013), in the present study, we found no association between the cardiovascular responses to tonic thermal stimulation and pain adaptability of adaptive and non-adaptive groups. This is in line with a recent study (Zheng et al., 2014) showing that pain adaptability does not correlate with the potency of the CPM. The absence of association between the adaptability to tonic thermal pain and cardiovascular responses suggest that other factors contribute to inter-individual variability in the time profiles of pain ratings to tonic thermal pain (Nielsen et al., 2009).
Many studies are reporting variability in pain perception among healthy subjects (Nielsen et al., 2007). This individual variability has been suggested to influence the risk of developing
19 chronic pain as well as the response to treatments. Using a tonic thermal stimulus model, we propose a computing method to identify the individual temporal profile of pain rating during both cold and heat tonic painful stimuli. We found that pain evoked by tonic cold and hot painful stimuli is a dynamic and complex process, including three phases: an increasing, a plateau and a decreasing phase. The time course of pain perception varies differently for cold and heat pain. Moreover, two groups of participants can be identified: one-third of participants are pain adaptive and the two other thirds non pain adaptive. The adaptability to tonic cold and heat pain is related to the initial pain rating and latency to peak pain, but not to cardiovascular responses. We conclude that this method may be useful to reveal the mechanisms underlying both normal and pathologic sensitivity to pain and could eventually contribute to better understand individual pain perception characteristics and variable responses to pain treatment. Thus, the non adaptive individuals to heat or cold pain may experience prolonged and more intense pain sensation following injury. These individuals may also require longer-term analgesic treatments and could be more susceptible to develop chronic pain.
20 Author contributions
All authors had full access to all the data in the study and take responsibility for the integrity of the data and the accuracy of the data analysis. Study concept and design: LD, PC, SL, SM. Acquisition of data: LD, SL, PC. Analysis and interpretation of data: LD, PC, SL, SM, RD. Drafting of the manuscript: LD, PC, SM, RD.
Acknowledgements
This research was supported by Pr. Marchand’s research grants from CIHR (Canada) and FRSQ (Québec). Laurent Devoize would like to thank “La fondation de l’Université d’Auvergne Clermont 1, France” for her financial support. The authors also wish to thank all subjects for their participation.
21 REFERENCES
Abrishami, A., Chan, J., Chung, F., Wong, J. (2011). Preoperative pain sensitivity and its correlation with postoperative pain and analgesic consumption: a qualitative systematic review. Anesthesiology 114, 445-57.
Bruehl, S., Chung, O.Y. (2004). Interactions between the cardiovascular and pain regulatory systems: an updated review of mechanisms and possible alterations in chronic pain. Neurosci Biobehav Rev 28, 395-414.
Casey, K.L., Minoshima, S., Morrow, T;J., Koeppe, R.A. (1996). Comparison of human cerebral activation pattern during cutaneous warmth., heat pain., and deep cold pain. J Neurophysiol 76, 571-81.
Chalaye, P., Devoize, L., Lafrenaye, S., Dallel, R., Marchand, S. (2013). Cardiovascular influences on conditioned pain modulation. Pain 154, 1377-82.
Chen, A.C., Dworkin, S.F., Haug, J., Gehrig, J. (1989). Human pain responsivity in a tonic pain model: psychological determinants. Pain 37, 143-60.
Coste, J., Voisin, D.L., Luccarini, P., Dallel, R. (2008). A role for wind-up in trigeminal sensory processing: intensity coding of nociceptive stimuli in the rat. Cephalalgia 28, 631-9.
Craig, A.D. (2002). How do you feel? Interoception: the sense of the physiological condition of the body. Nat Rev Neurosci 3, 655-66.
Ernst, M., Lee, M.H., Dworkin, B., Zaretsky, H.H. (1986). Pain perception decrement produced through repeated stimulation. Pain 26, 221-231.
Fagius, J., Karhuvaara, S., Sundlof, G. (1989). The cold pressor test: effects on sympathetic nerve activity in human muscle and skin nerve fascicles. Acta Physiol Scand 137, 325-34.
22 Fillingim, R.B., Browning, A.D., Powell, T., Wright, R.A. (2002). Sex differences in perceptual and cardiovascular responses to pain: the influence of a perceived ability manipulation. J Pain 3, 439-4.
Gozariu, M., Bragard, D., Willer, J.C., Le Bars, D. (1997). Temporal summation of C-fiber afferent inputs: competition between facilitatory and inhibitory effects on C-fiber reflex in the rat. J Neurophysiol 78, 3165-79.
Granot, M., Weissman-Fogel, I., Crispel, Y., Pud, D., Granovsky, Y., Sprecher, E., Yarnitsky, D. (2008). Determinants of endogenous analgesia magnitude in a diffuse noxious inhibitory control (DNIC) paradigm: Do conditioning stimulus painfulness, gender and personality variables matter? Pain 136, 142–9.
Hollins, M., Harper, D., Maixner, W. (2011). Changes in pain from a repetitive thermal stimulus: The roles of adaptation and sensitization. Pain 152, 1583-1590.
Huang, C.M., Chang, HC., Kao, S.T., Li, T.C., Wei, C.C., Chen, C., Liao, Y.T., Chen, F.J. (2011). Radial pressure pulse and heart rate variability in heat- and cold-stressed humans. Evid Based Complement Alternat Med 2011, 751317.
Kreh, A., Anton, F., Gilly, H., Handwerker, H.O. (1984). Vascular reactions correlated with pain due to cold. Exp Neurol 85,533-46.
Lautenbacher, S., Roscher, S., Strian, F. (1995). Tonic pain evoked by pulsating heat: temporal summation mechanisms and perceptual qualities. Somatosens Mot Res 12, 59-70. Maixner, W., Humphrey, C. (1993). Gender differences in pain and cardiovascular responses
to forearm ischemia. Clin J Pain 9, 16-25.
Martina, .JR., Westerhof, B.E., van Goudoever, J., de Beaumont, E.M., Truijen, J., Kim, Y.S., Immink, R.V., Jöbsis, D.A., Hollmann, M.W., Lahpor, J.R., de Mol, B.A., van Lieshout, J.J. (2012). Noninvasive continuous arterial blood pressure monitoring with Nexfin®. Anesthesiology 116, 1092-103.
23 May, A., Rodriguez-Raecke, R., Schulte, A., Ihle, K., Breimhorst, M., Birklein, F., Jurgens, T.P. (2012). Within-session sensitization and between-session habituation: A robust physiological response to repetitive painful heat stimulation. Eur J Pain 16, 401-409. Meeuse, J.J., Löwik, MS., Löwik, S.A., Aarden, E., van Roon, A.M., Gans, R.O., van Wijhe,
M., Lefrandt, J.D., Reyners, A.K. (2013). Heart rate variability parameters do not correlate with pain intensity in healthy volunteers. Pain Med 14, 1192-201.
Milne, R.J., Kay, N.E., Irwin, R.J. (1991). Habituation to repeated painful and non-painful cutaneous stimuli: A quantitative psychophysical study. Exp Brain Res 87, 438-444.
Naert, A.L., Kehlet, H., Kupers, R. (2008). Characterization of a novel model of tonic heat pain stimulation in healthy volunteers. Pain 138, 163-71.
Nilsen, K.B., Olsen, I.C., Solem, A.N., Matre, D. (2014). A large conditioned pain modulation response is not related to a large blood pressure response: A study in healthy men. Eur J Pain 8, 1271-9.
Nielsen, C.S., Staud, R., Price, D.D. (2009). Individual differences in pain sensitivity: measurement., causation., and consequences. J Pain 10, 231-7.
Peckerman, A., Saab, P.G., McCabe, P.M., Skyler, JS., Winters, R.W., Llabre, M.M., Schneiderman, N. (1991). Blood pressure reactivity and perception of pain during the forehead cold pressor test. Psychophysiology 28, 485-95.
Peng, Y.B., Ringkamp, M., Meyer, R.A., Campbell, J.N. (2003). Fatigue and paradoxical enhancement of heat response in C-fiber nociceptors from crossmodal excitation. J Neurosci 23, 4766–4774.
Polianskis, R., Graven-Nielsen, T., Arendt-Nielsen, L. (2002). Pressure-pain function in desensitized and hypersensitized muscle and skin assessed by cuff algometry. J Pain 3, 28-37
24 Rainville P., Feine J.S., Bushnell M.C., Duncan G.H. (1992). A psychophysical comparison of sensory and affective responses to four modalities of experimental pain. Somatosens Mot Res 9, 265-77.
Severin, F., Lehmann, W.P., Strian, F. (1985). Subjective sensitization to tonic heat as an indicator of thermal pain. Pain 21, 369-78.
Streff, A., Kuehl, L.K., Michaux, G., Anton, F. (2010). Differential physiological effects during tonic painful hand immersion tests using hot and ice water. Eur J Pain 14, 266-72. Tiseo, PJ., Adler, M.W., Liu-Chen, L.Y. (1990). Differential release of substance P and
somatostatin in the rat spinal cord in response to noxious cold and heat effect of dynorphin A(1-17). J Pharmacol Exp Ther 252, 539-45.
Todd, K.H., Funk, K.G., Funk, J.P., Bonacci, R. (1996). Clinical significance of reported changes in pain severity. Ann Emerg Med 27, 485-9.
Tousignant-Laflamme, Y., Rainville, P., Marchand, S. (2005). Establishing a link between heart rate and pain in healthy subjects: a gender effect. J Pain 6, 341-7.
Treede, R.D., Meyer, R.A., Raja, S.N., Campbell, J.N. (1995). Evidence for two different heat transduction mechanisms in nociceptive primary afferents innervating monkey skin. J Physiol (Lond) 483, 747–758.
Treister, R., Eisenberg, E., Gershon, E., Haddad, M., Pud, D. (2010). Factors affecting - and relationships between-different modes of endogenous pain modulation in healthy volunteers. Eur J Pain. 14, 608-14.
Treister, R., Kliger, M., Zuckerman, G., Goor Aryeh, I., Eisenberg, E. (2012). Differentiating between heat pain intensities: the combined effect of multiple autonomic parameters. Pain 153, 1807-14.
Weissman-Fogel, I., Dror, A., Defrin, R. (2015). Temporal and spatial aspects of experimental tonic pain: Understanding pain adaptation and intensification. Eur J Pain (in press).
25 Wolf, S., Hardy, J.D. (1941). Studies on pain. Observations on pain due to local cooling and
factors involved in the “Cold Pressor” effect. J Clin Invest 20, 521-33.
Zhao, H., Chen, A.C. (2009). Both happy and sad melodies modulate tonic human heat pain. J Pain 10, 953-60.
Zheng, Z., Wang, K., Yao, D., Xue, C.C., Arendt-Nielsen, L. (2014). Adaptability to pain is associated with potency of local pain inhibition, but not conditioned pain modulation: a healthy human study. Pain 155, 968-76.
26 LEGENDS OF FIGURES
Figure 1. Pain perception and cardiovascular responses to tonic painful thermal stimuli. Time course of the pain sensation intensity (A), the pain unpleasantness intensity (B), the arterial blood pressure (C), the heart rate (D) during heat (47.5 ± 0.5°C, duration 5 min) and cold immersion tests (7 ± 0.2°C, duration 5 min).
Figure 2. Pain perception and cardiovascular responses of adaptive and non adaptive subjects during tonic painful cold stimulation (7 ± 0.2°C, duration 5 min). Time course of the pain sensation intensity (A), the pain unpleasantness intensity (B), the arterial blood pressure (C) and the heart rate (D), during cold immersion tests.
Figure 3. Pain perception and cardiovascular responses of adaptive and non adaptive subjects during tonic painful heat stimulation (47.5 ± 0.5°C, duration 5 min). Time course of the pain sensation intensity (A), the pain unpleasantness intensity (B), the arterial blood pressure (C) and the heart rate (D), during heat immersion tests.
Table 1. Characteristics of pain sensation and pain unpleasantness to tonic painful cold and heat stimulation
Values denote mean ± standard error of the mean. Statistically significant difference in response to cold and heat stimulation (paired Student’s t test)
Pain sensation Pain unpleasantness
Cold (n=26) Heat (n=26) P value Cold (n=26) Heat (n=26) P value First pain intensity 31 ± 4 27 ± 4 0.157 37 ± 6 20 ± 4 0.004 Peak pain intensity 76 ± 3 68 ± 4 0.044 74 ± 3 62 ± 5 0.014 Last pain intensity 56 ± 3 64 ± 5 0.122 55 ± 5 55 ± 6 0.943 Average pain intensity 58 ± 3 46 ± 4 < 0.001 58 ± 4 41 ± 4 <0,001 Latency to peak (sec) 148 ± 16 210 ± 18 0.013 113 ± 14 171 ± 19 0.017
Table 2. Characteristics of pain sensation and pain unpleasantness to tonic painful cold and heat stimulation in pain adaptive and non- adaptive groups
A. Characteristics of pain sensation and pain unpleasantness to tonic painful cold stimulation in pain adaptive and non- adaptive groups
B. Characteristics of pain sensation and pain unpleasantness to tonic painful heat stimulation in pain adaptive and non- adaptive groups
Values denote mean ± standard error of the mean. Statistically significant difference in response to cold and heat stimulation (unpaired Student’s t test).
Pain sensation Pain unpleasantness
Adaptive group (n=9) Non-adaptive group (n=17) P value Adaptive group (n=9) Non-adaptive group (n=17) P value First pain intensity 46 ± 10 24 ± 4 0.016 47 ± 11 32 ± 6 0.209
Peak pain intensity 81 ± 4 73 ± 3 0.14 77 ± 6 73 ± 4 0.013
Last pain intensity 42 ± 5 64 ± 3 0.001 40 ± 8 63 ± 5 0.517
Average pain intensity 60 ± 5 57 ± 3 0.667 57 ± 7 58 ± 4 0.857 Latency to peak (sec) 80 ± 15 184 ± 18 <0.001 77 ± 23 131 ± 17 0.069
Pain sensation Pain unpleasantness
Adaptive group (n=8) Non-adaptive group (n=18) P value Adaptive group (n=8) Non-adaptive group (n=18) P value First pain intensity 47 ± 10 18 ± 4 0.017 36 ± 10 12 ± 4 0.028
Peak pain intensity 60 ± 9 72 ± 5 0.182 57 ± 12 64 ± 6 0.597
Last pain intensity 49 ± 11 70 ± 5 0.049 43 ± 10 60 ± 6 0.153 Average pain intensity 48 ± 10 46 ± 4 0.824 42 ± 9 41 ± 5 0.868 Latency to peak (sec) 113 ± 36 253 ± 11 <0.001 77 ± 18 213 ± 18 <0.001
Table 3. Cardiovascular parameters at rest (baseline) and during painful cold and heat stimulation
Values denote mean ± standard error of the mean. Statistically significant difference in
response to cold and heat stimulation (paired Student’s t test). * Statistically significant
difference form baseline (paired Student’s t test).
Blood pressure (mm Hg) Heart rate (beats/min)
Cold (n = 26) Heat (n = 26) P value Cold (n = 26) Heat (n = 26) P value Baseline 92.2 ± 2.4 89.4 ± 2.1 0.400 74.1 ± 2.2 73.7 ± 1.6 0.886 First response 88.4 ± 3.7 91.0 ± 2.3 0.514 84.8 ± 3.2* 85.0 ± 2.5* 0.850 Peak response 125.4 ± 32.9* 110.0 ± 2.3* <0.001 88.9 ±3.1* 91.3 ± 2.0* 0.249 Last response 114.0 ± 2.5* 100.2 ± 3.0* <0.001 74.4± 2.3ns 87.1 ± 1.8* <0.001 Average response 113.4 ± 2.4* 100.2 ± 2.3* <0.001 78.7 ± 2.4* 83.3 ± 1.9* 0.010 Latency to peak (sec) 144.2 ± 11.7 196.2 ± 18.7 0.034 42.7 ± 8.8 183.5 ± 21.3 <0.001
Table S1. Temporal profile of blood pressure and heart rate to tonic painful cold and heat stimulation
A. Cardiovascular parameters at rest (baseline) and during tonic painful cold stimulation in pain adaptive and non-adaptive groups
B. Cardiovascular parameters at rest (baseline) and during tonic painful heat stimulation in pain adaptive and non-adaptive groups
Values denote mean ± standard error of the mean. Statistically significant difference in response to cold and heat stimulation (unpaired Student’s t test).
Blood pressure (mm Hg) Heart rate (beats/min Adaptive group (n=9) Non-adaptive group (n=17) P value Adaptive group (n=9) Non-adaptive group (n=17) P value Baseline 92 ± 4 92 ± 3 0.847 76 ± 4 73 ±3 0.458 First response 89 ± 6 88 ± 5 0.952 89 ± 5 83 ± 4 0.369 Peak response 116 ± 3 113 ± 4 0.536 75 ± 3 74 ± 3 0.947 Last response 129 ± 4 123 ± 4 0.348 91 ± 5 88 ± 4 0.596 Average response 116 ± 4 112 ± 3 0.360 80 ± 4 78 ± 3 0.737
Latency to peak (sec) 128 ± 16 153 ± 16 0.335 27 ± 7 51 ± 13 0.305
Blood pressure (mm Hg) Heart rate (beats/min) Adaptive group (n=8) Non-adaptive group (n=18) P value Adaptive group (n=8) Non-adaptive group (n=18) P value Baseline 87 ± 1 90 ± 3 0.557 70 ± 2 75 ± 2 0.160 First response 91 ± 4 91 ± 3 0.908 80 ± 4 87 ± 3 0.205 Peak response 101 ± 3 100 ± 4 0.918 83 ± 2 89 ± 2 0.098 Last response 110 ± 3 110 ± 3 0.945 87 ± 2 93 ± 3 0.107 Average response 101 ± 2 100 ± 3 0.869 78 ± 2 85 ± 2 0.072