HAL Id: hal-03007429
https://hal-amu.archives-ouvertes.fr/hal-03007429
Submitted on 16 Nov 2020
HAL is a multi-disciplinary open access
archive for the deposit and dissemination of
sci-entific research documents, whether they are
pub-lished or not. The documents may come from
teaching and research institutions in France or
abroad, or from public or private research centers.
L’archive ouverte pluridisciplinaire HAL, est
destinée au dépôt et à la diffusion de documents
scientifiques de niveau recherche, publiés ou non,
émanant des établissements d’enseignement et de
recherche français ou étrangers, des laboratoires
publics ou privés.
Distributed under a Creative Commons Attribution| 4.0 International License
terminal event during oxygen–glucose deprivation in
brain slices in vitro
Elvira Juzekaeva, Azat R. Gainutdinov, Marat Mukhtarov, Roustem Khazipov
To cite this version:
Elvira Juzekaeva, Azat R. Gainutdinov, Marat Mukhtarov, Roustem Khazipov. Reappraisal of anoxic
spreading depolarization as a terminal event during oxygen–glucose deprivation in brain slices in vitro.
Scientific Reports, Nature Publishing Group, 2020, 10 (1), pp.18970. �10.1038/s41598-020-75975-w�.
�hal-03007429�
Reappraisal of anoxic spreading
depolarization as a terminal event
during oxygen–glucose deprivation
in brain slices in vitro
Elvira Juzekaeva
1,3, Azat Gainutdinov
1,3, Marat Mukhtarov
1& Roustem Khazipov
1,2*Anoxic spreading depolarization (aSD) has been hypothesized as a terminal event during oxygen– glucose deprivation (OGD) in submerged cortical slices in vitro. However, mechanical artifacts caused by aSD-triggered edema may introduce error in the assessment of neuronal viability. Here, using continuous patch-clamp recordings from submerged rat cortical slices, we first confirmed that vast majority of L4 neurons permanently lost their membrane potential during OGD-induced aSD. In some recordings, spontaneous transition from whole-cell to out-side out configuration occurred during or after aSD, and only a small fraction of neurons survived aSD with reperfusion started shortly after aSD. Secondly, to minimize artifacts caused by OGD-induced edema, cells were short-term patched following OGD episodes of various duration. Nearly half of L4 cells maintained membrane potential and showed the ability to spike-fire if reperfusion started less than 10 min after aSD. The probability of finding live neurons progressively decreased at longer reperfusion delays at a rate of about 2% per minute. We also found that neurons in L2/3 show nearly threefold higher resistance to OGD than neurons in L4. Our results suggest that in the OGD ischemia model, aSD is not a terminal event, and that the “commitment point” of irreversible damage occurs at variable delays, in the range of tens of minutes, after OGD-induced aSD in submerged cortical slices.
Duration of ischemia is the key factor determining neuronal survival, neurological, and behavioral outcome. During global brain ischemia caused by cardiac arrest, irreversible loss of brain function and legal death are conventionally thought to occur within 5–10 min of cardiac arrest1. Paradoxically, however, neuronal function
can be restored even after much longer periods of global ischemia under several experimental settings includ-ing extracorporeal reperfusion with special cytoprotective reperfusate up to 4 h after cardiac arrest in pigs2 or
maintenance of rat brain slices that were prepared 1–6 h after cardiac arrest3, or after 30 min middle cerebral
artery occlusion4, in ACSF. These observations raised the hypothesis that neurons may survive much longer
episodes of ischemia than traditionally thought, thus opening questions for further research on the possibility of expanding the time window for resuscitation.
Development of brain injury during ischemia proceeds through the initial phase of compensation, during which brain activity ceases but neurons maintain their membrane potential, and recovery of cardiovascular function restores brain activity without major damage to the brain1,5,6. Passage to the decompensation phase
is associated with a wave of collective and nearly complete neuronal depolarization, so-called anoxic spread-ing depolarization (aSD) occurrspread-ing at ~ 5 min after the onset of ischemia5,7,8. Generation of aSD is caused by
depletion of intracellular reserves of energy metabolites, loss of function of the energy-dependent active ion transporters and rupture in transmembrane ionic gradients5,7,8. aSD is a highly energy-demanding event which
severely aggravates metabolic status9. Considerable evidence indicates that aSD is the key ischemic event that
triggers cascades of intracellular reactions leading to acute and delayed neuronal death5,7,8. Similarly, periinfarct
depolarizations (PIDs) severely compromise the metabolic state in the penumbra and cause expansion of the ischemic core during the development of the focal ischemic injury10.
The oxygen–glucose deprivation (OGD) model of an ischemia-like condition has been extensively used to explore acute changes in neuronal function during metabolic insult in brain slices in vitro. In this model, metabolite deprivation causes a series of events largely recapitulating the development of ischemic injury
OPEN
1Laboratory of Neurobiology, Kazan Federal University, Kazan 420008, Russia. 2INMED/INSERM UMR1249,
Aix-Marseille University, 163 Avenue de Luminy BP13, 13273 Marseille Cedex 09, France. 3These authors
in vivo, including aSD and ischemic neuronal death. OGD-induced aSD develops within 5–10 min of the onset of perfusion with OGD-solution, it is associated with a wave of collective neuronal depolarization and a drop in electrical membrane resistance, large negative shifts of the extracellular local field potential (LFP) and an increase in tissue light transmittance11–16. OGD-induced aSD has been described in slices of
neocortex13,16–20, hippocampus12,14,15,21–24, striatum25, thalamus26,27 and cerebellar cortex28, but not subthalamic
brain structures18,26,29. Also, aSD heralds the development of tissue edema manifested by the expansion of brain
slice borders, elevation of the slice surface, and massive tissue shifts within the slice30,31. However, at difference to
ischemia in vivo, where neuronal functions can be, at least partially, preserved when perfusion/oxygen supply is reestablished at delay of 30 min–6 h after the ischemia onset2–5, occurrence of aSD is considered as a “terminal”,
i.e. irreversible event during OGD in submerged slices in vitro8. Indeed, intracellular sharp electrode recordings
from submerged hippocampal slices revealed that CA1 neurons irreversibly lost their membrane potential and synaptic responses during OGD even if reoxygenation started 1 min after aSD14,15. Similarly, whole-cell
record-ings from neocortex and hippocampus in vitro showed that even when oxygen and glucose were reintroduced to the brain slice immediately or few minutes after aSD, the membrane potential was irreversibly lost12,16,18,21.
Along with these findings, extracellular recordings of responses evoked by afferents electrical stimulation were permanently lost during OGD even if reperfusion with oxygenated ACSF started shortly after aSD both in hip-pocampus and neocortex12,13,20–22. These observations led to the conclusion that at difference to aSD in vivo, aSD
in submerged slices of cortex and hippocampus is a lethal terminal event12–16,18,20–22. However, massive tissue
shifts and mechanical displacement of neurons from the recording electrodes caused by tissue swelling, which starts to develop after aSD30–32 could severely compromise recordings and introduce error in the assessment of
neuronal viability. Therefore, in the present study we reexamined the hypothesis of aSD as a terminal event dur-ing OGD, takdur-ing into account the methodical constraints imposed by ischemic edema. In this aim, we estimated neuronal survival by short-term patching of neurons following reperfusion started at various delays after aSD. We provide evidence that aSD is not a terminal event during OGD in submerged cortical slices, as previously thought, and that the “commitment point” of irreversible loss of membrane potential and neuronal function occurs at variable and much longer delays, in the range of tens of minutes, after aSD, in the OGD model of ischemia in vitro. Our findings also suggest that the OGD model of ischemia in vitro could be useful in further explorations of neuroprotective interventions that could stop the progression of neuronal damage initiated by aSD during the post-aSD period.
Results
Continuous patch-clamp recordings through OGD and reperfusion.
In the present study weexplored neuronal survival during OGD in slices of the barrel cortex using whole-cell patch clamp recordings and concomitant extracellular recordings of LFP, and optical intrinsic signals (OIS) imaging. To this aim we used two types of neuronal survival assessment. In the first approach, we performed continuous recordings from a single neuron starting from control conditions and then through OGD and reperfusion. In the second approach, we sampled cells using short-term patch-clamp recordings in control conditions and during reperfusion follow-ing OGD of various durations (from 1 to 60 min). Both approaches were used in the same slices (n = 33) of the rat barrel cortex.
During continuous recordings, under control conditions L4 neurons had a membrane potential (Em) of
(median (Q1–Q3): − 68.4 (− 74.8 to − 61.7) mV, a membrane resistance (Rm) of 96.3 (55.7–132.1) MΩ and
fired APs in response to suprathreshold depolarizing current steps, which were applied every 10 s to monitor the change in Rm through the entire duration of recordings (Fig. 1a–c, note that Em traces are low-pass filtered
to remove spikes, and that Em corresponds to the bottom values of the Em trace). Perfusion with OGD-solution
evoked aSD in all neurons at a delay of 5.1 (4.3–8.2) min after OGD onset. aSD was manifested by rapid neuronal depolarization to − 13.6 (− 27.9 to − 7.2) mV (p = 3.0E−12, hereinafter Wilcoxon rank sum test) and occurred simultaneously with a negative shift in extracellular LFP of − 5.6 (− 8.7 to − 3.1) mV in concomitant DC-LFP recordings in the vicinity of the recorded neuron, and an increase in light transparency by 15.3 (9.4–21.3) % in OIS recordings. During aSD, Rm dropped to 10.3 (4.1–29.7) MΩ (p = 6.7E−08). Also, ischemic edema and
mechanical slice tissue displacement started developing shortly after aSD as assessed by expansion of the slice borders (Fig. 1d). These observations are in keeping with previous studies using the OGD model13,16–19,22,31–34.
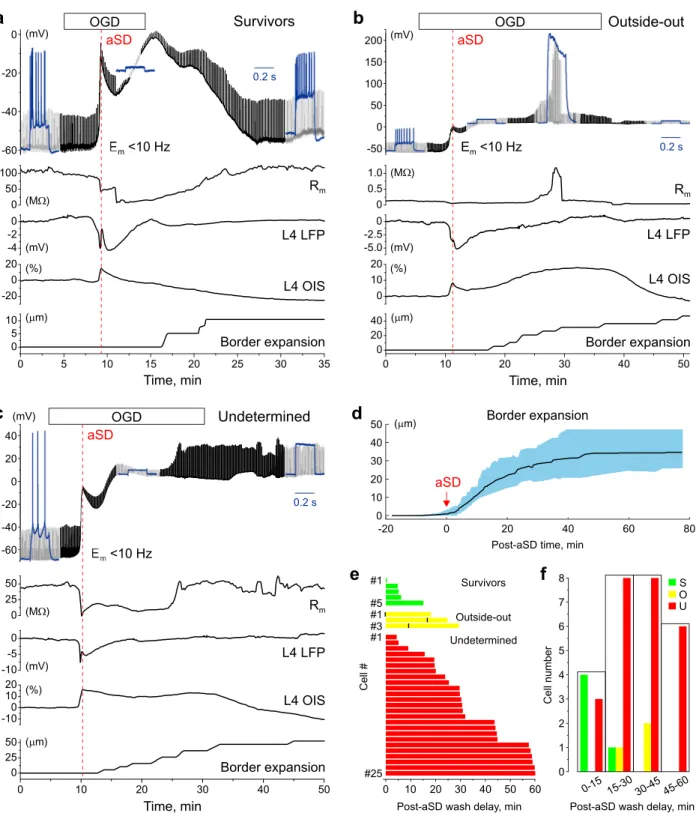
Further developments after aSD varied between cells and depended on OGD duration (Fig. 1e,f). We sorted neurons into three categories depending on the functional outcome after OGD, based on the parameters Em, Rm
and ability to fire APs in response to depolarizing steps: (1) survivors (Fig. 1a); (2) cells lost during recordings due to a transition from whole-cell to outside-out (Fig. 1b); and (3) cells which apparently did not show func-tional recovery after OGD, but due to uncertainty in the cause (cell death or cell loss due to a loss of electrical contact with the cell due to displacement during tissue edema) were classified as undetermined cases (Fig. 1c).
Survivors. Only a small minority of L4 neurons recovered during reperfusion (n = 5 neurons of 33, 15%) when
reperfusion was started shortly, within a few minutes, after aSD (5.2 (3.7–8.9) min) (Fig. 1a,e,f). Only one neu-ron survived an OGD episode in which reperfusion started 15 min after aSD. Survivor neuneu-rons displayed an Em
of − 70.6 (− 76.1 to − 47.2) mV and Rm of 119.9 (111.5–156.6) MΩ compared to control values for this group of
− 75.3 (− 77.9 to − 61.4) mV (p = 0.55) and 100.9 (83.9–132.9) MΩ (p = 0.31), and they recovered their ability to fire APs upon repolarization during reperfusion. Used as a metric of edema, border expansion had a tendency to start later 6.7 (2.4–9.2) min, and attain lower values of 21.2 (18.4–39.6) μm compared to other outcomes: 2.3 (− 1.1 to 4.4) min and 40.6 (29.9–55.0) μm for outside-out cases and 3.7 (1.5–5.4) min and 36.6 (30.2–44.6) μm for undetermined cases, but this difference was not significant (p = 0.29 for Survivors/Outside-out, p = 0.29 for Survivors/Undetermined and p = 0.67 for Outside-out/Undetermined).
d
-20 0 20 40 60 80
Post-aSD time, min 0 10 20 30 40 50 Border expansion aSD
a
Time, min 100 0 50 -4 -20 -20 0 20 0 5 10 15 20 25 30 35 0 5 10 L4 LFP L4 OIS Border expansion Rm -60 -40 -20 0 OGD <10 Hz m<10 Hz m 0.2 s aSD Survivorsb
Time, min 0 0.5 1.0 -5.0 -2.50 0 10 20 0 10 20 30 40 50 0 20 40 -50 0 50 100 150 200 OGD 0.2 s aSD L4 LFP L4 OIS Border expansion Rm E <10 Hzm Outside-outc
0 25 50 -10 -5 0 -100 10 20 0 10 20 30 40 50 0 25 50 Time, min -60 -40 -20 0 20 40 OGD L4 LFP L4 OIS Border expansion Rm <10 Hz <10 Hz 0.2 s aSD Undeterminede
0 10 20 30 40 50 60 Post-aSD wash delay, minSurvivors Outside-out Undetermined #1 #5 #1 #3 #1 #25 #ll e C
f
0-15 15-30 30-4545-60 0 1 2 3 4 5 6 7 re b mu nll e CPost-aSD wash delay, min
8 S O U ( m) ( m) ( m) (%) (mV) (M ) (mV) (mV) (M ) (mV) (%) ( m) (%) (mV) (M ) (mV)
Figure 1. Variety of electrophysiological outcomes during continuous whole-cell recordings through the oxygen–glucose deprivation
and reperfusion. (a–c) Example traces of continuous recordings from L4 neurons in current-clamp mode starting from control conditions and then through OGD of various durations and then reperfusion. The upper black traces show Em (10 Hz low-pass filtered to remove spikes), regular upward deflections show Em deflections evoked by depolarizing steps to monitor cell firing and Rm. Blue insets show cell responses (non-filtered signal) to depolarizing current steps in control conditions, after OGD-induced aSD and after reperfusion. Below, the corresponding changes in membrane resistance, DC-LFP and OIS recordings from L4, and the time course of the OGD-induced border expansion from control position are shown. Example traces for three categories of cells depending on their functional outcome after OGD: (a) Survivor, which transiently depolarized during aSD but recovered Em, Rm and firing ability during reperfusion; (b) Cell lost during transition to outside-out, manifested as a sharp increase in Rm during reperfusion to > 1GΩ values and (c) Undetermined case which showed no recovery of Em nor ability for spike firing upon reperfusion. (d) Average change in the OGD-induced border expansion (shaded area shows SD). Data are referenced to aSD time = 0. (e) Raster plot of outcomes (as shown on panels a–c) as a function of reperfusion delay after OGD-induced aSD. For outside-out transitions, the time points of transition to “gigaseal” are indicated by black vertical bars. (f) Histograms of the cell count in each outcome category depending on reperfusion delay after aSD. (d,e) Group data from 33 L4 neurons.
Lost during transition to outside‑out. Three cells of 33 (9%) showed spontaneous transition from whole-cell to
outside-out configuration as evidenced by an increase in Rm to > 1 GΩ (1.9 (1.3–2.0) GΩ, range from 1.1 to 2.1
GΩ) (Fig. 1b,e,f). This transition occurred at variable delays after aSD (9.2 (1.9–14.8) min) during OGD episodes in which reperfusion started from 17.6 to 29.3 min (24.8 (19.4–28.1) min) after aSD, and it was typically tran-sient with further rupture of the patch evidenced by a drop in Rm. Neither Em [− 1.3 (− 5.5 to 6.6) mV] compared
to control value of − 57.5 (− 63.7 to − 56.2) mV (p = 0.029) nor the ability to fire APs recovered in these cases.
Undetermined. This was the most frequent category of outcomes from OGD (n = 25 cells of 33, 76%) observed
through the entire span of OGD durations (reperfusion delay after aSD from 4 to 60 min, average 30.7 (23.6– 48.6) min) (Fig. 1c,e,f). All undetermined cases did not show recovery of Em during reperfusion (− 2.3 (− 8.2 to
6.3) mV), measured 10–15 min after reperfusion onset, compared to control value of − 69.2 (− 74.4 to − 61.9) mV (p = 1.4E−09) and displayed a variable change in Rm (from 3.4 to 723.1 MΩ), average 54.6 (28.4–208.3) MΩ,
compared to control value of 89.0 (54.2–116.6) MΩ (p = 0.07). None of these cases showed APs in response to depolarizing steps from negative, close to pre-OGD Em maintained by constant negative current injection
(not shown). These predominant cases of outcomes were classified as dead neurons in previous studies12,14–16,18.
However, taking into account the major methodical constraints imposed by ischemic edema31–33 which starts to
develop after aSD, and which may severely compromise recordings (as clearly evidenced by transitions to out-side-out) we assigned this category as undetermined cases with the hypothesis that some of these cells actually survive but are lost during recordings due to edemic tissue displacement and thus the survival rate is probably underestimated during continuous recordings.
Short-term patch-clamp recordings.
To overcome the problem of edema we short-term patched cells during the reperfusion phase after OGD of various durations. Recording sessions started 20 min after reperfu-sion onset and lasted in each cell for ~ 1 min. According to the estimates of slice surface displacement during OGD-induced edema (~ 2 μm min−131), cell displacement from the patch-pipette during such short-termrecord-ings should not affect assessment of neuronal viability. For each cell patched in these experiments we estimated Em, Rm and ability to fire APs in response to depolarizing current steps before and after OGD episodes (Fig. 2a).
Under control conditions, 122 of 128 (95%) cells from 29 slices patched in L4 displayed features of live neurons with a membrane potential (Em) of − 71.5 (− 75.9 to − 66.9) mV, membrane resistance (Rm) of 104.8 (73.5–148.8)
MΩ, and APs in response to suprathreshold depolarizing current steps (Figs. 2b, 3a,c,d). The remaining 6 (5%) cells had a depolarized Em of − 31.1 (− 56.6 to − 7.3) mV, Rm of 240.0 (38.0–380.7) MΩ, and did not fire in
response to depolarizing steps from − 60/− 70 mV. Cells patched after reperfusion in the post-OGD epoch were classified according to similar criteria as for the continuous recordings above. These included two main catego-ries, (1) Live neurons–survivors, and (2) Others.
(1) Live neurons in post-OGD slices (n = 19, 28% of the total 69 patched cells from 29 slices) were characterized by an Em of − 65.6 (− 70.6 to − 56.4) mV, that was + 5.9 mV more positive than that in control conditions
(p = 0.0056)35,36, R
m of 145.7 (129.9–176.6) MΩ, that was 1.5 fold higher than that in control conditions
(p = 0.0012), and they all fired APs in response to depolarizing steps from rest (Figs. 2c, 3a,c,d). Neither Em (R2 = 0.000554, p = 0.924) nor Rm (R2 = 0.045, p = 0.383) showed any correlation with the time delay of
reperfusion after aSD. Live neurons could be found in OGD-exposed slices with reperfusion started at delay of up to 45 min after aSD (Fig. 3a,b). The proportion of live neurons among all cells patched in a slice was highly variable between slices and progressively decreased with increase in the delay of reperfusion onset after aSD (Fig. 3b). The linear fit provided a slope of − 1.9 ± 0.2%·min−1 for the probability of finding live
cells in L4 as a function of delay of reperfusion after aSD.
(2) The other L4 cells patched in post-OGD slices (n = 50, 72% of the total 69 patched cells from 29 slices) dis-played high variability in electrophysiological characteristics and included live putative glial cells with very negative Em values, some of them presumably of oligodendrocyte lineage displaying high input resistance
and active electrogenic properties (Fig. 2d), and presumably dead cells of unknown origin with strongly depolarized or nearly zero membrane potential and extremely low membrane resistance (Fig. 2e). On average, these other cells in post-OGD slices had an Em of − 34.9 (− 65.9 to − 10.9) mV (p = 1E−10) and
Rm of 41.2 (28.9–68.6) MΩ (p = 4.3E−12) (Fig. 3c,d). None of the “other” type cells fired APs in response
to depolarizing current steps.
We also sampled cells in L2/3 using a similar approach as for L4. In control conditions 97% of cells (n = 77 of the total 79 patched cells from 16 slices) appeared to be live neurons with an ability to fire action potentials in response to depolarizing steps, Em of − 71.1 (− 75.5 to − 67.3) mV and Rm of 119.5 (72.2–224.7) MΩ (Fig. 4b,d,e).
In slices exposed to OGD and with reperfusion started 5–60 min after aSD, live neurons accounted the vast majority of all cells patched in L2/3 (n = 100, 82% of the total 122 patched cells from 25 slices; Fig. 4a,b) had an Em of − 69.0 (− 73.8 to − 62.0) mV depolarized by 2.1 mV comparing to the control value (p = 0.0124), and
Rm of 121.8 (91.7–224.8) MΩ that was not different from the control (p = 0.38) (Fig. 4d,e). As in L4, neither Em
(R2 = 0.000025, p = 0.962) nor R
m (R2 = 0.000909, p = 0.769) of the OGD-surviving neurons showed any
correla-tion with the time delay of reperfusion after aSD (Fig. 4b). With an increase in the OGD duration, the propor-tion of surviving neurons decreased by a slope of − 0.7 ± 0.2%·min−1 that was about threefold slower than for L4
(Fig. 4c). Even in slices that were reperfused at a delay of 60 min after aSD 54% of patched cells were live neurons (n = 7 of the total 13 patched cells) (Fig. 4b,f). The “other” L2/3 cells patched in post-OGD slices (n = 22, 18% of the total 122 patched cells from 25 slices) fired no APs in response to depolarizing current steps. On average,
a
OGD
aSD
1-60 min
Patching PatchingControl
post-OGD
0 200 400 600 800 -70 -60 -50 -40 E (mV) I (pA) E =m -68 mV R = 40 Mmb
-50 0 50 0.1 s E (mV) 800 I (pA)Live Neuron
Control
0
post-OGD
c
aSD + 20 min 0 100 200 300 400 -80 -70 -60 -50 -40 -30 I (pA) E =m -74 mV R = 113 Mm E (mV)Live Neuron
600 I (pA) -50 0 50 0.1 s E (mV) 0e
E (mV) E (mV) 0.1 s -1000 -10 -5 -15 I (pA) 0 - 04 40 - 08 -1 02 I (pA) E = 9m - mV R = 10 Mm -10 -20Putative dead cell
aSD + 15 min 0 0 100
d
-100 0 100 200 0.1 s - 020 100 50 0 -50 -100 -1 05 - 020 40 80 120 I (pA) E =m -86 mV R =m 4.2 G E (mV) E (mV) I (pA) aSD + 59 minPutative glial cell
0
Figure 2. Variety of electrophysiological outcomes from OGD using short-term whole-cell recordings. (a)
Scheme of the experiment. Cells were sampled using short-term (~ 1 min long) patch-clamp recordings in control conditions and during reperfusion following OGD of various durations (from 1 to 60 min after aSD). (b) Voltage responses (top traces) generated by current injections (bottom traces) recorded from a L4 neuron prior to OGD. The corresponding I-V plot is shown on the right, where the red line shows the range in which Rm was
measured, and Em and Rm are indicated on the right of the I-V curve. (c) Example traces obtained from a L4
neuron which survived OGD with reperfusion started 20 min after aSD. (d) L4 cell which survived OGD with reperfusion started 59 min after aSD, and which has been classified as a putative glial cell due to very negative Em, high Rm and inability for spike firing. (e) Putative dead cell with low Rm and strongly depolarized Em.
b
c
d
Control Live Neurons -100 -50 0 50 ** **** ** Post - OGD Other E (mV)m 100 101 102 103 *** **** ** ControlLive NeuronsPost - OGDOther R (Mm
a
0 20 40 60 80 100 0 10 20 30 40 50 60L4 Live neurons
Post-aSD wash delay, min Control (%) = 0.6 R2 0816 p= 0.00 2180 = Slope -1.9 ± 0.2 %·min-1 -100 -80 -60 -40 -20 0 10 20 30 40 50 60 = 0.000554 R2 p = 0.924 Live Neuron Other
L4 Membrane potential
Post-aSD wash delay, min Control
0
E (mV)m
Figure 3. OGD survival in L4 neurons using short-term patching approach. (a) Em of cells patched in L4 before
(left) and after OGD episodes (right) as a function of the onset of reperfusion delay after aSD. Each data point corresponds to an individual cell. Filled circles represent live L4 neurons with negative membrane potentials and the ability to fire spontaneously or in response to depolarizing steps. Open circles show data from “other” types of cells which did not fire action potentials as the main criterion for their exclusion from a pool of live neurons. The red dotted line shows no dependence of Em in survivor neurons on the onset of reperfusion delay after aSD.
Data from 128 control and 69 post-OGD cells. (b) The corresponding proportion of live neurons among all cells patched in L4 in a given slice (each dot represents one slice). The red dotted line represents a linear fit for the probability of finding a live neuron in L4 as a function of the onset of reperfusion delay after aSD. The intercept was fixed to the control value of cells viability of 95%. Data from 29 slices. (c) Em and (d) Rm values in L4 in live
neurons before OGD, and live L4 neurons and “other” cells in the post-OGD epoch (boxplots show median and 1st and 3nd quarantiles). Group data from 128 control and 69 post-OGD cells in 29 slices. (**p < 0.01, ***p < 0.001, ****p < 0.0001).
-120 -100
Control
Live NeuronsPost - OGDOther Em(mV -80 -60 -40 -20 0 * ns ns 101 ns * ** 102 103 Control
Live NeuronsPost - OGDOther R (Mm
E (mV)
0.1 s
I (pA)
L2/3 Post-OGD Live Neuron
a
b
d
-80 -40 0 40 0 400 800 E = 75m - mV R = 102 Mm I (pA) aSD + 44 min E (mV) 0 200 400 600 -80 -70 -60 -50 -40 -30 -20c
f
e
-100 -80 -60 -40 -20 0 L2/3 Membrane potential Live Neuron OtherPost-aSD wash delay, min Control E (mV)m 0 10 20 30 40 50 60 = 0.0 R2 00025 p= 0.962 Live neurons (%) L2/3 L4 0 10 20 30 40 50 60 0 20 40 60 80 100
Post-aSD wash delay, min = 0 0 p .00 353 L2/3 Live neurons 0 20 40 60 80 100 0 10 20 30 40 50 60
Post-aSD wash delay, min Control (%) = 0.80499 R2 p= 0.0782 = Slope -0.7 ± 0.2 %·min-1
Figure 4. Neurons in L2/3 show higher resistance to OGD than L4 neurons. (a) Voltage responses generated
by current injections in a L2/3 neuron in a slice which experienced OGD for more than 1 h, and in which reperfusion started at a delay of 59 min after aSD. Right, the corresponding I-V plot. (b) Em values in cells
patched in L2/3 before (left) and after OGD of various reperfusion delays after aSD onset (right). Each data point corresponds to an individual cell. Filled circles correspond to live L2/3 neurons, open circles correspond to “other” cells. The red dotted line shows no dependence of Em in survivor neurons on the onset of reperfusion
delay after aSD. Data from 79 control and 122 post-OGD cells. (c) The corresponding proportion of live neurons among all cells patched in L2/3 in a given slice (each dot represents one slice). The red dotted line represents a linear fit for the probability of finding a live neuron in L2/3 as a function of the onset of reperfusion delay after aSD. The intercept was fixed to the control value of cells viability of 97%. Data from 16 control and 25 post-OGD slices. (d) Em and (e) Rm values in L2/3 in live neurons before OGD, and live L2/3 neurons and “other” cells in
the post-OGD epoch (boxplots show median and 1st and 3nd quarantiles). Group data from 79 control cells in 16 slices and 122 post-OGD cells in 25 slices. (*p < 0.05, **p < 0.01). (f) Histogram plots of the probability of finding a live neuron in L2/3 and L4 as a function of the onset of reperfusion delay after aSD. Group data from 122 L2/3 cells in 25 slices and 69 L4 cells in 29 slices. P-value is for a comparison between L2/3 and L4 using Kolmogorov–Smirnov test.
these “other” cells had an Em of − 73.0 (− 79.3 to − 49.5) mV (p = 0.9921) and Rm of 93.78 (37.9–119.6) MΩ
(p = 0.0104) (Fig. 4d,e). Analysis of probability of finding live neurons through the post-OGD period revealed that L2/3 neurons showed a much higher survival rate after aSD when compared to L4 neurons (p = 0.000353, Kolmogorov–Smirnov test, Fig. 4f).
Discussion
The main conclusion of our study is that aSD is not a terminal event during OGD in submerged cortical slices, and that the “commitment point” of irreversible damage in this model occurs at variable, in the range of tens of minutes, delays after aSD.
Here we used two experimental approaches to assess neuronal survival after transient metabolic insult caused by OGD. Using continuous patch-clamp recordings through the OGD and reperfusion period we found an extremely low survival rate with recovery of negative membrane potential and ability to spike-fire in very few neurons and only if reperfusion started shortly after aSD. This is in line with previous studies where the occurrence of aSD was associated with irreversible loss of membrane potential in submerged slices or intact preparations12–16,18,21. However, according to recent observations on the dynamics of tissue edema which starts
developing after aSD at a rate of volume increase by ~ 1%/min, irreversible loss of membrane potential after aSD could reflect not only true permanent neuronal depolarization, but also artifacts caused by mechanical displace-ment of recorded neurons from the recording pipette, and loss of electrical connection between the cell and pipette. This could potentially cause cell survival to be underestimated. In line with these assumptions, we found spontaneous transitions from whole-cell to outside-out configuration following aSD. Normally, transition from whole-cell to outside-out configuration involves slow displacement of the recording pipette from a cell, during which the initial connection between the pipette and cell membrane is preserved and once a relatively small patch is extruded from the plasma membrane, the outside-out formation manifests in an increase in Rm to GΩ
values37. Although infrequent, cases of transitions from whole-cell to outside-out configuration are highly likely
to be indicative of the displacement of the recorded cell from the pipette during edemic tissue shifts. Transition to outside-out is not necessarily indicative of cell damage, however, as neurons can survive this procedure and display quite normal negative Em values during multiple repatching under normal conditions. Therefore, these
cases can only be classified as a fraction of undetermined outcomes, that in total constitute the vast majority of cases during continuous recordings through the OGD and reperfusion phases. To sum up, continuous recordings employed in this, and previous studies show poor neuronal survival after aSD, but this approach may underes-timate survival rate due to the artifacts caused by ischemic tissue edema. Likewise irreversible loss of responses evoked by afferents electrical stimulation during extracellular recordings that has been reported after aSD in brain slices12,13,20–22 could also involve slice tissue displacement relatively the stimulating and recording electrodes
as well as mechanical neuronal trauma caused by the brain mass tissue movement against the electrodes during development of ischemic edema.
The short-term patching approach, in which the mechanical artifacts associated with tissue edema were mini-mized to displacement of only a few microns over ~ 1 min of recording time, showed neuronal death that was more protracted after aSD. Indeed, nearly half of L4 neurons survived OGD episodes during which reperfusion started less than 10 min after aSD, and survival probability decayed with a time constant of 21 min as a function of reperfusion delay after aSD. An even higher survival rate has been found in the supragranular layers, where a half of patched cells were live neurons in slices in which reperfusion was delayed from aSD by 60 min. The higher susceptibility of L4 neurons to OGD is consistent with a “tropism” of aSD to L4 and the higher metabolic demand of this layer as evidenced by the heaviest labelling of L4 by the metabolic level marker 2,3,5-triphenyltetrazolium chloride (TTC)20, and is in keeping with heterogeneity in sensitivities to ischemia among different neuronal
popu-lations and structures7,11,18,26,29,38–40 that may involve different metabolism in different cell types, but also different
neuronal microenvironment which plays a key role in neuronal recovery from OGD41,42. Because continuous
recordings through the OGD and reperfusion period contain a major source of error caused by tissue edema, we propose that the short-term patching approach, in which this error is minimized, provides more reliable estimates of neuronal survival. However, several points should be taken into account during the interpretation of these results. First, the proportion of surviving neurons could be overestimated with the short-term patching approach because dead cells may change in appearance and ability to establish gigaseal contact and thus can be overlooked during patching. Second, surviving neurons showing functional recovery of membrane potential and firing ability upon reperfusion may have already initiated the cascade of intracellular processes which leads to neuronal death later. Third, cells that were classified as “others” or “undetermined” cases, which show a lack of firing, loss of Em and low membrane resistance within 1–2 h of reperfusion may regain their function at later
time points. Therefore, our conclusions on neuronal survival after OGD are limited to the present experimental settings and may be different with other approaches and at other time points after OGD.
Our findings on significant survival of neurons and their protracted death after aSD reappraise the role of aSD as a terminal event in the OGD model in submerged slices or intact preparations in vitro12–16,18,20–22,43 and
are more consistent with the observations made using other ischemia models. Indeed, in brain slices with a gas-fluid interface, aSD is not a terminal event and slices can be rescued by reperfusion with oxygen/glucose-containing ACSF several minutes after hypoxia-induced aSD (in normal glycemic conditions)8,44,45. During
global ischemia in vivo, aSD is also not a terminal event as both morphological and functional impairments to cortical neurons are fully reversible upon reperfusion started within ~ 5 min of aSD6. Moreover, cortical slices
prepared from the rat brain 1–6 h after cardiac arrest display quite normal physiological and morphological properties3 and sufficient viability for cultures46–48. Specific cellular functions, spontaneous synaptic activity,
and active cerebral metabolism (yet not global brain activity) was restored in pigs four hours post-mortem after extracorporeal reperfusion using cytoprotective perfusate2. Also, reperfusion started after one hour of complete
global ischemia could result in neuronal, electrophysiological, and metabolic brain resuscitation49–52. Also, along
with these findings, up to 4 h of reperfusion after a transient (one hour long) focal cerebral ischemia induced by microfilament MCA occlusion, negligible tissue injury was revealed if brain slices prepared from these animals were stained with TTC in vitro53. No signs of functional damage were also reported in slices prepared
immedi-ately after 30 min of MCAO4.
Comparing our results with the data obtained in vivo or using ex‑vivo preparations, it appears that neuronal death occurs at a higher rate during OGD in submerged slices than during ischemia in vivo. The more harmful OGD in submerged slices may involve a stronger cytotoxic edema and calcium load than in vivo. Previously, the development of cytotoxic edema manifested by swelling of neuronal and glial cell soma, dendritic beading and shrinkage of the extracellular space was shown starting minutes after aSD both in vivo and in vitro6,22,32,54–56.
However, under submerged conditions in vitro, brain tissue is exposed to an unlimited source of calcium, sodium, chloride and water in the extracellular space, through continuous and unlimited buffering of the extracellular space by the electrolytes and water contained in the bath medium31,34,57,58. This results in a stronger cytotoxic
edema and calcium load than in vivo, where the availability of electrolytes and water in the extracellular space is limited by the lack of blood supply to the ischemic core in the case of focal ischemia or during global brain ischemia caused by cardiac arrest59. In the latter case, cytotoxic edema and calcium load are limited by the
rela-tively small amount of electrolytes and water in the narrow extracellular space and are thus less pronounced and less damaging, and occur without tissue swelling in contrast to submerged slices in vitro31,34,57,58.
In conclusion, the results of the present study suggest that neuronal death evoked by OGD in submerged cortical slices may span a longer time window after aSD than initially thought, and this is more in agreement with the observations made during brain ischemia in vivo. While previously approved strategies for attenuating ischemic injury in the in vitro ischemia models are mainly aimed at delaying aSD onset12,13,22,24,43, our findings
allow in vitro models to be used to explore neuroprotective interventions that could stop the progression of neuronal damage initiated by aSD during the post-aSD period.
Materials and methods
Ethical approval.
All animal-use protocols followed the guidelines of the French National Institute of Health and Medical Research (INSERM, protocol N007.08.01) and Kazan Federal University on the use of labo-ratory animals (ethical approval by the Institutional Animal Care and Use Committee of Kazan State Medical University N9-2013).Brain slice preparation.
Wistar rats (16–23 days old) of either sex were used. Animals were decapitated under isoflurane anaesthesia (5%), the brain was rapidly removed and placed in ice-cold (2–5 °C) slicing solu-tion of the following composisolu-tion (in mM): KCl 3.5, CaCl2 2, MgSO4 2, NaHCO3 24, NaH2PO4 1.25, glucose10 and sucrose 25.2 (pH 7.4). Four hundred µm thick thalamocortical slices were cut using a PELCO easiSlicer vibratome (Ted Pella, Inc., Redding, CA, USA). Slices containing the barrel cortex were selected by anatomi-cal coordinates60 and the presence of barrel structures in L4. Slices were first kept in oxygenated (95% O
2–5%
CO2) artificial cerebrospinal fluid (ACSF) of the following composition (in mM): NaCl 126, KCl 3.5, CaCl2 2,
MgCl2 1.3, NaHCO3 25, NaH2PO4 1.2 and glucose 11 (pH 7.4) for 30 min at 32 °C and then at room temperature
(20–22 °C) for at least 1 h before use. For recordings, slices were placed into a submerged chamber and super-fused with oxygenated ACSF at 30–32 °C at a flow rate of 10 ml min−1. Oxygen/glucose deprivation (OGD) was
induced by superfusion with ACSF in which N2 replaced O2 and sucrose replaced glucose at equimolar
concen-tration. OGD durations were fixed prior to each experiment to a pre-defined duration of the post-aSD period, which is a time interval between aSD (monitored using OIS imaging and extracellular field potential recordings) and reperfusion with oxygenated, enriched in glucose ACSF. Pre-defined durations of the post-aSD period were of 0, 5, 10, 15, 20, 25, 30, 45 and 60 min during recordings from L4, and 5, 15, 30, 45 and 60 min during record-ings from L2/3. The actual durations of post-aSD period could differ by up to ± 2 min from the pre-defined val-ues due to the time lag between aSD detected online during the experiment and the exact value of the aSD peak determined during post-hoc analysis.
Electrophysiological recordings.
Patch‑clamp recordings. Visual patch-clamp recordings wereper-formed from L4 pyramidal cells using a MultiClamp 700B (Axon Instruments, Union City, CA, USA) amplifier as described previously31. Patch electrodes were made from borosilicate glass capillaries (BF150-86-10, Sutter
Instrument, Novato, CA, USA) and had a resistance of 4–7 MΩ. The pipette (intracellular) solution contained (in mM) 131 potassium gluconate, 4 KCl, 10 HEPES, 10 phosphocreatine, 4 MgATP, and 0.3 Na2GTP (adjusted
to pH 7.3 with KOH). Extracellular and patch-clamp recordings were digitized at 10 kHz with a Digidata 1440A interface card (Axon Instruments) and analyzed offline using MATLAB (MathWorks, Inc., Natick, MA, USA) routines.
To examine the ability of neurons to fire APs and monitor the membrane resistance (Rm) during
continu-ous patch-clamp recordings 200-ms suprathreshold depolarizing current pulses were applied every 10 s during control, OGD and reperfusion episodes. For short-term patch-clamp recordings in each slice, several neurons were patched before OGD (on average, 4.4 ± 0.4 cells patched per slice in L4 (128 cells in 29 slices) and 4.9 ± 0.4 cells/slice in L2/3 (79 cells in 16 slices) and after OGD (on average, 2.4 ± 0.3 cells/slice in L4 (69 cells in 29 slices) and 4.9 ± 0.7 cells/slice in L2/3 (122 cells in 25 slices). Firing ability, resting membrane potential (Em) and Rm
values in these cells were evaluated by I-V curve analysis.
Extracellular recordings of the local field potentials (LFP) were performed in the barrel cortex using single site glass pipette electrodes. Electrodes were pulled from borosilicate glass capillaries (BF150-86-10, Sutter Instru-ment, Novato, CA, USA) and had resistances of 2–3 MΩ when filled with ACSF. Electrodes were connected via
chlorided silver wire to the headstage of a MultiClamp 700B patch-clamp amplifier (Axon Instruments, Union City, CA, USA). Recordings were performed in voltage-clamp DC mode, then currents were inverted and volt-age calibrated using 5 mV steps.
Optical intrinsic signal recordings. Optical intrinsic signal (OIS) recordings were performed using slice
transil-lumination as described in20,31,61. The slice was illuminated by a halogen lamp with a 775 nm bandpass filter and
visualized using a BX51WI upright microscope equipped with a 4x/0.10 Plan N objective (Olympus, Tokyo, Japan). Images were acquired using a QIClick-R-F-M-12 CCD camera (QImaging, Surrey, BC, Canada) every 2.5 s at 348 × 260 pixel resolution.
Data analysis.
Data were analyzed using custom-written procedures in MATLAB (MathWorks, Inc.,Natick, MA, USA) as described previously20,31. OIS was calculated using the first-frame subtraction approach:
OIS(t) = (I(t) − I0)/I0, where I(t)—pixel intensity at the moment t, I0—time-averaged pixel intensity in the
pre-conditioned baseline period (100 s). The resulting frames were filtered with a 10 × 10 median filter. Regions of interest (ROI) were selected as square areas near recording sites. OIS traces were calculated as the average OIS signal within the selected ROIs. The appearance of the peak value of the OIS signal determined the start time of aSD. The amplitude of aSD during extracellular recordings was calculated as within OIS-detected aSD ± 5 min time window.
Statistical analysis.
Statistical analysis was performed using the MATLAB Statistics toolbox (MathWorks, Inc., Natick, MA, USA). Statistical comparisons between the groups were performed using the Wilcoxon rank sum and Kolmogorov–Smirnov tests. The significance level was set at p < 0.05. Group data are expressed as median (25th percentile–75th percentile) unless otherwise indicated.Data availability
Original and processed data, and signal processing and analysis routines are available on request from the authors.
Received: 21 June 2020; Accepted: 22 October 2020
References
1. Allen, B. S. & Buckberg, G. D. Studies of isolated global brain ischaemia: I. overview of irreversible brain injury and evolution of a new concept—redefining the time of brain death. Eur. J. Cardio‑Thoracic Surg. 41, 1132–1137 (2012).
2. Vrselja, Z. et al. Restoration of brain circulation and cellular functions hours post-mortem. Nature 568, 336–343 (2019). 3. Charpak, S. & Audinat, E. Cardiac arrest in rodents: maximal duration compatible with a recovery of neuronal activity. Proc. Natl.
Acad. Sci. USA 95, 4748–4753 (1998).
4. Petrin, D. et al. Spreading depolarization and neuronal damage or survival in mouse neocortical brain slices immediately and 12 hours following middle cerebral artery occlusion. J. Neurophysiol. 121, 1650–1663 (2019).
5. Dreier, J. P. & Reiffurth, C. The Stroke-Migraine Depolarization Continuum. Neuron 4, 902–922 (2015).
6. Murphy, T. H., Li, P., Betts, K. & Liu, R. Two-photon imaging of stroke onset in vivo reveals that NMDA-receptor independent ischemic depolarization is the major cause of rapid reversible damage to dendrites and spines. J. Neurosci. 28, 1756–1772 (2008). 7. Lipton, P. Ischemic cell death in brain neurons. Physiol. Rev. 79, 1431–1568 (1999).
8. Somjen, G. G. Mechanisms of spreading depression and hypoxic spreading depression-like depolarization. Physiol. Rev. 81, 1065– 1096 (2001).
9. Dreier, J. P. et al. Is spreading depolarization characterized by an abrupt, massive release of gibbs free energy from the human brain cortex?. Neuroscientist 19, 25–42 (2013).
10. Hartings, J. A., Rolli, M. L., Lu, X. C. M. & Tortella, F. C. Delayed secondary phase of peri-infarct depolarizations after focal cerebral ischemia: relation to infarct growth and neuroprotection. J. Neurosci. 23, 11602–11610 (2003).
11. Aitken, P. G., Tombaugh, G. C., Turner, D. A. & Somjen, G. G. Similar propagation of SD and hypoxic SD-like depolarization in rat hippocampus recorded optically and electrically. J. Neurophysiol. 80, 1514–1521 (1998).
12. Dzhala, V., Ben-Ari, Y. & Khazipov, R. Seizure accelerate anoxia-induced neuronal death in the neonatal rat hippocampus. Ann.
Neurol. 48, 632–640 (2000).
13. Joshi, I. & Andrew, R. D. Imaging anoxic depolarization during ischemia-like conditions in the mouse hemi-brain slice. J. Neuro‑
physiol. 85, 414–424 (2001).
14. Rader, R. K. & Lanthorn, T. H. Experimental ischemia induces a persistent depolarization blocked by decreased calcium and NMDA antagonists. Neurosci. Lett. 99, 125–130 (1989).
15. Tanaka, E., Yamamoto, S., Kudo, Y., Mihara, S. & Higashi, H. Mechanisms underlying the rapid depolarization produced by dep-rivation of oxygen and glucose in rat hippocampal CA1 neurons in vitro. J. Neurophysiol. 78, 891–902 (1997).
16. Toyoda, H., Kawano, T., Sato, H. & Kato, T. Cellular mechanisms underlying the rapid depolarization caused by oxygen and glucose deprivation in layer III pyramidal cells of the somatosensory cortex. Neurosci. Res. 1, 6. https ://doi.org/10.1016/j.neure s.2020.03.003
(2020).
17. Anderson, T. R., Jarvis, C. R., Biedermann, A. J., Molnar, C. & Andrew, R. D. Blocking the anoxic depolarization protects without functional compromise following simulated stroke in cortical brain slices. J. Neurophysiol. 93, 963–979 (2005).
18. Devin Brisson, C. & David Andrew, R. A neuronal population in hypothalamus that dramatically resists acute ischemic injury compared to neocortex. J. Neurophysiol. 108, 419–430 (2012).
19. Jarvis, C. R., Anderson, T. R. & Andrew, R. D. Anoxic depolarization mediates acute damage independent of glutamate in neocorti-cal brain slices. Cereb. Cortex 11, 249–259 (2001).
20. Juzekaeva, E. et al. Preferential initiation and spread of anoxic depolarization in layer 4 of rat barrel cortex. Front. Cell. Neurosci.
11, 00390. https ://doi.org/10.3389/fncel .2017.00390 (2017).
21. Dzhala, V., Khalilov, I., Ben-Ari, Y. & Khazipov, R. Neuronal mechanisms of the anoxia-induced network oscillations in the rat hippocampus in vitro. J. Physiol. 536, 521–531 (2001).
22. Obeidat, A. S., Jarvis, C. R. & Andrew, R. D. Glutamate does not mediate acute neuronal damage after spreading depression induced by O2/glucose deprivation in the hippocampal slice. J. Cereb. Blood Flow Metab. 20, 412–422 (2000).
23. Tanaka, E., Yamamoto, S., Inokuchi, H., Isagai, T. & Higashi, H. Membrane dysfunction induced by in vitro ischemia in rat hip-pocampal CA1 pyramidal neurons. J. Neurophysiol. 81, 1872–1880 (1999).
24. Tyzio, R. et al. Maternal oxytocin triggers a transient inhibitory switch in GABA signaling in the fetal brain during delivery. Science
314, 1788–1792 (2006).
25. Centonze, D. et al. Ionic mechanisms underlying differential vulnerability to ischemia in striatal neurons. Prog. Neurobiol. 63, 687–696 (2001).
26. Brisson, C. D., Lukewich, M. K. & Andrew, R. D. A distinct boundary between the higher brain’s susceptibility to ischemia and the lower brain’s resistance. PLoS ONE 8, 0079589. https ://doi.org/10.1371/journ al.pone.00795 89 (2013).
27. Senatorov, V. V. & Hu, B. Differential Na+-K+-ATPase activity in rat lemniscal and non-lemniscal auditory thalami. J. Physiol.
502, 387–397 (1997).
28. Hamann, M., Rossi, D. J., Mohr, C., Andrade, A. L. & Attwell, D. The electrical response of cerebellar Purkinje neurons to simulated ischaemia. Brain 128, 2408–2420 (2005).
29. Brisson, C. D., Hsieh, Y. T., Kim, D., Jin, A. Y. & Andrew, R. D. Brainstem neurons survive the identical ischemic stress that kills higher neurons: Insight to the persistent vegetative state. PLoS ONE 9, 0096585. https ://doi.org/10.1371/journ al.pone.00965 85
(2014).
30. Dreier, J. P., Lemale, C. L., Kola, V., Friedman, A. & Schoknecht, K. Spreading depolarization is not an epiphenomenon but the principal mechanism of the cytotoxic edema in various gray matter structures of the brain during stroke. Neuropharmacology 134, 189–207 (2018).
31. Juzekaeva, E., Gainutdinov, A., Mukhtarov, M. & Khazipov, R. Dynamics of the hypoxia—induced tissue edema in the rat barrel cortex in vitro. Front. Cell. Neurosci. 12, 00502. https ://doi.org/10.3389/fncel .2018.00502 (2018).
32. Risher, W. C., Andrew, R. D. & Kirov, S. A. Real-time passive volume responses of astrocytes to acute osmotic and ischemic stress in cortical slices and in vivo revealed by two-photon microscopy. Glia 57, 207–221 (2009).
33. Andrew, R. D., Labron, M. W., Boehnke, S. E., Carnduff, L. & Kirov, S. A. Physiological evidence that pyramidal neurons lack functional water channels. Cereb. Cortex 17, 787–802 (2007).
34. Kumar, V., Naik, R. S., Hillert, M. & Klein, J. Effects of chloride flux modulators in an in vitro model of brain edema formation.
Brain Res. 1122, 222–229 (2006).
35. Tyzio, R. et al. Inhibitory actions of the gamma-aminobutyric acid in pediatric Sturge-Weber syndrome. Ann. Neurol. 66, 209–218 (2009).
36. Luhmann, H. J., Mudrick-Donnon, L. A., Mittmann, T. & Heinemann, U. Ischaemia-induced Long-term Hyperexcitability in Rat Neocortex. Eur. J. Neurosci. 7, 180–191 (1995).
37. Hamill, O. P., Marty, A., Neher, E., Sakmann, B. & Sigworth, F. J. Improved patch-clamp techniques for high-resolution current recording from cells and cell-free membrane patches. Pflügers Arch. Eur. J. Physiol. 391, 85–100 (1981).
38. Basarsky, T. A., Duffy, S. N., Andrew, R. D. & MacVicar, B. A. Imaging spreading depression and associated intracellular calcium waves in brain slices. J. Neurosci. 18, 7189–7199 (1998).
39. Kass, I. S. & Lipton, P. Calcium and long-term transmission damage following anoxia in dentate gyrus and CA1 regions of the rat hippocampal slice. J. Physiol. 378, 313–334 (1986).
40. Kawai, K. et al. Global cerebral ischemia associated with cardiac arrest in the rat: I. Dynamics of early neuronal changes. J. Cereb.
Blood Flow Metab. 12, 238–249 (1992).
41. Hübel, N., Andrew, R. D. & Ullah, G. Large extracellular space leads to neuronal susceptibility to ischemic injury in a Na+/K + pumps–dependent manner. J. Comput. Neurosci. 40, 177–192 (2016).
42. Ullah, G., Wei, Y., Dahlem, M. A., Wechselberger, M. & Schiff, S. J. The role of cell volume in the dynamics of seizure, spreading depression, and anoxic depolarization. PLoS Comput. Biol. 11, 1004414. https ://doi.org/10.1371/journ al.pcbi.10044 14 (2015). 43. Watson, G. B., Rader, R. K. & Lanthorn, T. H. Epileptiform activity in vitro can produce long-term synaptic failure and persistent
neuronal depolarization. Brain Res. 498, 81–88 (1989).
44. Balestrino, M. & Somjen, G. G. Chlorpromazine protects brain tissue in hypoxia by delaying spreading depression-mediated calcium influx. Brain Res. 385, 219–226 (1986).
45. Young, J. N., Aitken, P. G. & Somjen, G. G. Calcium, magnesium, and long-term recovery from hypoxia in hippocampal tissue slices. Brain Res. 548, 343–345 (1991).
46. Onorati, M. et al. Zika virus disrupts phospho-TBK1 localization and mitosis in human neuroepithelial stem cells and radial glia.
Cell Rep. 16, 2576–2592 (2016).
47. Verwer, R. W. H. et al. Cells in human postmortem brain tissue slices remain alive for several weeks in culture. FASEB J. 16, 54–60 (2002).
48. Viel, J. J., McManus, D. Q., Cady, C., Evans, M. S. & Brewer, G. J. Temperature and time interval for culture of postmortem neurons from adult rat cortex. J. Neurosci. Res. 64, 311–321 (2001).
49. Hossmann, K. A. & Sato, K. Recovery of neuronal function after prolonged cerebral ischemia. Science 168, 375–376 (1970). 50. Hossmann, K. A. & Zimmermann, V. Resuscitation of the monkey brain after 1 H complete ischemia. I. Physiological and
mor-phological observations. Brain Res. 81, 59–74 (1974).
51. Kleihues, P., Hossmann, K. A., Pegg, A. E., Kobayashi, K. & Zimmermann, V. Resuscitation of the monkey brain after one hour complete ischemia. III. Indications of metabolic recovery. Brain Res. 95, 61–73 (1975).
52. Zimmermann, V. & Hossmann, K. A. Resuscitation of the monkey brain after one hour’s complete ischemia. II. Brain water and electrolytes. Brain Res. 85, 1–11 (1975).
53. Benedek, A. et al. Use of TTC staining for the evaluation of tissue injury in the early phases of reperfusion after focal cerebral ischemia in rats. Brain Res. 1116, 159–165 (2006).
54. Risher, W. C., Ard, D., Yuan, J. & Kirov, S. A. Recurrent spontaneous spreading depolarizations facilitate acute dendritic injury in the ischemic penumbra. J. Neurosci. 30, 9859–9868 (2010).
55. Risher, W. C., Croom, D. & Kirov, S. A. Persistent astroglial swelling accompanies rapid reversible dendritic injury during stroke-induced spreading depolarizations. Glia 60, 1709–1720 (2012).
56. Vanhareveld, A. Changes in volume of cortical neuronal elements during asphyxiation. Am. J. Physiol. 191, 233–242 (1957). 57. Elkin, B. S., Shaik, M. A. & Morrison, B. Fixed negative charge and the Donnan effect: a description of the driving forces associated
with brain tissue swelling and oedema. Philos. Trans. R. Soc. A 368, 585–603 (2010).
58. MacGregor, D. G., Avshalumov, M. V. & Rice, M. E. Brain edema induced by in vitro ischemia: causal factors and neuroprotection.
J. Neurochem. 85, 1402–1411 (2003).
59. Stokum, J. A., Gerzanich, V. & Simard, J. M. Molecular pathophysiology of cerebral edema. J. Cereb. Blood Flow Metab. 36, 513–538 (2016).
60. Khazipov, R. et al. Atlas of the postnatal rat brain in stereotaxic coordinates. Front. Neuroanat. 9, 00161. https ://doi.org/10.3389/ fnana .2015.00161 (2015).
61. Aitken, P. G., Fayuk, D., Somjen, G. G. & Turner, D. A. Use of intrinsic optical signals to monitor physiological changes in brain tissue slices. Methods A 18, 91–103 (1999).
Acknowledgements
We thank David Jappy for editing the manuscript.
Author contributions
R.K. conceived the project. E.J., A.G. and M.M. performed the experiments. A.G., E.J. and M.M. analyzed the data. R.K. wrote the manuscript. All authors reviewed the manuscript.
Funding
This work was supported by RSF #17-15-01271-P (electrophysiology and imaging) and the subsidy allocated to Kazan Federal University for the state assignment in the sphere of scientific activities #0671-2020-0059 (develop-ment of the analytical software) and performed within the Program of Competitive Growth of Kazan University.
Competing interests
The authors declare no competing interests.
Additional information
Correspondence and requests for materials should be addressed to R.K. Reprints and permissions information is available at www.nature.com/reprints.
Publisher’s note Springer Nature remains neutral with regard to jurisdictional claims in published maps and
institutional affiliations.
Open Access This article is licensed under a Creative Commons Attribution 4.0 International
License, which permits use, sharing, adaptation, distribution and reproduction in any medium or format, as long as you give appropriate credit to the original author(s) and the source, provide a link to the Creative Commons licence, and indicate if changes were made. The images or other third party material in this article are included in the article’s Creative Commons licence, unless indicated otherwise in a credit line to the material. If material is not included in the article’s Creative Commons licence and your intended use is not permitted by statutory regulation or exceeds the permitted use, you will need to obtain permission directly from the copyright holder. To view a copy of this licence, visit http://creat iveco mmons .org/licen ses/by/4.0/.