HAL Id: hal-01556312
https://hal.uca.fr/hal-01556312
Submitted on 17 Jul 2017
HAL is a multi-disciplinary open access archive for the deposit and dissemination of sci-entific research documents, whether they are pub-lished or not. The documents may come from teaching and research institutions in France or abroad, or from public or private research centers.
L’archive ouverte pluridisciplinaire HAL, est destinée au dépôt et à la diffusion de documents scientifiques de niveau recherche, publiés ou non, émanant des établissements d’enseignement et de recherche français ou étrangers, des laboratoires publics ou privés.
A Novel Computational Approach for Global Alignment
for Multiple Biological Networks
Warith Djeddi, Sadok Ben Yahia, Engelbert Mephu Nguifo
To cite this version:
Warith Djeddi, Sadok Ben Yahia, Engelbert Mephu Nguifo. A Novel Computational Approach for Global Alignment for Multiple Biological Networks. IEEE/ACM Transactions on Com-putational Biology and Bioinformatics, Institute of Electrical and Electronics Engineers, 2017, IEEE/ACM Transactions on Computational Biology and Bioinformatics„ 15 (6), pp.2060-2066. �10.1109/TCBB.2018.2808529�. �hal-01556312�
A Novel Computational Approach for Global Alignment for
Multiple Biological Networks
Warith Eddine Djeddi
1, Sadok Ben Yahia
1∗and Engelbert Mephu Nguifo
2∗1LIPAH, University of Tunis El Manar, 2092, Tunis, Tunisia and
2University Clermont Auvergne, CNRS, LIMOS, F-63000 CLERMONT-FERRAND, FRANCE
∗Corresponding author:[email protected],[email protected]
Abstract
Comparison of the protein interaction networks from different species is of paramount importance for understanding physical and functional interactions between biological functions and processes within a cell. In this paper, we introduce a novel algorithm for a global alignment of multiple protein-protein interaction (PPI) networks called MAPPIN. The latter combines information available for the proteins in the networks, including sequence, function and network topology. Our method is perfectly designed to exploit current multi-core CPU architectures. MAPPIN has been extensively tested on a real dataset (five eukaryotic species). Our experimental results show that MAPPIN sharply outper-forms the pioneering methods of the literature in producing functionally coherent alignments as far as it provides biologically significant alignments within an acceptable running time, even for very large input instances.
1
Introduction
With the advent of high-throughput experimental technique such as yeast two-hybrid [1] and coimmuno-precipitation coupled mass-spectrometry [2] there has been a steadily increase in the data available on protein-protein interactions (PPI). These networks are typically represented as graphs, where the nodes represent individual biomolecules (e.g., proteins) and interactions (e.g., protein binding) between biomolecules are represented by edges connecting the corresponding nodes.
The results are stored in several public and commercial databases, such as Biological General Repos-itory for Interaction Datasets (BioGRID) [3] and Search Tool for the Retrieval of Interacting Genes (STRING) [4]. Therefore, network alignment looks for assessing to which extent two networks are similar as well as in what regions they share similarity. Network alignment is the process of globally comparing two networks, identifying regions of similarity and to detect subnetworks that are conserved across species. Analyzing PPI networks, has been very effective in tackling many problems such as understanding the ge-netic factors that impact various diseases [5], drug discovery [6], predicting protein functions [7,8,9,10], identifying functional modules [11], and understanding the phylogeny from these data.
Network alignment approaches can be generally classified into pairwise/multiple as well as into local or global approaches. Pairwise approaches align two networks and multiple approaches three and more networks. Usually, pairwise global alignment approaches aim to produce a one-to-one node alignment between two PPI networks, whilst multiple global alignment approaches try to provide a many-to-many
node mapping [12,13,14]. Local networks alignment (LNA) approaches detect conserved subnetworks, rather than entire networks of two (pairwise local alignment) or more (multiple local alignment) networks. However, aligned regions can overlap, leading to "‘ambiguous"’ many-to-many mappings. Thus, global network alignment (GNA) was proposed. Unlike LNA, GNA compares the entire compared networks, by aligning every node in the source to exactly one unique node in the target.
Several network alignment algorithms have been proposed for multiple local or global alignment [14, 13, 15, 16, 17, 18, 19, 20, 21, 22]. For example, Graemlin 2.0 [23], is a global multiple network alignment (MNA) algorithm that finds alignments by successively performing pairwise alignments, using phylogenetic information and network topology and then employs a hill-climbing algorithm to generate the alignment. SMETANA [24], another many-to-many global MNA algorithm, tries to find correspon-dences by using a semi-Markov random-walk model. The latter is used for computing pairwise sequence scores and pairwise topological scores. NetworkBLAST [25] searches greedily for highly conserved local regions in the alignment graph constructed from the pairwise protein sequence similarities. LocalAli [26] is a multiple local alignment tool that support parallel computing for the identification of functionally con-served modules. BEAMS [27] is a fast approach that constructs global many-to-many multiple network alignments from the pairwise sequence similarities of the nodes by using a backbone (seed) extraction and merge strategy. NetCoffee [28] aligns multiple PPI networks based only on sequence similarity and does not take into account the topology of the considered networks. Its alignment strategy constructs a weighted bipartite graph for each pair of networks, searches for candidate edges from each bipartite graph by solving maximum weight bipartite matching problem. NetCoffee applies a triplet approach similar to T-Coffee to compute the edge weights of the k-partite graph. Then, the algorithm finds candidate edges in the bipartite graphs and combines qualified edges through simulated annealing. IsoRankN (IsoRank-Nibble) [29] is the first global MNA algorithm that uses both pairwise sequence similarities and network topology, to generate many-to-many alignments. It applies IsoRank to derive pairwise alignment scores between every pair of networks, and then employs a PageRank-Nibble algorithm to cluster all the proteins by their alignment score.
Although several GNA methods have been developed, there is still a compelling need to improve the alignment quality and computational efficiency. Moreover, many alignment tools encounter limitations in introducing the functional similarities during the alignment process because it needs faster and more effi-cient alignment tool especially for the alignment of multiple protein-protein interaction networks. More-over, most of them make use of the Gene Ontology (GO) at the validation step of the quality of the final alignment and not during the alignment process.
To overcome this problem, in this paper, we introduce a fast and accurate algorithm, Multiple Align-ment for Protein Protein Interactions Networks (MAPPIN)1, which allows to find a global alignment of multiple PPI networks. Our approach is the first approach that includes the functional similarity of pro-teins at the core of the alignment process of k > 2 networks. The effect of including functional similarity in global alignment is an interesting point to investigate as it would help revealing unveiled equivalences by sequence similarity that might be biologically relevant.
MAPPIN uses sequence similarity between the individual proteins of the networks together with the Gene Ontology Annotation (GOA) of proteins to incorporate functional similarity between the proteins and perform the matching between the proteins of different species. We rigorously combine protein sequence similarity, network topology similarity and functional similarity (using GO) into a suitable scoring scheme for aligning k multiple networks. Later, the topological information of the networks is incorporated to get the final alignment. It is worth to mention that as far as the complexity of the problem exponentially
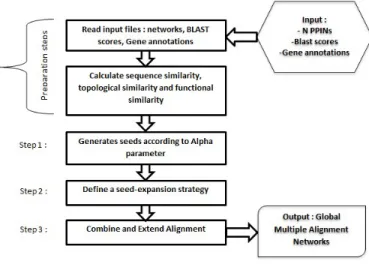
Figure 1: The different steps for scoring a multiple network alignment.
grows with the number of networks to be aligned, the proposed MNA algorithm uses scalable alignment strategies (multithreading programming).
The rest of this paper is organized as follows. Section 2 depicts the architecture of the novel pro-posed approach and presents the PPI networks alignment problem. Section 3 describes our evaluation methodology and discusses experimental results. Finally, section 4 concludes with an outline of future work.
2
Methods and Algorithms
2.1
The MAPPIN Algorithm
The algorithm implemented in our approach has four major steps: (1) Parsing the n PPI networks; (2) Giving a calculated weight to each edge in the bipartite graphs using the information in the GOA and sequence level for each aligned protein; (3) Collecting seed with high similarity scores from the bipar-tite graphs, each seed is expanded in an iterative fashion by exploring the local neighborhood for each compared protein; (4) Finally, MAPPIN applies a simulated annealing (SA) [30] function in order to find a global alignments. Figure 1shows an outline of our algorithm, including the methodology it uses for multiple global alignment. A more detailed workflow of our approach is described with an illustrative example in thesupplementary data. It is worth mentioning that our approach is based on NetCoffee our algorithm [28]. However, there are a difference points between them which are depicted in Table1.
2.2
Definition of Multiple Network Alignment
Let k represents the set of PPI networks{G1, G2, ..., Gk}. Each PPI network is an unweighted undirected
graph Gi={Vi, Ei}, where Vi= { v1, ..., v|N| } is a set of proteins. E ={ei j }
is a set of m undirected edges that represent an interaction between two proteins v1and v2. Let V =
∪k
i=1Vi, E =
∪k
i=1Eiand n =|V| be
the total number of N proteins. A match-setϑ is a subset of V . By definition, a global alignment of the
k networks is a node mapping that consists of a set of mutually disjoint match sets,{ϑ1,ϑ2, ...,ϑm} with
Table 1: The main difference between MAPPIN and NetCoffee.
MAPPIN NetCoffee
It aligns two or more PPI networks It aligns 3 networks or more, so it can not align two networks.
The topological similarity is used for the detection of hubs and in phase of Seed Expansion
Topological similarity is based on the T-Coffee ap-proach.
It includes the functional similarity during the align-ment process from the Gene Ontology Annotation (GOA) collected from UniProt-GOA
It doesn’t apply any functional similarities. The Gene Ontology, used after the process of the alignment in or-der to test the coherence of the alignments.
It rigorously combines protein sequence similarity, net-work topology similarity and functional similarity (us-ing GO) into a suitable scor(us-ing scheme for align(us-ing k multiple networks.
It rigorously combines protein sequence similarity and network topology similarity for aligning k multiple net-works.
2.3
Aligning a Bipartite Graph
We make up a bipartite graph, which contains a graph Bi j =
(
Vi∪Vj, Ei j
)
for each pair of the input net-works Giand Gj, i≤ j,i, j ∈ {1,2,...,k}. We use the term edges to refer to elements in Ei j. To determine
the sets Ei j, we align two networks with a strategy for aligning pairwise networks described in the
subsec-tion2.5for each pair of species. Whereas, for bipartite graphs Biiof the same species, we add only edges
for pairs of two different proteins v1̸= v2to Eii [28].
2.4
Multiple Global Alignment (MGA)
Let (
k+1
2 )
denoting the weighted bipartite graphs, and (
k
2 )
the bipartite graph for each compared pair-wise network. Assigning a weight for each edge in Bi j, i < j including information about sequence,
functional and topology conservation. We obtain a collection of candidate edges, denoted asΩ. Our algo-rithm for aligning multiple networks starts by collecting candidate edges from the
(
k+1
2 )
bipartite graphs [28]. Given a node (protein) v∈ V from each of the compared networks, and we denote VertexCluster (v) as the set of all nodes aligned to a node v.
In the case of a pairwise alignment, a given edge (u, v) in a network Giis said to be conserved in another
network Gj, if there is an interaction (s,t)∈ Ejsuch that s∈ VertexCluster (u) and t ∈ VertexCluster (v).
For the edge (u, v)∈ Ei, its edge alignment cluster EdgeClusteri j(u, v), can be computed as given in Eq.
(1):
EdgeCluster (u, v) =
{ (s,t) /
VertexCluster (u)×VertexCluster (v) : ∃Gj= ( Vj, Ej ) : (s,t)∈ Ej } (1)
As demonstrates the equation (1), a given interaction (u, v)∈ Ei is conserved in k≤ n species, when
there are k−1 distinct species, such that there exist pairs of nodes (s,t) ∈ Ejsuch that s∈VertexCluster (u)
Therefore, to get the MNA node mappings, we should combine each pairwise node alignments for each node v by combining all the alignment clusters between any compared networks Gi and Gj as
VertexClusteri j(v).
VertexCluster (v) =∪VertexClusteri j(v) (2)
The set of the alignments for all vertices (proteins) in the k PPI networks, can be computed as given in Eq. (2):
V∗ = ∪{VertexCluster (v)} : ∀v ∈ V (3) Furthermore, the conserved edges for each network in the MNA are computed from the set V∗ defined in Eq. (3):
E∗ = ∪{Edge − vertex(u,v)} : ∀(u,v) ∈ E (4) After completion of the entire multiple alignment, our algorithm produces multiple global alignment of all compared species, by apply the SA function [28].
2.5
Pairwise Alignments
As said before our proposed approach begins by aligning two networks G1= (V1, E1) and G2= (V2, E2)
in addition to various configuration parameters as inputs and returns global alignment of them. MAPPIN applies two different phases. The first phase is the computation of the alignment score matrix, and the second one we apply a greedy approach in order to obtain the final result.
At first phase, the Alignment Score Matrix is computed relying on two other matrices named Sequence
score matrix and Functional score matrix between every two nodes i∈ V1and j∈ V2.
Alignment Score Matrix that is computed in phase one will not change during the process of alignment
search (Seed Generation), because the values of the similarity matrix are computed based on sequence and functional properties for each protein. In spite of that, at the phase of Seed Expansion, the Alignment Score
Matrix should be updated iteratively, leading in increased number of conserved interactions after aligning
each neighbor of two proteins.
At the second phase, in each iteration of the Edmond’s algorithm [31], we find the two nodes with maximum score in Alignment Score Matrix and then align them. This greedy search is repeated until all nodes of the first network are aligned with the nodes of the second network.
2.5.1 The Biological Score Matrix
The similarity between two compared proteins is a combination of sequence and functional similarity in the seed generation phase coupled with supplementary topological similarity in the seed extension process. The biological score matrix S is defined such that S(pi, pj
)
is referred to as biological similarity between two proteins pi∈ V1and pj∈ V2. Therefore two proteins piand pj are biologically similar, if and only if
both of the following conditions are fulfilled:
• The actual proteins represented by piand pjhave a good sequence similarity computed from Blast.
• The actual proteins have the most common measure of similarity computed from the shared Gene
Sequence similarity: The sequence similarity of two proteins aiand bjis computed based on their BLAST
bit score as follows:
sseq ( pi, pj ) = BLAST ( pi, pj ) √ BLAST (pi, pi)× BLAST ( pj, pj ) . (5) s(pi, pj )
is the BLAST bit score value when aligning pi and pj. Here, only pairs of proteins with an
E− value < 10−7are used to compute sequence similarity.
Functional similarity: A common measure to assess the biological quality of alignments is based on GO consistency of the aligned pairs of proteins. For an alignment A12, we define GOC12 as the sum
of GO (pi)∩ GO
(
pj) , over all aligned pairs ≺ pi, pj≻∈ V12. Here, the GO (p) denotes the set of GO
terms annotating a protein p. To exclude unreliable function annotations, GOA with evidence codes IEA (inferred from electronic annotation) and ISS (inferred from sequence or structural similarity) were dis-carded. GOA data that are used in this article were extracted from the GO database. The GO database is a collection of well-defined and structured biological terms that are universal to all organisms. Each term represents a functional class and includes the annotation of genes and gene products.
The GO terms and their annotations can significantly contribute to the analysis of PPI networks. In our analysis, for each solution we computed semantic similarities using the set of annotations from the Biological Process (BP) and Molecular Function (MF) ontologies in GO. Here, the GO (p) denotes the set of GO terms annotating a protein p. Given two proteins pi and pj and their set of GOA, GO (pi) =
{t1,t2, ...,tk} and GO
(
pj
)
={ `t1, `t2, ..., `tl}, the Schlicker [32] similarity measure is used to score each pair
≺ goi, goj≻ with goi∈ GO(pi) and goj∈ GO
(
pj
)
. The semantic similarity of piand pj is then defined
as the average of the scores of the best match for each GO term in GO (pi) and GO
(
pj
)
according to the Schlicker measure. Therefore, at the biological phase, the similarity of two proteins is defined as a linear combination of functional similarity and sequence similarity
S(pi, pj ) =αsseq ( pi, pj ) + (1−α) sSchlicker ( pi, pj ) . (6)
In MAPPIN,α provides a relative weighting between sequence and functional similarity. The value of α is manually defined at the beginning of the alignment to tuning the contribution of sequence or functional similarity or in the overall score.
2.5.2 Seed Expansion Strategy
The extension strategy performed by our approach consists in mapping the candidate proteins (neighbour proteins) from the seed protein pairs. The topological similarity of protein pairs is included in this step. Since the functional similarity impact of proteins to neighbouring proteins in the networks decreases as far as the distance between them gets larger, the proportion of score, given in extra, to candidate pairs should also be decreased. Let two proteins viin a specie A and vjin a specie B be two candidate proteins that are
the first neighbours of proteins in the seed vector. Let N (vi) and N
(
vj
)
be the set of all first and second neighbours of viand vjrespectively and let d (ak, al) denote the number of interactions between akand al
in a network, where ak∈ N (vi) and al ∈ N
(
vj
)
. Let Sext(ak, al) denoting the calculation of the extension
similarities of the proteins akand al. The similarity between ak and alin the extension mapping is defined
as: Sext(ak, al) = ( 1 d (ak, vi) + 1 + 1 d(al, vj ) + 1 ) × S(ak, al) (7)
Input: G1(V1, E1), G2(V2, E2),α
Output: Biological score Matrix `B S←− 1; for all i∈ V1do for all j∈ V2do 4: sseq ( pi, pj ) ←− √ BLAST(ai,bj) BLAST (ai,ai)×BLAST(bj,bj) ; sf unct ( pi, pj ) ←− sSchlicker ( pi, pj ) ; ` B←−αsseq ( pi, pj ) + (1−α) sf unct ( pi, pj ) ; end for 8: end for S←− `B; return S Algorithm 1: SimilarityScore(Gi, Gj,α ) The fraction ( 1 d1+1+ 1 d2+1 )
(where d1and d2are the distances of the two candidate proteins with the
aligned pairs in the seed vector) was designed so that it reflects the gradual loss of impact of seed proteins to the candidate proteins. The scores of candidate proteins in extension are recalibrated based on Equation 7, resulting in a score matrix. The resulting mapped protein pairs are then added to the list of aligned protein pairs in the seed vector. The extension step is repeated until no more pairs are added.
2.5.3 Alignment Score Matrix
Similarity score matrix A with|V1| rows and |V2| columns, indicates the similarity between nodes of two
networks, i.e. A(pi, pj
)
is the similarity of nodes piand pj where pi∈ V1 and pj∈ V2. After computing
sequence score matrix and functional score matrix, matrix A is computed as follows:
A(pi, pj
)
= S(pi, pj
)
. (8)
However, at the phase of Seed Expansion the Alignment Score Matrix should be updated iteratively after aligning each neighbor of two nodes. Finally, to find a one-to-one node mapping in each of the
(
k
2 ) weighted bipartite graphs, we apply the Edmond’s algorithm [31].
2.5.4 Time Complexity
Suppose we have k networks, where the maximum network size is n = maxi|Vi|, the maximum number
of interaction in a network is m = maxi|Ei|. Suppose there is a bipartite graph, Bs = (Vs1∪Vs2, Es) the
running time complexity on Bsis O (|Vs1∪Vs2|.log|Es|). Therefore, the collection of candidate edge costs
(
k
2 )
O (nlog (n)) time. Finally, running the SA only depends on two parameters of the cooling scheme, K
Input: Alignment results between bipartite graph and Thresholdτ Output: A set of seeds ˆE
ˆ
E ←− /0
for all a∈ AlignmentResult do ◃ Net (v) = The network where protein v is in
for all vx, vy∈ AlignmentResult : Net (vx)̸= Net (vy) do
4: if S (vx, vy)≥τ then ˆE←− ˆE ∪ (vx, vy)
end if end for end for
8: return ˆE
Algorithm 2: Seed− Generation(AlignmentResults,τ)
Input: A set of seeds E∗and vertex cluster V∗ Output: A set of seeds of multiple networksEGlobalˆ
ˆ EGlobal ←− E∗ for all{vi, vj } ∈ V∗: Net (v i)̸= Net ( vj ) do for all{ak, al} : ak∈ N (vi) , al∈ N ( vj ) do 4: Sext(ak, al)← ( 1 d(ak,vi)+1+ 1 d(al,vj)+1 ) × S(ak, al)
if Sext(ak, al)≥τ thenEGlobalˆ ←−EGlobalˆ ∪ (ak, al)
end if end for
8: end for returnEGlobalˆ
Algorithm 3: Seed− Expansion(E∗,V∗)
Input: G1(V1, E1), G2(V2, E2),α,τ
Output: Node set of the global alignment network Require: |V1| ≤ |V2|
1: AlignmentResults←− SimilarityScore(G1, G2,α)
2: Sˆ←− Seed − Generation(AlignmentResults,τ)
3: returnThe seed ˆS 4:
Algorithm 4: pairwiseAlignment(Gi, Gj,α,τ
Input: Set of network G1(V1, E1), G2(V2, E2) ... Gk(Vk, Ek),α,τ, K, Tmin, Tmax, s
Output: A set of global Multiple match-sets
1: Gs←− G1(V1, E1)
2: Seedsinitial ←− /0
3: for allall remaining networks Gj do
4: G1 j ←− pairwiseAlignment
(
G1, Gj,α,τ
)
5: Seedsinitial←− Seedsinitial∪ G1 j ◃ Create node alignment
6: Initialize V∗= /0
7: foreach node of G1, v∈ V1do
8: Initialize VertexCluster (v) ={v}
9: foreach each pairwise alignment G1, Gjdo
10: VertexCluster (v) = VertexCluster (v)∪VertexCluster1 j(v)
11: end for
◃ Concatenate sets 12: Initialize V∗= V∗.VertexCluster (v)
13: end for
14: Initialize E∗= /0
15: foreach edge of G1, (u, v)∈ E1do
16: Initialize EdgeCluster (u, v) ={(u,v)}
17: foreach pair (k, l)∈ VertexCluster (u) ×VertexCluster (v), (u,v) ∈ E1do
18: if (k, l)form an edge then
19: EdgeCluster (u, v)←− EdgeCluster (u,v) ∪ (k,l) 20: end if
21: end for ◃ Concatenate sets
22: E∗= E∗.EdgeCluster (u, v) 23: end for
24: end for
25: Ω ←− /0
26: Ω ←− Seed − Expansion(E∗,V∗)
27: A←− /0 ◃ Generation a feasible solution with a set of mutually disjoint match sets. The parameters K, Tmin, Tmaxand s control the SA
28: A←− Simulated − annealing(Ω,K,Tmin, Tmax, s)
29: return A
30:
3
Results and Discussion
3.1
Test Datasets
To evaluate the performance of the proposed method on real PPI networks, we tested MAPPIN on the same datasets used in the original publication of NetCoffee [28]. There are four datasets of up to five eukaryotic species, which include Homo sapiens (Human), Mus musculus (Mouse), Drosophila melanogaster (Fly), Caenorhabditis elegans (Worm) and Saccharomyces cerevisiae (Yeast). The five eukaryotic PPI networks collected all experimentally from the public database IntAct [33]. The number of proteins and interactions of these PPI networks are given in Table2.
For applying the functional similarity during the alignment process, GO information was collected from UniProt-GOA to annotate proteins with the three basic types of ontologies: biological process (BP), molecular function (MF) and cellular component (CC). To exclude unreliable function annotations, GOA with evidence codes IEA (inferred from electronic annotation) and ISS (inferred from sequence or struc-tural similarity) were discarded. Therefore, to compute the semantic similarity between two GO terms, MAPPIN uses the definition of functional similarity proposed by Schlicker et al. [32]. The functional sim-ilarity between two proteins is based on the semantic similarities of the GOA assigned to the proteins. Our proposed approach uses two types of GOA file taken from UniProt-GOA: i) Firstly, the set that contains all GOA for canonical accessions from the UniProt reference proteomes for all species, which provide one protein per gene; ii) Secondly, the set that contains all GOA for isoforms from the UniProt reference proteome for the species, which provides one protein per gene.
Table 2: Characteristics of the PPI Networks and Datasets from 5 Species. Species Proteins Interactions D1 D2 D3 D4 H.sapiens 8777 28 366 × × M.musculus 1531 1626 × × D.melanogaster 1534 2664 × × × × C.elegans 767 915 × × × × S.cerevisiae 5739 36 226 × ×
3.2
Experimental Setup
We have implemented our approach in the C++ language using the LEMON Graph Library [34] version 1.3.1. We compared the performance of the proposed multiple network alignment method versus the pioneering ones of the state-of-the-art algorithms: IsoRankN [29], NetCoffee [28] and SMETANA [24].
For the three multiple network alignment algorithms, we set the Al pha parameter to 0.3. Addition-ally, for IsoRank-N, we set the parameters: K = 20, T hr = 0.4 and maxveclen = 106. We used default parameters for NetCoffee (i.e., s = 0.005, K = 100, N = 2000, Tmin= 10, Tmax= 100 andη= 1.0 ) and for
SMETANA. Finally, in the proposed method (MAPPIN), we set T hr = 0.1, and we tuned its SA parameters
(i.e., K = 100, N = 1500, Tmin= 10 and Tmax= 100) for the dataset D4 and for the other datasets we set
T hr = 0.3 and we modify the SA parameters (i.e., K = 50, N = 1000, Tmin = 10 and Tmax = 50). We
applied this two configuration modes, because they gives us the best results in terms of ME and MNE. All experiments were performed on a personal computer with a 3.40 GHz Intel i7 processor and 16GB memory. We used eight threads for each testing.
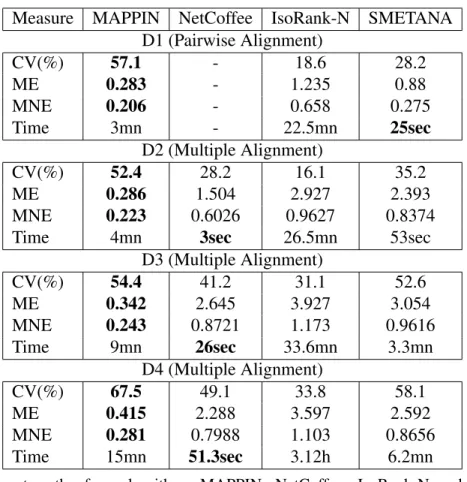
Table 3: Comparative Consistency on the Five Eukaryotic Net-works.
Measure MAPPIN NetCoffee IsoRank-N SMETANA D1 (Pairwise Alignment) CV(%) 57.1 - 18.6 28.2 ME 0.283 - 1.235 0.88 MNE 0.206 - 0.658 0.275 Time 3mn - 22.5mn 25sec D2 (Multiple Alignment) CV(%) 52.4 28.2 16.1 35.2 ME 0.286 1.504 2.927 2.393 MNE 0.223 0.6026 0.9627 0.8374 Time 4mn 3sec 26.5mn 53sec
D3 (Multiple Alignment) CV(%) 54.4 41.2 31.1 52.6 ME 0.342 2.645 3.927 3.054 MNE 0.243 0.8721 1.173 0.9616 Time 9mn 26sec 33.6mn 3.3mn D4 (Multiple Alignment) CV(%) 67.5 49.1 33.8 58.1 ME 0.415 2.288 3.597 2.592 MNE 0.281 0.7988 1.103 0.8656 Time 15mn 51.3sec 3.12h 6.2mn
note: the four algorithms MAPPIN, NetCoffee, IsoRank-N and SMETANA were tested on the five datasets. Each row lists the cover-age (CV), mean entropy (ME), mean-normalized entropy (MNE) and the running time. Sec, mn and h in the row of time represent seconds, minutes and hours. Best results are indicated in bold with respect to each row. The symbol (-) indicates that the tool couldn’t align this particular Dataset.
3.3
Performance Comparison
To assess the quality and the performance of the alignment, we apply the coverage and consistency and the required running times for aligning k networks as the same metrics used in [28].
To measure the overall accuracy of the proposed methods, we report the following performance met-rics:
• Coverage (CV): Reflects the amount of protein in the whole set of proteins that are covered by the
alignment. (see Table3).
• Consistency: To assess the functional coherence of the produced alignments, the Mean Entropy
(ME) and the Mean Normalized Entropy (MNE) of the alignments are computed.
• Running time: The running time required to align the each five Datasets.
MAPPIN aims to produce a global alignment that has a good consistency while covering as many proteins as possible. As depicts Table3, the MAPPIN algorithm reaches high CV, ME and MNE across all
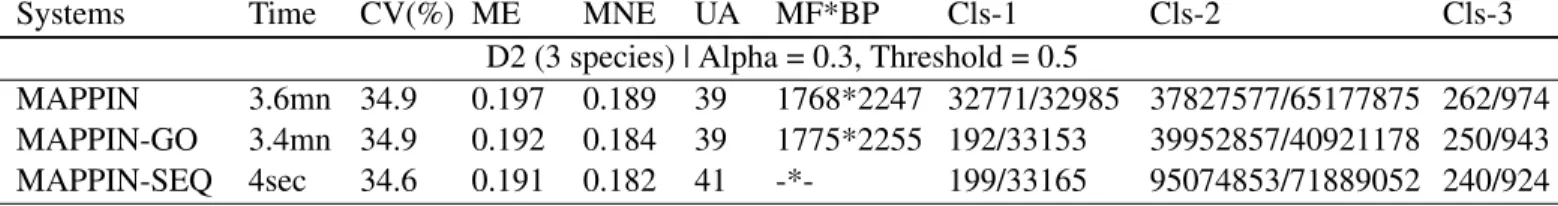
Table 4: MAPPIN - sequence only versus sequence and function alignment for exactly k species
Systems Time CV(%) ME MNE UA MF*BP Cls-1 Cls-2 Cls-3
D2 (3 species) | Alpha = 0.3, Threshold = 0.5
MAPPIN 3.6mn 34.9 0.197 0.189 39 1768*2247 32771/32985 37827577/65177875 262/974 MAPPIN-GO 3.4mn 34.9 0.192 0.184 39 1775*2255 192/33153 39952857/40921178 250/943
MAPPIN-SEQ 4sec 34.6 0.191 0.182 41 -*- 199/33165 95074853/71889052 240/924
note: the three modes of our algorithms were tested on the two datasets. Each row lists the running time, the coverage (CV), mean entropy (ME), mean-normalized entropy (MNE), unknown alignment (UA), the number of proteins anno-tated with Molecular Function (MF) and Biological Process (BP) in alignment graph and the number of clusters contains proteins predicted from exactly k species (Cls-k).
cases, showing that it can accurately align real PPI networks. As the coverage shows, MAPPIN predicts more clusters with more proteins than do its competitors. In addition our approach provides a lower entropy than the other methods which reflect more functionally coherent of its GOA. NetCoffee [28] shows good performance on the all Datasets, with a slightly lower CV and a slightly higher ME. In addition, IsoRankN [29] gives fair results on real PPI networks compared to MAPPIN, SMETANA and NetCoffee algorithms. Nevertheless, NetCoffee cannot align the Dataset 1 (Pairwise Alignment), because it is based on the technique of T-Coffee [28] which can align networks with k≥ 3. SMETANA gives a good coverage for all the five Datasets, but sacrificing the low value for the mean entropy (ME).
3.4
Evaluations Based on Biological Relevance of Aligned Pairs
MAPPIN provides different options of network alignment in different modes including: A) MAPPIN-SEQ: aligns two networks using only sequence information provided by the user. B) MAPPIN-GO: aligns two networks using only functional information provided by the user. C) MAPPIN: aligns two networks using sequence information and function information provided by the user.
As the Table 4 depicts, MAPPIN and GO performed consistently better than MAPPIN-SEQ in most pairs of species. The size of conserved networks by MAPPIN alignments are often larger than MAPPIN-GO and MAPPIN-SEQ, with more aligned protein pairs that are either homologous or functionally similar or both. MAPPIN provides additional equivalences that are biologically similar in function thanks to the use of addition information from the network and GOA. MAPPIN has more protein pairs with higher functional similarities and fewer pairs with low similarities than MAPPIN-SEQ. There are a much pairs of proteins with functional similarities larger than 0.5, as compared to aligned pair in MAPPIN-SEQ. The k−th row contains, for each program, the number of predicted clusters for covering exactly k species and number of constituent proteins in those clusters. We find that for the k = 3 species, and for all the other Datasets, MAPPIN predicts more clusters with more proteins (Table 3) than other methods. Thus, it has higher consistency capable of detecting more distant multiple network homology. However, it is worthy to conclude, that using only the functional similarities in aligning the 3 species gives coherent alignment without relying on a sequence similarity.
To sum up, we can say that MAPPIN aligned PPINs with a good balance in different measures includ-ing sequence, protein function and network topology. Moreover as shown on the Table5, relying only on the sequence information do not lead to functional coherent alignment, resulting in mapping of equivalent proteins having little or no functional similarities and can also result in the missing of many true equiva-lences. Therefore, the produced alignment between PPI networks using MAPPIN-SEQ can discover a less accurate conserved functional modules, which influence directly on predicting unknown function protein.
Table 5: MAPPIN alignment of the D4 Dataset showing the missing of many true equivalences when relying only on sequence information.
Protein Pairs Sequence
score
Functional score P04629: Protein(High affinity nerve growth factor receptor), Gene(NTRK1),
Or-ganism(Homo sapiens) 0.209923 0.806319
P15209: Protein(BDNF/NT-3 growth factors receptor), Gene(Ntrk2), Organ-ism(Mus musculus)
P46459: Protein(Vesicle-fusing ATPase), Gene(NSF), Organism(Homo sapiens)
0.209923 0.966989 P46460: Protein(Vesicle-fusing ATPase), Gene(NSF), Organism(Mus musculus)
Q9ULB1: Protein(Neurexin-1), Gene(NRXN1), Organism(Homo sapiens)
0.209923 0.942397 Q9CS84: Protein(Neurexin-1), Gene(NRXN1), Organism(Mus musculus)
Q86UR1: Protein(NADPH oxidase activator 1), Gene(NOXA1), Organism(Homo
sapiens) 0.398556 0.133281
O08641: Protein(SH3 domain-containing YSC84-like protein 1), Gene(Sh3yl1), Organism(Mus musculus)
Q04721: Protein(Neurogenic locus notch homolog protein 2), Gene(NOTCH2),
Or-ganism(Homo sapiens) 0.470259 0.179771
Q8C8R3: Protein(Ankyrin-2), Gene(Ank2), Organism(Mus musculus)
P51159: Protein(Ras-related protein Rab-27A), Gene(RAB27A), Organism(Homo
sapiens) 0.177534 0.982277
Q9ERI2: Protein(Ras-related protein Rab-27A), Gene(Rab27a), Organism(Mus musculus)
3.5
Running Time Requirements
Another observation we can make in Table3is the computation time for aligning the 5 species. SMETANA and NetCoffee required the least computation time for multiple network alignment, while IsoRank-N is the slowest tool. Although MAPPIN yielded accurate alignment results for real PPI networks, it also required the largest amount of computation time for each Dataset. The reason behind the relatively longer running time is the time required to loading the gene annotation file for each species. The required time of our approach for charging the annotation for each species is roughly equal to 2 minutes.
4
Conclusion and Future Works
In this paper, we present an efficient method for computing multiple PPI networks alignments. We reveal the effectiveness of our approach on the five eukaryotic species. Our results prove that MAPPIN has higher coverage and consistency compared to the others approaches. The results of the method described in this paper can be used to predict protein complexes in the given species or predict the function of proteins by inheriting the annotation available of the aligned protein from the other species. The proteins that are not mapped might result from evolutionary events such as gene deletions and the formation of new genes. Therefore, another directions for future works, is trying to predict GOA for unannotated proteins which may lead to transfer the knowledge across PPI networks and potential discoveries in evolutionary biology.
Acknowledgment
This work was partially supported by the French Embassy in Tunis, through a visit grant SSHN to the first author.
References
[1] OSMAN Ahmed. Yeast two-hybrid assay for studying protein-protein interactions. Parasite Genomics Protocols,
270:403–422, 2004.
[2] Ruedi Aebersold and Matthias Mann. Mass spectrometry-based proteomics. Nature, 422:198–207, 2003.
[3] Chris Stark et al. Biogrid: a general repository for interaction datasets. Nucleic Acids Research, 34(Database-Issue):535– 539, 2006.
[4] Damian Szklarczyk et al. The STRING database in 2011: functional interaction networks of proteins, globally integrated and scored. Nucleic Acids Research, 39(Database-Issue):561–568, 2011.
[5] Yanhui Hu et al. An integrative approach to ortholog prediction for disease-focused and other functional studies. BMC
Bioinformatics, 12:357, 2011.
[6] Padmavati Sridhar et al. An iterative algorithm for metabolic network-based drug target identification. In Biocomputing
2007, Proceedings of the Pacific Symposium, Maui, Hawaii, USA, 3-7 January 2007, pages 88–99, 2007.
[7] Lizhu Ma and Young-Rae Cho. Semantic mapping to align ppi networks and predict conserved protein complexes. In
Bioinformatics and Biomedicine (BIBM), 2015 IEEE International Conference on, pages 1608–1613. IEEE, 2015.
[8] Oleksii Kuchaiev and Nataša Pržulj. Integrative network alignment reveals large regions of global network similarity in yeast and human. Bioinformatics, 27(10):1390–1396, 2011.
[9] Adriana Birlutiu et al. A bayesian framework for combining protein and network topology information for predicting protein-protein interactions. IEEE/ACM Transactions on Computational Biology and Bioinformatics (TCBB), 12(3):538– 550, 2015.
[10] Cheng-Yu Ma et al. Identification of protein complexes by integrating multiple alignment of protein interaction networks.
Bioinformatics (Oxford, England), 2017.
[11] Yoan Renaud et al. Dropnet: a web portal for integrated analysis of Drosophila protein-protein interaction networks.
Nucleic Acids Research, 40(Web-Server-Issue):134–139, 2012.
[12] Mikhail Zaslavskiy et al. Global alignment of protein–protein interaction networks by graph matching methods.
Bioin-formatics, 25(12):i259–1267, 2009.
[13] Ahed Elmsallati et al. Global alignment of protein-protein interaction networks: A survey. IEEE/ACM Trans. Comput.
Biology Bioinform., 13(4):689–705, 2016.
[14] Pietro Hiram Guzzi and Tijana Milenkovi´c. Survey of local and global biological network alignment: the need to reconcile the two sides of the same coin. Briefings in bioinformatics, page bbw132, 2017.
[15] Pietro H Guzzi, Pierangelo Veltri, Swarup Roy, and Jugal K Kalita. Modula: A network module based local protein interaction network alignment method. In Bioinformatics and Biomedicine (BIBM), 2015 IEEE International Conference
on, pages 1620–1623. IEEE, 2015.
[16] Andrei Todor, Alin Dobra, and Tamer Kahveci. Probabilistic biological network alignment. IEEE/ACM Transactions on
Computational Biology and Bioinformatics, 10(1):109–121, 2013.
[17] Marco Mina and Pietro Hiram Guzzi. Improving the robustness of local network alignment: design and extensive assess-ment of a markov clustering-based approach. IEEE/ACM Transactions on Computational Biology and Bioinformatics
(TCBB), 11(3):561–572, 2014.
[18] Somaye Hashemifar and Jinbo Xu. Hubalign: an accurate and efficient method for global alignment of proteinâ ˘A ¸Sprotein interaction networks. Bioinformatics, 30(17):i438, 2014.
[19] Somaye Hashemifar et al. Modulealign: module-based global alignment of protein–protein interaction networks.
Bioin-formatics, 32(17):i658–i664, 2016.
[20] Boon-Siew Seah et al. Dualaligner: a dual alignment-based strategy to align protein interaction networks. Bioinformatics, page btu358, 2014.
[21] Vladimir Gligorijevi´c, Noël Malod-Dognin, and Nataša Pržulj. Fuse: multiple network alignment via data fusion.
Bioin-formatics, page btv731, 2015.
[22] Connor Clark and Jugal Kalita. A multiobjective memetic algorithm for ppi network alignment. Bioinformatics, page btv063, 2015.
[23] Jason Flannick et al. Automatic parameter learning for multiple local network alignment. Journal of computational
biology, 16(8):1001–1022, 2009.
[24] Sayed Mohammad Ebrahim Sahraeian and Byung-Jun Yoon. Smetana: accurate and scalable algorithm for probabilistic alignment of large-scale biological networks. PloS one, 8(7):e67995, 2013.
[25] Maxim Kalaev et al. Networkblast: comparative analysis of protein networks. Bioinformatics, 24(4):594–596, 2008. [26] Jialu Hu and Knut Reinert. Localali: an evolutionary-based local alignment approach to identify functionally conserved
modules in multiple networks. Bioinformatics, 31(3):363–372, 2015.
[27] Ferhat Alkan and Cesim Erten. Beams: backbone extraction and merge strategy for the global many-to-many alignment of multiple ppi networks. Bioinformatics, 30(4):531–539, 2014.
[28] Jialu Hu et al. Netcoffee: a fast and accurate global alignment approach to identify functionally conserved proteins in multiple networks. Bioinformatics, 30(4):540–548, 2014.
[29] Chung-Shou Liao et al. Isorankn: spectral methods for global alignment of multiple protein networks. Bioinformatics, 25(12), 2009.
[30] Scott Kirkpatrick et al. Optimization by simulated annealing. science, 220(4598):671–680, 1983.
[31] Zvi Galil. Efficient algorithms for finding maximal matching in graphs. In Colloquium on Trees in Algebra and
Program-ming, pages 90–113. Springer, 1983.
[32] Andreas Schlicker et al. A new measure for functional similarity of gene products based on gene ontology. BMC
Bioinformatics, 7(1):302, 2006.
[33] Samuel Kerrien et al. The intact molecular interaction database in 2012. Nucleic Acids Research, 40(Database-Issue):841– 846, 2012.
[34] Balázs Dezso et al. LEMON - an open source C++ graph template library. Electr. Notes Theor. Comput. Sci., 264(5):23– 45, 2011.