• Aucun résultat trouvé

Condition assessment of concrete in hydraulic structures by surface wave non-destructive testing

N/A
N/A
Protected

Academic year: 2021

Partager "Condition assessment of concrete in hydraulic structures by surface wave non-destructive testing"

Copied!
29
0
0

Texte intégral

(1)

Publisher’s version / Version de l'éditeur:

Materials and Structures, 42, 2, pp. 251-261, 2009-03-01

READ THESE TERMS AND CONDITIONS CAREFULLY BEFORE USING THIS WEBSITE.

https://nrc-publications.canada.ca/eng/copyright

Vous avez des questions? Nous pouvons vous aider. Pour communiquer directement avec un auteur, consultez la

première page de la revue dans laquelle son article a été publié afin de trouver ses coordonnées. Si vous n’arrivez pas à les repérer, communiquez avec nous à PublicationsArchive-ArchivesPublications@nrc-cnrc.gc.ca.

Questions? Contact the NRC Publications Archive team at

PublicationsArchive-ArchivesPublications@nrc-cnrc.gc.ca. If you wish to email the authors directly, please see the first page of the publication for their contact information.

NRC Publications Archive

Archives des publications du CNRC

This publication could be one of several versions: author’s original, accepted manuscript or the publisher’s version. / La version de cette publication peut être l’une des suivantes : la version prépublication de l’auteur, la version acceptée du manuscrit ou la version de l’éditeur.

For the publisher’s version, please access the DOI link below./ Pour consulter la version de l’éditeur, utilisez le lien DOI ci-dessous.

https://doi.org/10.1617/s11527-008-9382-x

Access and use of this website and the material on it are subject to the Terms and Conditions set forth at

Condition assessment of concrete in hydraulic structures by surface wave non-destructive testing

Al Wardany, R.; Ballivy, G.; Rivard, P.

https://publications-cnrc.canada.ca/fra/droits

L’accès à ce site Web et l’utilisation de son contenu sont assujettis aux conditions présentées dans le site LISEZ CES CONDITIONS ATTENTIVEMENT AVANT D’UTILISER CE SITE WEB.

NRC Publications Record / Notice d'Archives des publications de CNRC:

https://nrc-publications.canada.ca/eng/view/object/?id=940a0d61-2f27-46a2-938f-38096befd398 https://publications-cnrc.canada.ca/fra/voir/objet/?id=940a0d61-2f27-46a2-938f-38096befd398

(2)

http://irc.nrc-cnrc.gc.ca

Condit ion a sse ssm e nt of c onc re t e in hydra ulic st ruc t ure s

by surfa c e w a ve non-de st ruc t ive t e st ing

N R C C - 4 9 4 9 1

A l W a r d a n y , R . ; B a l l i v y , G . ; R i v a r d , P .

M a r c h 2 0 0 9

A version of this document is published in / Une version de ce document se trouve dans: Materials and Structures, v, 42, no. 2, pp. 251-261

The material in this document is covered by the provisions of the Copyright Act, by Canadian laws, policies, regulations and international agreements. Such provisions serve to identify the information source and, in specific instances, to prohibit reproduction of materials without written permission. For more information visit http://laws.justice.gc.ca/en/showtdm/cs/C-42

Les renseignements dans ce document sont protégés par la Loi sur le droit d'auteur, par les lois, les politiques et les règlements du Canada et des accords internationaux. Ces dispositions permettent d'identifier la source de l'information et, dans certains cas, d'interdire la copie de documents sans permission écrite. Pour obtenir de plus amples renseignements : http://lois.justice.gc.ca/fr/showtdm/cs/C-42

(3)

CONDITION ASSESSMENT OF CONCRETE IN HYDRAULIC STRUCTURES BY SURFACE WAVE NON-DESTRUCTIVE TESTING

Riad Al Wardany, Gerard Ballivy and Patrice Rivard

Riad Al Wardany1 (Corresponding Author) Postdoctoral researcher

Civil Engineering Department University of Sherbrooke 2500 boulevard de l’Université Sherbrooke (Qc), Canada, J1K 2R1 Phone: (819) 821-7115 Fax: (306) 780-3421 Email: Riad.Al.Wardany@USherbrooke.ca Gerard Ballivy Professor

Civil Engineering Department University of Sherbrooke 2500 boulevard de l’Université Sherbrooke (Qc), Canada, J1K 2R1 Phone: (819) 821-7115 Fax: (819) 821-7974 Email: Gerard.Ballivy@USherbrooke.ca

1 Riad Al Wardany is currently a Research Officer at the National Research Council Canada, Centre for Sustainable Infrastructure Research (CSIR), Suite 301, 6 Research Drive, S4S 7J7, Regina (SK), Canada, Phone: (306) 780 3846, Fax: (306) 780 3421, Email: riad.alwardany@nrc-cnrc.gc.ca

(4)

Patrice Rivard

Associate Professor

Civil Engineering Department University of Sherbrooke 2500 boulevard de l’Université Sherbrooke (Qc), Canada, J1K 2R1 Phone: (819) 821-8000, # 63378 Fax: (819) 821-7974 Email: Patrice.Rivard@USherbrooke.ca

(5)

ABSTRACT

Maintenance and rehabilitation of concrete structures affected by Alkali-Aggregate Reaction (AAR) require conducting detailed assessment of the concrete conditions, mainly close to the surface where the damage is more severe. This paper presents insitu investigations by surface wave testing of near-surface AAR damage in two hydraulic structures. The survey was carried out using a non-intrusive multi-sensor method that involves frequency-wavenumber analysis of surface waves. The method allows for solving Rayleigh surface wave propagation modes required for the determination of the shear wave velocity in terms of depth. The variation of Young’s modulus with concrete depth can be estimated from the obtained shear wave velocity profile. Two different cases of surface wave propagation, typical of concrete structures, are discussed in this paper. The tests were conducted from the concrete surface only and the subsurface quality was mapped up to a depth of 1.50 m. The applications show that the proposed surface wave method is a potential non-destructive evaluation method that can be used to detect and locate near surface damage in concrete structures.

KEYWORDS: surface waves; frequency-wavenumber analysis; non-destructive testing;

(6)

RÉSUMÉ

La maintenance et la réhabilitation des structures en béton atteintes de Réaction Alcalis-Granulats (RAG) requièrent une étude détaillée de la qualité du béton, principalement près de la surface où l’endommagement est le plus sévère. Cet article présente les résultats d’investigation par ondes de surface de l’endommagement attribuable à la RAG dans deux structures hydrauliques. Les mesures ont été effectuées en utilisant une méthode non intrusive à plusieurs capteurs, qui intègre l’analyse fréquence-nombre d’onde des ondes de surface. Cette méthode permet de résoudre les modes de propagation des ondes Rayleigh de surface, nécessaires pour la détermination de la vitesse des ondes de cisaillement en fonction de la profondeur. La variation du module d’élasticité avec la profondeur peut être estimée à partir du profil de vitesse des ondes de cisaillement obtenu. Deux cas différents de propagation des ondes de surface, typiques pour les structures en béton, sont discutés dans cet article. Les tests ont été effectués à partir de la surface du béton seulement, et la qualité du béton a été cartographiée jusqu'à une profondeur égale à 1.5 m. Les présentes applications montrent une méthode non destructive potentielle qui peut être utilisée pour détecter et localiser l’endommagement près de la surface du béton.

MOTS CLÉS: ondes de surface; analyse fréquence-nombre d’onde; contrôle non destructif;

(7)

INTRODUCTION

The Alkali-Aggregate Reaction (AAR) is a common problem in concrete structures that have reactive aggregates and which are subject to critical environmental conditions. AAR severely attacks a large number of hydraulic structures, including dams and navigation structures. In such structures, AAR produces swelling silica gel in concrete that induces significant expansions, loss of mechanical properties and cracks in concrete. This can influence the serviceability and the safety conditions of the structure.

Repair and maintenance of hydraulic structures suffering from AAR are essential due to their high economic and strategic interest. The assessment of the concrete condition in the whole section of the structure to locate damaged zones is often required prior to repair works. Sonic tomography is a good tool to non-destructively meet this need. However, the test requires accessibility to two parallel surfaces, and the method reaches its limitation when the accessibility to the concrete is restricted to a single surface. On the other hand, surface wave methods can be conducted from a single accessible surface jointly with sonic tomography to characterize concrete.

SURFACE WAVE METHODS

Surface wave methods, such as Steady State, Spectral Analysis of Surface Waves (SASW) and Multichannel Analysis of Surface Waves (MASW) are non-intrusive insitu methods initially developed to evaluate elastic properties of layered soils and pavement systems [1, 2, 3]. They consist of generating elastic waves in the medium under testing by hitting its surface with a mechanical energy source. The waves are recorded on the same surface at a certain distance from the source using one, two or more sensors. The generated waves are: pressure wave, shear wave, and Rayleigh surface wave. The Rayleigh waves in the medium are a set of waves having

(8)

different frequencies (i.e. different wavelengths). They are “dispersive” in layered media; this implies that the waves associated with different frequencies propagate with different phase velocities.

A given Rayleigh wave that has a frequency f and a wavelength λ propagates into the medium

with a phase velocity Vph; it perturbs the material particles in a zone starting at the surface and

ending at a depth approximately equal to 2λ; the velocity Vph is dependent of the properties of the

material in the perturbed zone. This characteristic of propagation gives the generated “packet” of Rayleigh waves (set of different wavelengths) the capability to scan the medium with depth: waves having short wavelengths propagate in shallow zones and those with long wavelengths go deeper into the medium. Thus, the signals recorded at the surface hold information on both the shallow and deep zones of the medium. To extract the information, a “dispersion curve” illustrating the phase velocity of the different frequency components of the Rayleigh waves is calculated from the signals recorded at the surface. The dispersion curve is used to estimate the material properties in terms of depth (stiffness profile); this operation is performed through an iterative process called “inversion”.

SPECTRAL ANALYSIS OF SURFACE WAVE METHOD AND ITS LIMITATIONS

The Spectral Analysis of Surface Wave method [2, 3] was the first significant progress in the field of surface wave non-destructive testing after the work of Jones, 1958 [1]. The test setup of SASW method involves two receivers, positioned on the surface of the medium under testing. The data are collected by hitting the surface, using an impact source (e.g. hammer), at a distance from the first receiver equal to that between the two receivers. The same operation is repeated several times with different spacings between the receivers. For each spacing, two signals are recorded and a dispersion curve is calculated; this curve is filtered using certain empirical criteria

(9)

to remove unacceptable data. The final dispersion curve is the average of all the curves obtained from the different spacings.

Unfortunately, the calculated dispersion curve often presents high fluctuations that lead to ambiguity in the result. The fluctuations occur because different modes of surface waves participate in the SASW test and thus break the basic assumption of single mode propagation implemented in the SASW method [4, 5, 6]. The problem is more complex in finite thickness media when other types of dispersive waves contribute to the SASW test. An illustrative example is “Lamb waves”, which are dominant at the surface of concrete slabs and have multi-mode propagation (symmetrical and antisymmetrical modes). In this case, the SASW dispersion curve presents high fluctuations and the interpretation of the result is more difficult.

To solve the mode problem and overcome the limitation of the SASW method, multi-sensor methods such as the Multichannel Analysis of Surface Waves (MASW) [7] and the frequency-wavenumber analysis of surface waves [8] can be used. The accuracy of these methods was demonstrated in several soil and pavement applications; the FK method (F: frequency, K: wavenumber), in particular, has shown a good level of accuracy in concrete applications [9].

SCOPE OF WORK

This paper presents insitu applications of the FK method to assess concrete conditions in two hydraulic structures affected by AAR. Two cases with typical results that can be obtained for concrete mass are discussed. The paper outlines the capability of the FK method to accurately characterize concrete in terms of depth, by conducting measurements on a single accessible surface.

(10)

STRUCTURES UNDER INVESTIGATION

The investigated structures are two concrete hydraulic structures located in Eastern Canada, in service since 1959. The first structure (structure-1), made with a reactive clayey limestone coarse aggregate, is affected by AAR, which has developed over the years under conditions of saturation, warm summer temperature and high content of alkalis. The structure shows various levels of expansion and cracks in concrete. The second structure studied (structure-2) is less affected, and the concrete made with reactive sandstone coarse aggregates, appears to be in relatively good condition.

SURVEY PROGRAM

Sonic tomography was conducted to characterize the bulk of concrete in the transversal sections of the two structures. FK tests were performed to characterize the near surface zone of concrete in several locations [10]. Only the FK results are presented in this paper.

FK METHOD

The FK method used in the current investigations consists of three main parts: (1) test setup and data collection, (2) data processing and (3) inversion.

Test setup

A linear array of Na accelerometers with equal spacing dx between each couple is placed at the concrete surface as illustrated in Figure 1. The surface is hit at a distance d from the first sensor in the array by a steel ball or hammer to generate surface waves. The distance d is chosen in a manner to allow complete formation of the generated surface waves before they reach the array of accelerometers. Large values of d are to be avoided, in order to reduce the attenuation of high

(11)

frequency component of surface waves required to characterize the shallow concrete (first 0.15 m).

The spacing dx is chosen to be equal to or less than double the depth that the investigation will start from; for example, if the operator needs to investigate the concrete starting at a depth of 0.025 m from the surface, then the spacing between the accelerometers should not exceed 0.05 m.

An external trigger is used to start data acquisition at the same moment as the impact. The acquired signals are amplified and stored in a portable data acquisition system. Each time an acquisition is done, the source is moved away a certain distance equal to Na × dx and a new acquisition is made. The operation is repeated several times at Np source positions in order to collect a sufficient number of signals. The number of source positions is determined from the maximum depth D that the operator wants to investigate using:Np≥[2D/(Na×dx)].

Data Processing

The collected data are transformed from the time-space (i.e., time-distance) domain to the frequency-wavenumber domain to solve the multi-mode propagation problem of surface waves. The operation is performed by applying a Fast Fourier Transform (FFT) on the time and the space records consecutively. The obtained image is called an “FK image”; it is a 2D representation of the propagating elastic wave energy at the concrete surface.

The spatial and/or the time records are zero padded (i.e., a number of zero-amplitude points are added at the end of the signals in the time and/or the space direction) before the FFT is applied; this improves the resolution of the FK image and identifies better the different modes of surface waves.

(12)

Surface wave modes are extracted by selecting, on the FK image, the maxima of energy (crests) for each frequency. Finally, the dispersion curves are obtained by plotting the extracted data in the frequency-phase velocity domain or in the phase velocity-wavelength domain.

Inversion

Rayleigh surface wave dispersion curves are theoretically smooth; thus, they don’t allow easy distinction between the different layers of a medium under investigation. In theory, a stratified medium can be modeled as a system having different layers with different or equal thicknesses (h); each layer is homogeneous, isotropic and has specific elastic properties (Young’s modulus [E], Poisson’s ratio [ν]) and mass density (ρ). These properties determine two other intrinsic

properties of the layer’s material including pressure wave velocity,

[1] VP = {E (1- ν) / [ ρ (1+ ν) × (1-2 ν)]}0.5

and shear wave velocity,

[2] VS = {E / [2 ρ (1+ ν)]}0.5

Surface wave propagation theory provides equations and methods to calculate the theoretical dispersion curves (modes) of Rayleigh surface waves for such systems [11, 12].

In practice, the dispersion curves are experimentally measured by the FK method; the inverse problem has to be solved in order to estimate the properties of the different layers in the tested medium. Since the inverse problem is nonlinear, the calculation is made through an iterative process. This automated operation models the medium as a system of horizontal layers with

(13)

different or equal thicknesses; a mass density, a Poisson’s ratio and a shear wave velocity are defined for each layer. The choice of these parameters in the first iteration (initial profile) is made by the operator. In this task, the operator can use available information and data from previous tests conducted on retrieved cores. The more realistic the initial profile is, the faster the inversion process converges.

In each iteration, the theoretical dispersion curve associated with the fundamental mode of Rayleigh surface waves is calculated using surface wave propagation theory. The obtained curve is compared with the experimentally measured dispersion curve: if the relative difference between the two curves is not acceptable (user-defined percentage), then the model is updated by assuming a new shear wave velocity profile.

The shear wave velocity has the greater effect on the calculation of the theoretical dispersion curve. The mass density and the Poisson’s ratio have negligible or minor effects [2, 9]; they may be not changed during the iterations. The same calculation process is repeated in a new iteration. When the experimentally measured and the theoretically computed curves become sufficiently close, the inversion process ends. The model assumed in the last iteration is considered as representative of the tested medium.

If higher order modes are experimentally identified, the theoretical higher order modes are calculated for the estimated model. Thereafter, the computed theoretical curves are overlaid on the experimental data; the better the curves match, the greater the probability that the solution is unique and thus the more reliable the estimation is. Additional iterations may be required to improve the matching between the experimental and the theoretical multi-mode data.

(14)

The computing operations in the inversion process and its algorithm are complex and they are not presented in this paper; more details can be found in [2, 13, 14].

DATA COLLECTION

Several FK tests were conducted in different zones of the investigated structures. Two tests FK-1 and FK-2 were carried out in the upper galleries of structure-1 and structure-2 respectively, as illustrated in Figure 2, and the results are presented herein. The different parameters of the tests are listed in Table 1. A steel ball high-frequency source (10 kHz to 40 kHz) of 8 mm diameter, and a 250 g. hammer low-frequency source (0.5 kHz to 10 kHz) were used to generate Rayleigh surface waves. These sources can provide the frequency range required to characterize the concrete up to a depth of 1.5 m. The accelerometers were 4396-B&K type with 49 kHz natural frequency.

RESULTS AND DISCUSSIONS Case-1: test FK-1 (Structure-1)

The data acquired with the steel ball and hammer sources were added together by simply adding the amplitudes of the signals. This operation was made to combine the high frequency energy that contains information on the shallow concrete (first 0.15 m), with the low frequency energy that contains information on the deep concrete (0.15 to 1.5 m). The result, presented in Figure 3, illustrates the phenomenon of vibration of the concrete surface produced by the steel ball and the hammer when they hit the surface. Important information that can be obtained from Figure 3 is that the recorded waves disperse as they travel away from the source. This dispersion pattern indicates a medium that consists of different layers with different properties of concrete, and it is associated with Rayleigh surface waves.

(15)

The calculated dispersion curves are plotted in the phase velocity-wavelength domain and shown in Figure 4(a). The identified surface Rayleigh wave modes are observed up to a wavelength equal to 3 m, which is sufficient to characterize the desired depth of 1.5 m; in general, the maximum depth that can be investigated by a given FK test is considered to be approximately half the greatest wavelength involved in that test.

Determination of shear wave velocity profile

The inverse problem was solved using SURF96 computer code [15]; the concrete was initially modeled as a system of eight (8) layers having equal thicknesses of 0.20 m, mass densities of 2500 kg/m3, shear wave velocities of 2500 m/s and pressure wave velocities of 4082 m/s. A Poisson’s ratio equal to 0.20 was implicitly set for all the layers by the shear wave velocity and the pressure wave velocity as defined in the relation:

[3] ν = [(VP / VS)2-2]/[2(VP / VS)2-2]

During all the iterations, the Poisson’s ratio was not changed (i.e. ratio VP / VS maintained equal

to its value in the initial profile) since its effect on the calculated theoretical phase velocity was found to be less than ±2 % for ν varying between 0.15 and 0.25. The shear wave velocity was the

main parameter updated in the model to match the computed theoretical dispersion curve with the experimental one. The pressure wave velocity was updated at the same time as the shear wave velocity using the constant ratio VP / VS. Each time the pressure wave velocity was updated, the

inversion code calculated a new mass density using the Nafe-Drake empirical correlation curve [16]; however, adjusting the mass density is not a vital operation in the inversion process and can be excluded without significantly changing the result.

(16)

The obtained shear wave velocity profile (final iteration) is presented in Figure 4(b). The theoretical Rayleigh wave dispersion curves corresponding to the estimated profile were calculated for the first ten (10) modes and compared with the measured dispersion curves in Figure 4(a). A good agreement is observed between the measured and the computed dispersion curves, which indicates reliable estimation of the concrete properties.

The shear wave velocity profile indicates that the concrete near the surface (first 0.20 m) and that located between 0.80 and 1.50 m depth are in good condition. Concrete with questionable quality was located between 0.20 and 0.80 m depth; these results represent the average concrete quality under the 5.6 m aperture of FK-1.

Mode superposition

Figure 4(a) shows that the modes superpose at wavelengths smaller than 0.70 m. Mode superposition is often encountered in layered systems that are not “normally dispersive”, more specifically, when the upper layers of the stratified medium are relatively stiffer than the layers below. The measured data at those wavelengths are distributed along the inflection points of the modes. Physically, this mode superposition means that Rayleigh surface waves associated with the wavelengths smaller than 0.70 m were propagating with close velocities, and they were still interfering during their propagation along the distance covered by the test (5.6 m). Longer test aperture gives more distance to those waves to be separated and thus allow the modes to be better discriminated; however, the high frequency component (short wavelengths) may be lost due to attenuation.

(17)

Subsurface imaging

In order to make an image of the subsurface quality of the concrete, the collected data were analysed using a test of 3 m aperture (100 signals). The test was moved along the whole data with a step equal to 0.30 m. The shear wave velocity profiles obtained at each position of the moving test were gathered in a 2D representation and mapped along a distance of 2.40 m and to a depth of 1.50 m (Figure 5). The image of Young’s modulus presented in Figure 6 was deduced from the shear wave velocity image, the obtained mass density and the Poisson’s ratio (0.20) using the relation:

[4] E = 2 ρ (1+ ν)× VS 2

The results denote relatively low shear wave velocity in the concrete located between 0.20 m and 0.80 m depth. This zone, where the shear wave propagates at a velocity less than 1500 m/s, seems to be more affected by AAR; it has a Young’s modulus less than or equal to 25 GPa. The rest of the concrete has a shear wave velocity greater than 2000 m/s and a Young’s modulus greater than 30 GPa. This indicates generally a good concrete quality, as noticed at the surface by visual inspection.

Case-2: test FK-2 (Structure-2)

The data collected with the steel ball and the hammer sources were added together in the same manner as FK-1. The result, presented in Figure 7(a), shows a pattern of vibration of particles at the concrete surface different from that observed in case-1 (the propagation of waves doesn’t show high dispersion when traveling away from the source). This pattern is always found when the medium under testing has elastic properties that do not present significant variations with depth (homogenous medium).

(18)

The calculated dispersion curves are plotted in the frequency-phase velocity domain in Figure 7(b). The general trend of the calculated dispersion curves is similar to that of Lamb wave modes, which govern the vibration phenomenon of waves propagating between two parallel surfaces.

Two parameters can be directly obtained from Figure 7(b):

1) The average velocity of shear waves that propagate in the 2 m thick concrete under the test: this value is the asymptotic value to which the higher order modes of Lamb waves tend at high frequency (15 kHz); it was found to be equal to 2750 m/s.

2) The average phase velocity of Rayleigh wave: Rayleigh waves can be identified by the superposition of the symmetrical and antisymmetrical fundamental modes of Lamb waves [17]. These two modes are those with the lowest velocities in the plot. Their superposition occurs at high frequencies where the phase velocity of wave propagation is the same for both modes, and which is equal to that of Rayleigh wave; this is observed at frequencies higher than 2.5 kHz and thus the average phase velocity of Rayleigh wave was found to be equal to 2500 m/s. The phase velocity at 2.5 kHz is 2500 m/s; therefore, the maximum wavelength of Rayleigh waves that could be formed is evaluated to be approximately 1 m (2500 m/s / 2500 Hz = 1m); this implies a maximum investigation depth of 0.50 m (half the maximum wavelength), which represents one quarter of the total thickness of the investigated concrete.

Determination of the general characteristics of the investigated concrete

Based on the determined shear wave velocity (2750 m/s) and the known thickness of the concrete at the location of the test (2 m), Lamb wave theoretical solution was calculated using Lamb wave

(19)

theory [18]; the Poisson’s ratio was changed iteratively to match the theoretical computed curves with the experimental data; the final solution was found at a Poisson’s ratio equal to 0.22.

The pressure wave velocity was found to be equal to 4589 m/s using equation (3). According to Whitehurst’s classification [19], the obtained pressure wave velocity indicates that the concrete at the location of the test is in “excellent” condition. The Young’s modulus was found to be equal to 46.1 GPa using equation (4) and assuming a mass density of 2500 kg/m3. It is important to note that the evaluated parameters (Poisson’s ratio, pressure wave velocity and Young’s modulus) are average characteristics of the 2 m thick concrete under the FK test location.

Determination of shear wave velocity profile

The identified data associated with Rayleigh waves were extracted and presented in the phase velocity-wavelength domain as shown in Figure 8(a). The inversion was performed in the same manner as FK-1, using the same computer code. The concrete was modeled with eight layers having equal thicknesses of 0.05 m and a layer in the bottom of 0.10 m thickness. A mass density of 2500 kg/m3 was set for all layers. The layers were assigned a shear wave velocity and a

pressure wave velocity equal to those obtained from Lamb waves (VS = 2750 m/s and VP = 4589

m/s for all layers). A Poisson’s ratio equal to 0.22 was set for all layers; it was kept constant during all the iterations.

The obtained shear wave velocity profile is presented in Fig 8(b). The corresponding theoretical dispersion curve was compared with the experimental data in Fig 8(a) to examine the reliability of the estimation: a good agreement is observed. The Young’s modulus profile was calculated from the obtained shear wave velocity profile, mass density profile and the Poisson’s ratio using equation (4). The result in Fig 8(c) shows no significant changes in the concrete quality with

(20)

depth. The average values of shear wave velocity (2800 m/s) and Young’s modulus (46 GPa) calculated from the obtained profiles are consistent with those obtained from Lamb waves, and indicate good quality of concrete.

CONCLUSIONS

This paper outlined two typical applications of surface wave testing on concrete hydraulic structures. It was shown that the FK method has the potential to accurately solve the complex problem of surface wave propagation in concrete, and thus provide an estimation of its condition versus the depth. Attention should be given to the identification of the recorded waves; Lamb waves can be formed in parts of the structure, which have finite thickness, and they can be used to evaluate the general properties of the concrete located below the test location.

The evaluated Young’s modulus of concrete was found to have values in structure-1 lower than those in structure-2. This is due to the fact that AAR is more developed in structure-1 than in 2, which led to more cracks and higher amount of silica gel in the concrete of structure-1 and thus decreased its Young’s modulus.

The uncertainty of FK measurements, and that related to the inversion of the shear wave velocity profile, were not calculated in this study. Statistical calculation of uncertainty is suggested for future research.

ACKNOWLEDGMENTS

This work was supported by the Natural Sciences and Engineering Research Council (NSERC)-Industry Research Chair on Concrete NDT and Instrumentation, industrial partners (HydroQuebec and St. Lawrence Seaway) and the University of Sherbrooke. The authors thank

(21)

Clermont Gravel, Danick Charbonneau and Francois Saint-Pierre from University of Sherbrooke for their help in data collection.

REFERENCES

1. Jones RB (1958) In-situ measurement of the dynamic properties of soil by vibration methods. Geotechnique 8: 1-21.

2. Nazarian S (1984) In situ determination of elastic moduli of soil deposits and pavement systems by Spectral Analysis of Surface Waves method. Ph.D. thesis, University of Texas at Austin.

3. Stokoe KH, Wright SG, Bay JA and Roesset JM (1994) Characterization of geotechnical sites by SASW method. Proceedings of the Geophysical Characterization of Sites, ISSMFE Technical Committee 10, New Delhi.

4. Gucunski N and Woods RD (1991) Use of Rayleigh modes in interpretation of SASW test. Proceedings of the Second International Conference on Recent Advances in Geotechnical Earthquake Engineering and Soil Dynamics, St. Louis, 1399-1408.

5. Tokimatsu K, Tamura S, and Kojima H (1992) Effects of multiple modes on Rayleigh wave dispersion, Journal of Geotechnical Engineering, ASCE, 118: 1529-1543.

6. Karray M and Lefebvre G (2000) Identification and isolation of multiple modes in Rayleigh waves testing Methods. Proceedings of the Use of Geophysical Methods in Construction, sessions of Geo-Denver, ASCE, Denver, pp. 80-94.

7. Park CB, Miller RD and Xia J (1999) Multichannel analysis of surface waves. Geophysics, 64: 800-808.

8. Gabriels P, Snieder R and Nolet G (1987) In situ measurement of shear wave velocity in sediments with higher-mode Rayleigh waves. Geophysical Prospecting, 35: 187-196.

(22)

9. Al Wardany R, Ballivy G, Gallias JL, Saleh K and Rhazi J (2007). Assessment of concrete slab quality and layering by guided and surface wave testing. ACI Materials Journal, 104: 268-275. 10. Al Wardany R, Gravel C, Charbonneau D (2005) Évaluation de l’état de l’endommagement des plots 13 et 17 nord de l’écluse St-Lambert par tomographie sonique. Technical Report No. GR-05-08-01, University of Sherbrooke.

11. Rayleigh L (1885) On waves propagating along the plane surface of an elastic solid. Proceedings of the London Mathematical Society, London, pp. 4-11.

12. Schwab F and Knopoff L (1970) Surface wave dispersion computations. Bulletin of the Seismological Society of America, 60: 321-344.

13. Rix GJ and Leipski EA (1991) Accuracy and resolution of surface wave inversion. Proceedings of Recent Advances in Instrumentation, Data Acquisition and Testing of Soil Dynamics, ASCE Geotechnical Special Publication, Orlando, pp. 17-32.

14. Addo KO and Robertson PK (1992) Shear-wave velocity measurement of soils using Rayleigh waves. Canadian Geotechnical Journal, 29: 558–568.

15. Hermann R (1996) Computer programs in seismology, Saint Louis University.

16. Nafe JE and Drake CL (1960) Physical properties of marine sediments. In The Sea 3, M.N. Hill, Ed., Interscience, New York, pp. 794-815.

17. Viktorov IA (1967) Rayleigh and Lamb waves: physical theory and applications. Plenum Publishing Corporation, New York.

18. Lamb H (1917) On waves in an elastic plate. Proceedings of the Royal Society of London, pp. 114-128.

19. Whitehurst EA (1951) Soniscope tests concrete structures. ACI Journal Proceedings, 47: 433-444.

(23)

List of symbols

f frequency λ wavelength Vph phase velocity

Na number of accelerometers

dx spacing between each couple of accelerometers

d distance between the source and the nearest accelerometer Np number of positions of the source at the concrete surface

D desired depth of investigation h layer thickness

E Young’s modulus ν Poisson’s ratio ρ mass density

VP pressure wave velocity

VS shear wave velocity

R-f fundamental mode of Rayleigh waves

A-f antisymmetrical fundamental-mode of Lamb waves S-f symmetrical fundamental-mode of Lamb waves

(24)

Tables

Table 1 - Parameters of the FK tests

FK-1 FK-2

Number of sensors 9 11

Distance between the source and the first sensor (m) 0.20 0.20

Spacing (m) 0.03 0.10

Number of source position 20 5

Total number of signals 180 55

Sampling frequency (kHz) 200 200

(25)

Figure captions

Figure 1 - FK test setup.

Figure 2 - Locations of FK tests in the upper galleries of the hydraulic structures, (a) structure-1, (b) structure-2.

Figure 3 - FK-1: Collected data.

Figure 4 - FK-1: (a) Experimental dispersion curves of Rayleigh waves, ● represent data obtained by selecting absolute maxima energy, ○ represent data obtained by selecting local maxima energy, theoretical Rayleigh wave modes matching the experimental data are overlaid: R-f = fundamental mode, R-1,2,3,etc. = higher order modes; (b) Estimated shear wave velocity profile (final model).

Figure 5 - FK-1: Subsurface image of shear wave velocity (m/s). Figure 6 - FK-1: Subsurface image of Young’s modulus (GPa).

Figure 7 - FK-2: (a) Collected data; (b) Dispersion curves: ● Rayleigh wave data (R-f) associated with the superposition of the two fundamental modes (A-f and S-f) of Lamb waves; theoretical Lamb wave modes matching the experimental data are overlaid: antisymmetrical modes, - - - symmetrical modes.

Figure 8 - FK-2: (a) Experimental dispersion curve of Rayleigh waves; theoretical Rayleigh wave fundamental mode matching the experimental data is overlaid; (b) Corresponding shear wave velocity profile (final model); (c) Calculated Young’s modulus profile.

(26)

Figure 1 - FK test setup.

Figure 2 - Locations of FK tests in the upper galleries of the hydraulic structures,

(a) (b)

(27)

0.2 0.8 1.4 2.0 2.6 3.2 3.8 4.4 5.0 5.6 0.0 0.5 1.0 1.5 2.0 2.5 3.0 3.5 Distance (m) Ti me ( ms )

Figure 3 - FK-1: Collected data.

Figure 4 - FK-1: (a) Experimental dispersion curves of Rayleigh waves, ● represent data obtained by selecting absolute maxima energy, ○ represent data obtained by selecting local maxima energy, theoretical Rayleigh wave modes matching the experimental data are overlaid: R-f =

fundamental mode, R-1, 2, 3, etc. = higher order modes; (b) Estimated shear wave velocity profile (final model).

(a) (b)

R-1

R-2 R-3

(28)

Figure 5 - FK-1: Subsurface image of shear wave velocity (m/s).

(29)

0.2 0.8 1.4 2.0 2.6 3.2 3.8 4.4 5.0 5.6 0.0 0.5 1.0 1.5 2.0 2.5 3.0 3.5 Distance (m) Ti (b) (a) S-f s) e ( m A-f m R-f

Figure 7 - FK-2: (a) Collected data; (b) Dispersion curves:

● Rayleigh wave data (R-f) associated with the superposition of the two fundamental modes (A-f and S-f) of Lamb waves; theoretical Lamb wave modes matching the experimental data are

overlaid: antisymmetrical modes, - - - symmetrical modes.

(c)

(b) (a)

R-f

Figure 8 - FK-2: (a) Experimental dispersion curve of Rayleigh waves; theoretical Rayleigh wave fundamental mode matching the experimental data is overlaid;

(b) Corresponding shear wave velocity profile (final model); (c) Calculated Young’s modulus profile.

Figure

Table 1 - Parameters of the FK tests
Figure 2 - Locations of FK tests in the upper galleries of the hydraulic structures,
Figure 3 - FK-1: Collected data.
Figure 5 - FK-1: Subsurface image of shear wave velocity (m/s).
+2

Références

Documents relatifs

Un jour]‘étais atablé dans un restaurant du quartier avec des amis quand soudain Vient une connaissance nous dire bonjour en nous serrant la main. Ce qui est très impoli car on

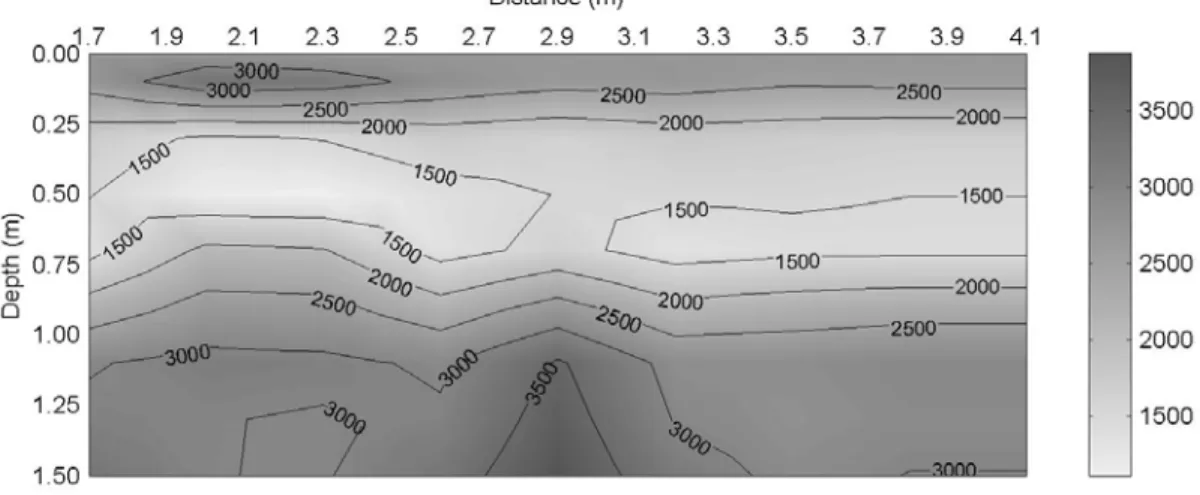
The inversion results of the phase velocity derivative are compared with those of phase and group velocities and show improved estimations for small variations (variation ratio

L’archive ouverte pluridisciplinaire HAL, est destinée au dépôt et à la diffusion de documents scientifiques de niveau recherche, publiés ou non, émanant des

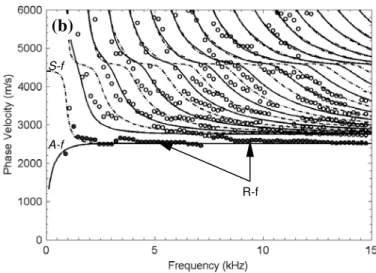
After extraction of the lateral wave in the received signal using the matching pursuit method, the phase velocity dispersion characteristic is determined, and concrete cover

Figure 3 : Receiver signal at position 1.5 cm offset As shown in Fig.3, the received signal is composed of surface wave, diffracted waves, reflected waves and

For 3 samples (969, 910, and 909) 2 graphite fractions (one close to the sample, and one far from the sample) were extracted from the graphite capsule, using the

4(a) Spectra from vaseline glass with the laser focused with plasma generation (blue solid line) and defocused without plasma generation (black solid line); Relationship

Ce chapitre est présenté sous forme d’article intitulé "Weakly nonlinear analysis of Rayleigh-Bénard convection in shear-thinning fluids : nature of the bifurcation and