Publisher’s version / Version de l'éditeur:
Vous avez des questions? Nous pouvons vous aider. Pour communiquer directement avec un auteur, consultez la Questions? Contact the NRC Publications Archive team at
PublicationsArchive-ArchivesPublications@nrc-cnrc.gc.ca. If you wish to email the authors directly, please see the first page of the publication for their contact information.
https://publications-cnrc.canada.ca/fra/droits
L’accès à ce site Web et l’utilisation de son contenu sont assujettis aux conditions présentées dans le site LISEZ CES CONDITIONS ATTENTIVEMENT AVANT D’UTILISER CE SITE WEB.
Research Report (National Research Council of Canada. Construction), 2012-11-21
READ THESE TERMS AND CONDITIONS CAREFULLY BEFORE USING THIS WEBSITE.
https://nrc-publications.canada.ca/eng/copyright
NRC Publications Archive Record / Notice des Archives des publications du CNRC :
https://nrc-publications.canada.ca/eng/view/object/?id=a1242cfd-12dd-435c-8331-3f9a6d1e5672 https://publications-cnrc.canada.ca/fra/voir/objet/?id=a1242cfd-12dd-435c-8331-3f9a6d1e5672
NRC Publications Archive
Archives des publications du CNRC
For the publisher’s version, please access the DOI link below./ Pour consulter la version de l’éditeur, utilisez le lien DOI ci-dessous.
https://doi.org/10.4224/21268323
Access and use of this website and the material on it are subject to the Terms and Conditions set forth at
Evaluation of revised ISO airborne sound insulation ratings
Evaluation of revised ISO airborne
sound insulation ratings
J.S. Bradley
NRC Construction, RR-330
21 November 2012
(revised 24 October 2013)
Contents
Page Contents 1 Summary 2 1. Introduction 4 2. Procedure 5 2.1 Data analyses 52.2 Previous listening tests 5
3. Evaluations of proposed spectrum weightings 9
3.1 Evaluation of weightings included in draft standard ISO 16717-1 9 3.2 Weighting spectra in previous versions of ISO 717-1 14 3.3 Spectrum weightings derived from source spectra 17
3.4 Optimum spectrum weighting for speech sounds 22
3.5 Spectrum weightings derived from revised equal loudness contours 24
3.6 Importance of very low frequency bands 26
4. Rating building elements for multiple types of sounds 27
5. Developing more accurate spectrum weightings 31
6. Discussion and conclusions 33
References 36
Appendix A. Details of spectrum weightings used to calculate sound
Summary
This report evaluates 14 different spectrum weightings considered for possible inclusion in a proposed new ISO 16717-1 standard for the rating of airborne sound insulation. The 14 spectrum weightings were evaluated using previously acquired data consisting of annoyance ratings of speech and music sounds modified to represent transmission through 20 different walls with a wide range of sound transmission characteristics. New measures based on the 14 different spectrum weightings were calculated and tested as predictors of the existing annoyance ratings of speech and music sounds transmitted through the 20 walls to determine the relative accuracy of the new sound insulation measures.
The new results show that many of the spectrum weightings led to similarly accurate predictors of the annoyance due to transmitted music sounds and suggest that only a relatively small number of spectrum weightings can be justified. Based on these new analyses, 3 spectrum weightings are recommended for inclusion in the proposed new standard. The Lliving spectrum weighting is recommended for use with broad spectrum sounds such as the music sounds described in this report. For sounds with predominant low frequency components, such as road traffic noise, the Ltrafficweighting is recommended. A new OptSpeech spectrum weighting is shown to be the most accurate for predicting annoyance due to transmitted speech sounds.
Although the Lliving(50-5000) spectrum weighting was better than the old C(100-3150) weighting, removing only the 50 Hz band from the calculations did not significantly degrade the accuracy. Because of their minimal effect on annoyance and the large errors associated with measurements of 50 Hz indoor sound levels, these values should not be included in sound insulation measures.
Spectrum weightings based on revised equal loudness contours (L30phon and L40phon) were only moderately good predictors of annoyance ratings. This is because equal loudness contours are intended to be indicators of the loudness of single frequency sounds and not of more complex sounds such as speech and music. An ideal spectrum weighting should reflect the importance of each 1/3-octave band to the annoyance ratings. That is, the spectrum weightings are band importance functions for subjective ratings of the transmitted sounds and not simply approximations to the source spectrum.
Compromise spectrum weightings are often proposed to allow predictions of annoyance due to a range of spectrally different sounds. Such compromise spectrum weightings will always lead to less accurate predictions and should be
avoided. It is better to calculate multiple ratings for building elements and to base criteria on those measures which are relevant for each situation.
When spectrally very different sounds are encountered, new spectrum weightings may be desirable. The optimum spectrum weightings for particular sounds must be those that best predict annoyance responses to transmitted sounds.
1. Introduction
As a part of efforts to create a new ISO sound insulation rating standard (expected to be referred to as ISO 16717-1), new spectrum weightings have been proposed and included in draft documents associated with the proposed new standard. These spectrum weightings are intended to make possible more accurate predictions of disturbance due to various particular types of unwanted sounds transmitted through building elements from neighbouring spaces. This new study has tested these spectrum weightings using data from a previous study that evaluated ratings of the annoyance due to speech and music sounds transmitted through 20 simulated walls with a wide range of transmission characteristics [1, 2].
It is first important to describe why spectrum adaptation terms are necessary and what they are intended to do. This leads directly to how we should derive spectrum weightings for use in the new ISO standard. For many years the Weighted Sound Reduction Index, Rw, has been used as a single number rating of the acceptability of the sound insulation provided by a particular building element. As will be seen later in this report (Table 10), Rwis a moderately good predictor of annoyance ratings of transmitted sounds. However, some time in the past it was decided that Rw was not good enough, and that better single number ratings of sound insulation were needed. This led to the introduction of spectrum adaptation terms intended to produce ‘better’ sound insulation rating measures.
It should be clear that ‘better’ means that the new sound insulation rating measures should be better or more accurate indicators of the acceptability of the sound insulation. ‘Acceptability’ means, that people hearing transmitted sounds, will find them less disturbing, bothering or annoying. It is therefore a question of how acceptable the sound insulation is to people. New spectrum weightings must be derived from tests in which people rate sounds representative of the sounds transmitted through various building elements, including a wide range of transmission characteristics, as has been done in this report.
Estimating spectrum weightings from sound source characteristics and other good intentions are of little value until we know how accurately they predict subjective ratings. If they are no more accurate than the original Rwmeasure, there is no point using them. This is unfortunately true for a number of the spectrum weightings tested in this report. In the past, there has been too much arbitrary determination of, and tweaking of, spectrum weightings. We now need a more credible scientific approach.
2 / ) ( 2 1 0 1 e A A A y x x dx
2. Procedure
2.1 Data analysesThe new analyses were carried out by calculating new single number ratings of airborne sound transmission derived from the various spectrum weightings and procedures proposed for the new ISO standard. The previously obtained average annoyance ratings of transmitted speech and music sounds transmitted through the 20 walls were then plotted versus values of each new airborne sound insulation rating measure. Sigmoidal regression lines in the form of Boltzmann equations were fitted to these plots and the related R2 values determined. By exactly repeating the previous analysis procedure, comparisons can be made with the many previous results [1, 2].
The Boltzmann equation is given by the following,
(1) where,
y is the predicted annoyance for a particular x-value corresponding to one of the sound insulation rating measures
A1 is the y-value for x = - (1 for annoyance test) A2is the y-value for x = + (7 for annoyance test)
x0is the x-value of mean y-value, that is the x-value when y = 4 for the annoyance test
dx is related to the slope of the mid-part of the regression line
2.2 Previous listening tests
The experimental procedure of the previous work is described in [1], but will be summarised here for convenience. The simulated walls were based on the measured sound transmission characteristics of 20 real walls with Rw values from 33 to 56 (STC values from 34 to 58) and thus included a wide range of real walls. Table 1 lists the details of the 20 different walls used to simulate a wide range of transmitted sounds. Table 2 explains symbols used to describe the constructions of the 20 measured walls that were used.
All of the results presented in this report were statistically significant. Since there were always 20 data points and the same format of regression equation, the significance is simply related to the R2 value (i.e. the coefficient of determination). Any R2 value 0.193 is statistically significant at p<0.05 and an R2value 0.317 at p<0.01.
To give a more quantitatively useful indication of the accuracy of each measure, the standard deviations of the data about each regression line were calculated in terms of the x-coordinate that is the sound insulation rating measures. These standard errors of
the estimates, S.E., give an indication of the accuracy in decibels of each measure. These S.E. values should be examined to understand how much more or less accurate a particular sound insulation rating measure is by comparing them with the S.E. values for the basic Rwmeasure (see Table A1).
No. Descriptor STC rating Rw rating 1 G13_GFB90_WS89_G13 34 37 2 G13_SS65_G13 34 33 3 G16_SS65_G16 35 37 4 G16_SS90_G16 36 37 5 G16_SS90_G16 37 36 6 G13_GFB90_SS90_G13 39 41 7 G16_SS40_AIR10_SS40_G16 39 38 8 G13_GFB90_SS90_G13 40 42 9 G13_GFB65_SS65_G13 43 43 10 BLK90 44 44 11 G16_MFB40_SS90_G16 45 45 12 BLK140 47 47 13 G16_GFB90_SS90_G16 47 45 14 BLK190_PAI 48 48 15 G16_BLK190_G16 49 50 16 BLK190 50 50 17 G16_GFB90_SS90_2G16 52 50 18 2G13_GFB90_SS90_2G13 53 52 19 PAI_BLK140_WFUR40_GFB38_G13 56 55 20 PAI_BLK140_GFB38_WFUR40_G13 58 56
Table 1. Wall constructions from which the 20 sets of sound transmission loss (sound reduction index) values were obtained and their STC and Rwratings.
The descriptor codes are explained in Table 2. For example, wall number 17, which is described as, G16_GFB90_SS90_2G16, indicates the various layers of the construction in order from one side to the other. In this case the construction includes: 16 mm gypsum board (G16), 90 mm glass fibre batts (GFB90), 90 mm steel studs (SS90), and then 2 layers of 16 mm gypsum board (2G16).
Descriptor Explanation Descriptor Explanation
AIR Air space PAI Paint
BLK Concrete block SS Steel stud
G Gypsum board WFUR Wood furring
GFB Glass fibre batt WS Wood stud
MFB Mineral fibre batt
Subjects listened to speech and music sounds modified by the measured transmission characteristics of the 20 different walls presented to them from a loudspeaker system located 2 m in front of them. Throughout the test they also heard a constant 35 dBA background noise from a loudspeaker system directly above them intended to simulate ventilation type noise and to provide identical conditions for all tests. This set up was located in a sound isolated and acoustically dead test room and is illustrated in Figure 1. Without test sounds the background noise level in the room was 12 dBA.
Listener
Ambient noise
loudspeakers
Ceiling
Curtain
Transmitted speech and music loudspeakers
Foam
Figure 1. Schematic of cross-section through the Room Acoustics Test Space showing the location of the listener and the loudspeakers used to generate the test sound fields.
In each test, subjects listened to 3 different phonetically balanced English sentences [3] played through each of the 20 different walls as well as 3 different music samples played though each of the walls and all in a randomized order. In total they heard 60 ‘transmitted’ sentences and 60 ‘transmitted music samples. Subjects rated the annoyance of each sound on a 7-point scale from 1: Not at all annoying, to 7: Extremely annoying, and were asked to imagine they were at home trying to relax. Results were averaged over subjects and over either the 3 different speech sounds or the 3 different music sounds. The effective source levels and simulated ambient noise levels were constant and hence subjects only heard changes in sounds due to changes in the transmission characteristics applied to them. Thus the ratings of the sounds can be compared with the airborne sound transmission ratings of the sounds ‘transmitted’ through each of the 20 different walls.
The average effective source spectra of the speech and music sounds are given in Figure 2. The average music spectrum has high levels at all frequencies with the highest levels in the 63 Hz 1/3-octave band. The male voice speech spectrum has a more limited bandwidth with decreasing energy below 100 Hz and above 1250 Hz. Such tests can provide accurate relative ratings of the test sounds. They are particularly suitable for determining which sound insulation measure best predicts subjective ratings acquired during the controlled conditions of a test. They do not provide absolute results and cannot be used to determine what level of transmitted sound is too much for some
particular situation. For example, determining criteria for acceptable levels of sound insulation between neighbours or from outdoors would require field tests in situ so that all aspects of the situation are correctly included.
Figure 2. Average effective source spectra of the music and speech sounds.
63 125 250 500 1000 2000 4000 40 50 60 70 80 SPL, dB Frequency, Hz Music Speech
3. Evaluations of proposed spectrum weightings
This work was carried out before a final version of the proposed ISO standard was produced so that these results could be of use to the working group creating the standard. It includes proposed spectrum weightings included in a draft document for the proposed new standard [4]. The new analyses also include other spectrum ratings from: previous versions of ISO 717-1, other proposed new spectrum weightings provided by Scholl and by Seidel, a new optimized spectrum weighting for speech sounds and spectrum weightings based on the revised equal loudness contours (ISO 226 (2003)). The evaluation results are presented in the following 6 subsections.
Because a final version of the new standard was not available to the author, the merits of the weighting spectra were determined by including them in the manner described in an earlier version of ISO 717-1 (1996) for spectrum adaptation terms. For example, when the C spectrum adaptation term was applied, the combined sound insulation measure was referred to as Rw+C. This terminology is continued in this report. For example, when the Lliving weighting spectrum is applied, the combined sound insulation rating measure is referred to as Rw+Lliving. The calculation of the measures resulting from the various spectrum weightings from the previous ISO 717-1 (1996) standard is described in equation (2) below.
+
= −10 log ∑ 10
( )/ (2)Where: Rw= weighted sound reduction index
Cj= Spectrum adaptation term j
Lij = 1/3-octave band spectrum weightings
Ri= 1/3-octave band sound reduction index
j = spectrum number i = 1/
3-octave band index
All 14 spectra that were evaluated are described in Appendix A and their spectrum weighting values are listed in Table A1.
3.1 Evaluation of measures included in the initial draft of the proposed ISO standard
Four different spectrum weightings for calculating the airborne sound insulation ratings of building elements were included in the early draft of the proposed ISO standard. These spectrum weightings are the first 4 spectra in Table A1. They are shown in Figure 3, and are described below.
Spectrum Lliving: is intended for situations in which general living sounds predominate.
spectrum was included in the ISO 717-1 (1996) standard and was referred to as C (50-5000). This spectrum is the same shape as the A-weighting spectrum with some very minor adjustments in the higher frequencies to give it constant values from 1250 to 5000 Hz. Thus, applying this spectrum weighting to sounds with an approximately pink source spectrum is approximately the same as calculating the A-weighted transmitted sound level by energy summation of the A-weighted band levels. Alternatively it is equivalent to an A-weighted sound transmission loss (or sound reduction index) value, independent of source spectrum.
Spectrum Ltraffic: is intended for use where the building element is exposed to outdoor
road traffic noise. Exactly the same spectrum was included in the ISO 717-1 (1996) standard and was referred to as Ctr(50-5000).
Spectrum Lspeech: is intended for situations where speech sounds are a major source of
annoyance. It was included in the initial draft of the ISO standard but has not been used previously, and is an arbitrarily modified version of a measure intended for predicting the intelligibility of speech rather than annoyance.
Spectrum Lliving,85%: is a new proposed spectrum included in the draft of the new
standard. It is said to be the 85th percentile values of a range of possible spectra between a minimum and a maximum spectrum described in the draft standard. When compared with the other spectra above, it has a spectrum shape similar to that of the Llivingspectrum as seen in Figure 3.
Figure 3. Comparison of the 4 spectrum weightings included in the document n090a-Scholl-ISO 16717-1. Table A1 includes the values of the spectrum weightings.
63 125 250 500 1000 2000 4000 -40 -30 -20 -10 Level, dB Frequency, Hz Lliving Ltraffic Lspeech Lliving,85%
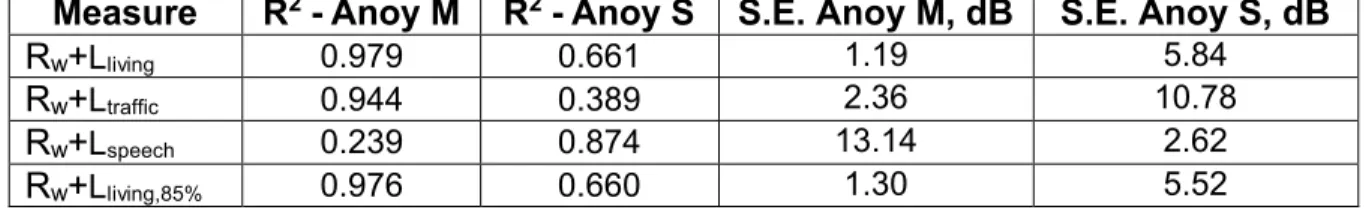
Figures 4-7 show plots of average annoyance ratings of music sounds (Anoy M) and annoyance ratings of speech sounds (Anoy S) versus values of sound insulation ratings based on one of the above 4 spectrum weightings. Figure 4 shows that the Rw+Lliving measure predicts annoyance due to music sounds (Anoy M, R2=0.979, S.E.=1.19 dB) better than it predicts annoyance due to speech sounds (Anoy S, R2=0.661, S.E.=5.84 dB). A quick inspection of the graph shows that the annoyance due to speech sound (Anoy S) results are more scattered than those for the annoyance due to music (Anoy M) sound results. This agrees with previous results [1] and is because this spectrum is intended for rating disturbance due to sounds with a strong broad source spectrum, including a reasonably strong emphasis on the lower frequency sounds. As a result this measure predicts annoyance ratings of the music sounds much better than the annoyance ratings of the speech sounds. Clearly the Rw+Lliving measure predicts Anoy M ratings better than found for the basic Rwvalues (R2=0.798, S.E.=2.92 dB, see Table A1) and hence is a successfully better measure for predicting the annoyance due to this type of sound.
The results for the Rw+Lliving,85%measure in Figure 7 are very similar to those in Figure 4 because the Lliving,85% spectrum and the Lliving spectrum have very similar shapes (see Figure 3). For rating sounds with strong broad (i.e. approximately pink) spectra, similar to the music sounds of the original listening tests, the Lliving spectrum is slightly more successful. The Rw+Ltraffic measure in Figure 5 is a less successful predictor of annoyance due to music sounds than the Rw+Lliving and the Rw+Lliving,85% measures. The Ltraffic spectrum has a stronger emphasis on low frequency sounds than the Rw+Lliving and the Rw+Lliving,85% measures (see Figure 3). The Ltraffic spectrum is less suitable for rating annoyance due to music sounds because it has a greater emphasis on the low frequency components and less emphasis on the higher frequency components. However, one cannot be completely sure which spectrum weighting would be best for predicting annoyance due to other general “living” sounds. The answer would probably depend on the spectral characteristics of the various general living sounds and would require listening tests in which subjects specifically rated the annoyance of particular types of sounds as transmitted through the 20 different walls.
Measure R2- Anoy M R2- Anoy S S.E. Anoy M, dB S.E. Anoy S, dB
Rw+Lliving 0.979 0.661 1.19 5.84
Rw+Ltraffic 0.944 0.389 2.36 10.78
Rw+Lspeech 0.239 0.874 13.14 2.62
Rw+Lliving,85% 0.976 0.660 1.30 5.52
Table 3. Summary of R2 and S.E. values from the regression fits to the data in each of the
following plots of annoyance ratings versus each sound insulation rating measure. (Anoy M is the annoyance ratings of music sounds and Anoy S is the annoyance ratings of speech sounds).
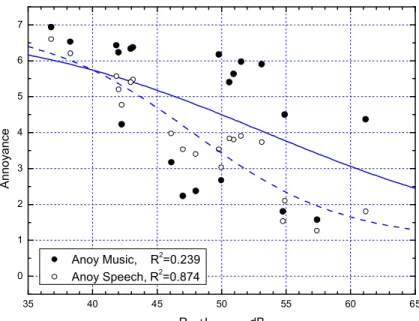
Of the 4 measures evaluated in Figures 4-7, only the Rw+Lspeech measure was reasonably successful at predicting annoyance ratings of the speech sounds. However, the R2value for the prediction of annoyance due to speech sounds using the R
w+Lspeech measure was not as high as for the best predictions of annoyance due to music sounds in these graphs and in Table 3. Section 3.4 presents the results of evaluations of a more optimized measure for predicting annoyance ratings of speech sounds. Similarly, the standard error, S.E. of the best prediction of annoyance due to music sounds (Rw+Lliving, S.E.=1.19 dB) is much smaller than the S.E. of the best prediction of annoyance due to speech sounds (Rw+Lspeech, S.E.=2.62 dB) in Table 3.
Figure 4. Annoyance ratings of speech and music sounds plotted versus Rw+Lliving. Also included
are the Boltzmann equation regression lines and associated R2values for each type of rating.
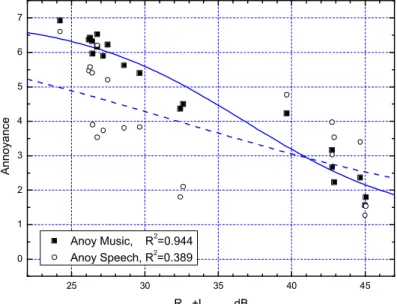
Figure 5. Annoyance ratings of speech and music sounds plotted versus Rw+Ltraffic. Also
included are the Boltzmann equation regression lines and associated R2values for each type of
30 35 40 45 50 55 60 0 1 2 3 4 5 6 7 Annoyance Rw +Lliving, dB Anoy Music, R2=0.979 Anoy Speech, R2=0.661 25 30 35 40 45 0 1 2 3 4 5 6 7 Annoyance Rw +Ltraffic, dB Anoy Music, R2=0.944 Anoy Speech, R2=0.389
Figure 6. Annoyance ratings of speech and music sounds plotted versus Rw+Lspeech. Also
included are the Boltzmann equation regression lines and associated R2values for each type of
rating.
Figure 7. Annoyance ratings of speech and music sounds plotted versus Rw+Lliving,85%. Also
included are the Boltzmann equation regression lines and associated R2values for each type of
rating. 35 40 45 50 55 60 65 0 1 2 3 4 5 6 7 Annoyance Rw +Lspeech, dB Anoy Music, R2=0.239 Anoy Speech, R2=0.874 20 25 30 35 40 45 50 0 1 2 3 4 5 6 7 Annoyance Rw +Lliving,85%, dB Anoy Music, R2 =0.976 Anoy Speech, R2=0.660
3.2 Weighting spectra in previous versions of ISO 717
The spectrum weightings C(100-3150) and Ctr(100-3150) are essentially older versions of two of the spectra included in the previous section (i.e. Lliving and Ltraffic) but with a more limited range of frequencies.
Spectrum C(100-3150): was included in the ISO 717-1(1996) standard and is similar to the
Lliving spectrum except that it only has values from 100 Hz to 3150 Hz and the
magnitude of the values are 1 dB higher than those in the Lliving spectrum due to a slightly different normalization.
Spectrum Ctr(100-3150): is similarly a limited frequency range version of the Ltraffic
spectrum. The two spectra have identical values over the frequency range 100 to 3150 Hz.
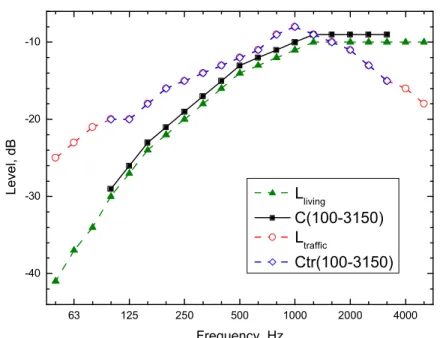
The C(100-3150) and Ctr(100-3150)spectrum weightings are compared with the Llivingand Ltraffic weightings in Figure 8. All frequency weighting spectrum values are included in Table A1.
Figure 8. Comparison of the C(100-3150)and the Ctr(100-3150) spectrum weightings with the Lliving and
Ltrafficweightings. The details of all frequency weighting spectra are included in Table A1.
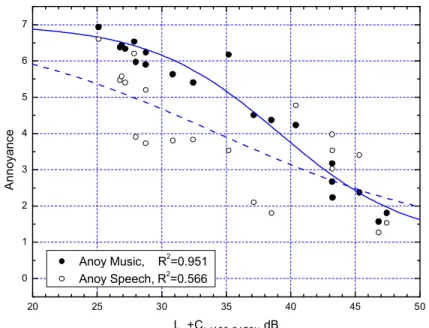
The R2 values from the regression fits to the data in Figures 9 and 10 are compared with the previous results in Table 4. The Rw+Lliving measure is seen to be a better predictor of annoyance ratings of transmitted music sounds than the Rw+C(100-3150) measure. This indicates that including the lower and higher frequency components (i.e. using Rw+Lliving) more accurately predicts the annoyance due to the music sounds. For example, the S.E. of annoyance due to music sounds using the Rw+C(100-3150) is more
63 125 250 500 1000 2000 4000 -40 -30 -20 -10 Level, dB Frequency, Hz Lliving C(100-3150) Ltraffic Ctr(100-3150)
components to the Rw+Ctr(100-3150) measure makes it a little less successful because the stronger very low frequency components are not representative of the music test sounds. Presumably the low frequency components would be important for a more accurate prediction of annoyance due to noises such as road traffic noise with predominant low frequency components.
None of the measures included in the summary of Table 4 were very successful predictors of annoyance due to speech sounds.
Measure Anoy M Anoy S S.E. Anoy M, dB S.E. Anoy S, dB
Rw+Lliving 0.979 0.661 1.19 5.84
Rw+C(100-3150) 0.917 0.744 2.42 4.53
Rw+Ltraffic 0.944 0.389 2.36 10.78
Rw+Ctr(100-3150) 0.951 0.566 2.17 7.41
Table 4. Summary of R2and S.E. values from the regression fits to the data in Figures 7 and 8
showing plots of annoyance ratings versus each sound insulation rating measure (Rw+C(100-3150)
and Rw+Ctr(100-3150)) that can be compared with the plots in the previous section for Rw+Lliving and
Rw+Ltraffic. (Anoy M is annoyance ratings of music sounds and Anoy S is annoyance ratings of
Figure 9. Annoyance ratings of speech and music sounds plotted versus Rw+C(100-3150). Also
included are the Boltzmann equation regression lines and associated R2values for each type of
rating.
Figure 10. Annoyance ratings of speech and music sounds plotted versus Rw+Ctr(100-3150). Also
included are the Boltzmann equation regression lines and associated R2values for each type of
rating. 30 35 40 45 50 55 60 0 1 2 3 4 5 6 7 Annoyance Rw+C(100-3150), dB Anoy Music, R2 =0.917 Anoy Speech, R2=0.744 20 25 30 35 40 45 50 0 1 2 3 4 5 6 7 Annoyance Lw+Ctr(100-3150), dB Anoy Music, R2 =0.951 Anoy Speech, R2 =0.566
3.3 Spectrum weightings derived from measured source spectra
This section presents the evaluations of 5 other proposed spectrum weightings.
Spectrum TGM: This spectrum was based on a new study by the Department of
Acoustics and Building Physics of the Federal Institute of Technology, TGM, in Vienna, an institution founded in 1879 under the name "Technologisches GewerbeMuseum". The spectrum is said to represent contemporary (2012) living noises. It has a similar shape to the Lliving,85% spectrum but with lower values at 1600 Hz and higher.
Spectrum Road: A spectrum provided by Seidel [5] for situations where the
predominant noise source is road traffic noise. It has spectrum values for all 1/
3-octave bands from 50 to 5000 Hz inclusive.
Spectrum Railway: A spectrum provided by Seidel [5] for situations where the
predominant noise source is railway noise. It has spectrum values for all 1/3-octave bands from 50 to 5000 Hz inclusive.
Spectrum Aircraft: a spectrum provided by Seidel [5] for situations where the
predominant noise source is aircraft noise. It has spectrum values for all 1/3-octave bands from 50 to 5000 Hz inclusive.
Spectrum Plus: Seidel proposed a weighting spectrum originally referred to as “R+”
(Figure 8 in [6]). In this report it is named “Plus”. This spectrum was derived from a preliminary study of living noise spectra which included measurements of many types of noise sources found in modern homes as well as consideration of the revised equal loudness contours (ISO 226 (2003)). It includes values from 50 to 5000 Hz.
The five spectrum weightings are compared in Figure 11 below and the details of the spectrum values are given in Table A1. All four spectra are seen to be somewhat similar in shape, with the Plus spectrum having much lower values at 50 Hz.
The R2and S.E. values from the regression fits to these measures in Figures 12 -16 are summarised in Table 5 below for ratings of both music and speech sounds. For annoyance due to music sounds the R2 values are quite high but are no better than those for existing measures such as for predictions using the Rw+Lliving measures.
Figure 12 shows, that using the Rw+TGM measure led to R2values almost the same as for the Rw+Lliving and Rw+Lliving,85% measures as also shown in the summary of Table 5 below.
Although 4 of the 5 results show relatively low prediction accuracy for ratings of annoyance due to speech sounds, the Rw+Railway weighting is quite successful for predicting annoyance due to speech sounds. This may be due to the lower values of
this spectrum from 50 to 160 Hz and the higher values around 2500 Hz. These would tend to make it more suitable for speech. It is not known what type of railway noise this spectrum is intended to represent.
Figure 11. Comparison of the five other proposed spectrum weightings.
Measure Anoy M Anoy S S.E. Anoy M, dB S.E. Anoy S, dB
Rw+TGM 0.974 0.682 1.31 5.44
Rw+Road 0.969 0.697 1.34 4.93
Rw+Railway 0.744 0.920 3.20 1.95
Rw+Aircraft 0.949 0.732 1.58 4.42
Rw+Plus 0.827 0.854 2.58 3.18
Table 5. Summary of R2values and S.E. of derived from the regression fits to the data in each
of the following plots of annoyance ratings versus each sound insulation rating measure. (Anoy M is annoyance ratings of music sounds and Anoy S is annoyance ratings of speech sounds).
63 125 250 500 1000 2000 4000 -60 -50 -40 -30 -20 -10 0 Level, dB Frequency, Hz TGM Road Railway Aircraft Plus
Figure 12. Annoyance ratings of speech and music sounds plotted versus ratings using the TGM weighting. Also included are the Boltzmann equation regression lines and associated R2
values for each type of rating.
Figure 13. Annoyance ratings of speech and music sounds plotted versus ratings using the Road weighting. Also included are the Boltzmann equation regression lines and associated R2
values for each type of rating.
20 25 30 35 40 45 50 0 1 2 3 4 5 6 7 Annoyance Rw +TGM, dB Anoy Music, R2=0.974 Anoy Speech, R2=0.682 25 30 35 40 45 50 55 0 1 2 3 4 5 6 7 Annoyance Rw +Road, dB Anoy Music, R2=0.969 Anoy Speech, R2=0.697
Figure 14. Annoyance ratings of speech and music sounds plotted versus ratings using the Railway weighting. Also included are the Boltzmann equation regression lines and associated R2values for each type of rating.
Figure 15. Annoyance ratings of speech and music sounds plotted versus ratings using the Aircraft weighting. Also included are the Boltzmann equation regression lines and associated R2
values for each type of rating.
30 35 40 45 50 55 60 0 1 2 3 4 5 6 7 Annoyance Rw +Railway, dB Anoy Music, R2=0.744 Anoy Speech, R2=0.920 25 30 35 40 45 50 55 0 1 2 3 4 5 6 7 Annoyance Rw +Aircraft, dB Anoy Music, R2=0.949 Anoy Speech, R2=0.732
Figure 16. Annoyance ratings of speech and music sounds plotted versus ratings using the Plus weighting. Also included are the Boltzmann equation regression lines and associated R2
values for each type of rating.
30 35 40 45 50 55 0 1 2 3 4 5 6 7 Annoyance Rw+Plus, dB Anoy Music, R2=0.827 Anoy Speech, R2=0.854
3.4 Optimum spectrum weighting for speech sounds
Evaluations of the Rw+Lspeech measure in section 3.1 showed that it was only a moderately successful predictor of annoyance ratings of transmitted speech sounds. Apparently Lspeech is an arbitrarily modified version of a spectrum weighting previously found successful for predicting speech intelligibility scores [7]. This is quite a different issue than the less specific needs of the proposed standard which will attempt to rate the general acceptability of the sound insulation of building elements. There are standards that focus on speech privacy for use where this is the specific need [8]. In this section a more optimized speech weighting spectrum is evaluated. This spectrum was derived as part of the current evaluation study. Various spectrum weightings for speech were considered based on the previous work on rating annoyance due to these same transmitted speech sounds [1, 2]. After setting a flat response over frequencies important for speech sounds from 400 Hz to 3150 Hz, the attenuation of the spectrum weightings at lower and higher frequencies was adjusted to maximize the resulting R2 values when annoyance due to speech sounds was related to the calculated Rw+OptSpeech ratings.
The new OptSpeech weighting and the Lspeech weighting are compared in Figure 17. The spectrum weighting values of these spectra are given in Table A1.
Figure 17. Comparison of the OptSpeech and the Lspeechspectrum weightings.
Figure 18 shows the result of plotting annoyance ratings versus values of the Rw+OptSpeech measure. Although the measure does not predict ratings of annoyance due to music sounds well, it is an excellent predictor of the ratings of annoyance due to speech sounds with an associated R2 value of 0.977. This is a considerably more
63 125 250 500 1000 2000 4000 -50 -40 -30 -20 -10 0 Level, dB Frequency, Hz OptSpeech Lspeech
Rw+Lspeech(R2=0.874, S.E.=2.62) measure and the Rw+OptSpeech measure (R2=0.977, S.E.=0.99) should be included in the ISO 16717-1 standard for rating building elements for situations where speech sounds are an important source of disturbance.
Figure 18. Annoyance ratings of speech and music sounds plotted versus Rw+OptSpeech
ratings. Also included are the Boltzmann equation regression lines and associated R2values for
each type of rating.
20 25 30 35 40 45 50 0 1 2 3 4 5 6 7 Annoyance Rw +OptSpeech, dB Anoy Music, R2=0.565 Anoy Speech, R2=0.977
3.5 Spectrum weightings derived from revised equal loudness contours
A-weighted measures have frequently been used to predict annoyance due to various sounds and the Lliving spectrum weighting is a close approximation to the standard A-weighting contour. It is well known that the A-A-weighting contour was derived, many years ago, as an approximation to the 40 phon equal loudness contour. However, the equal loudness contours have recently been revised as a result of a consensus of modern determinations of equal loudness contours. A proposal from the French mirror group to the proposed new ISO standard [9] has suggested frequency weightings based on the new equal loudness contours (ISO 226 (2003)). The measures Rw+L30phon and Rw+L40phon are based on the 30 and 40 phon contours of the ISO 226 (2003) equal loudness contours and have been evaluated in the same manner as the other proposed spectrum weightings.
The R2and S.E. values from the regression fits to these measures in Figures 19 and 20 are summarised in Table 6 below for ratings of both music and speech sounds. The table also lists R2 and S.E. values for the regression fits to Rw+Lliving and Rw measures for comparison. The R2values for Rw+L30phon and Rw+L40phon measures are intermediate to those for Rw+Llivingand Rw, but do not have very high values. The R2and S.E. values indicate that annoyance responses to music sounds are predicted a little more accurately by the Rw+L30phon and Rw+L40phon measures than by Rw values. However, Rw+Lliving is a much more accurate predictor of annoyance due to music sounds than these new measures. For annoyance due to speech sounds, Rw is a slightly more accurate predictor than the new measures. These results do not indicate any reason for using these new measures based on the revised equal loudness contours.
Measure R2: Anoy M R2: Anoy S S.E. Anoy M, dB S.E. Anoy S, dB
Rw+Lliving 0.979 0.661 1.19 5.84
Rw+L30phon 0.819 0.881 2.68 2.78
Rw+L40phon 0.844 0.853 2.49 3.23
Rw 0.798 0.890 2.91 2.72
Table 6. R2and S.E. values associated with sigmoidal regression fits to plots of Anoy M and
Anoy S versus the Rw+Ll30phon and Rw+L40phonmeasures compared with results for Rw+Llivingand
Figure 19. Annoyance ratings of speech and music sounds plotted versus Rw+L30phon ratings.
Also included are the Boltzmann equation regression lines and associated R2 values for each
type of rating
Figure 20. Annoyance ratings of speech and music sounds plotted versus Rw+L40phon ratings.
Also included are the Boltzmann equation regression lines and associated R2 values for each
type of rating 30 35 40 45 50 55 60 65 0 1 2 3 4 5 6 7 Annoyance Rw +L30phon, dB Anoy Music, R2=0.819 Anoy Speech, R2=0.881 30 35 40 45 50 55 60 65 0 1 2 3 4 5 6 7 Annoyance Rw +L40phon, dB Anoy Music, R2=0.844 Anoy Speech, R2=0.853
3.6 Importance of very low frequency bands
It has been argued that spectrum weightings such as the Lliving spectrum unfairly penalize certain types of construction. For example, walls with gypsum board panels on both sides of some type of studs tend to have low sound reduction index values at very low frequencies, whereas concrete and masonry walls usually have higher sound insulation at very low frequencies. It has also been pointed out [10] that very low frequency sound insulation values cannot be measured very accurately, which would make it more difficult to predict the success of very low frequency sound insulation. In this report the results in section 3.2 showed that including the 50 to 80 Hz bands in the Rw+Lliving measure led to more accurate predictions of annoyance due to music sounds. That is, including all three low frequency bands improved the accuracy of the Rw+Lliving measure.
To better understand the importance of the very low frequency bands, further analyses were carried out in which each of these bands was successively removed from the sound insulation rating measure. The analyses started with the complete Rw+Lliving measure and then first removed the 50 Hz band data from the calculations. Next the 50 and the 63 Hz bands were removed and then the 50, 63 and 80 Hz bands were removed. Annoyance ratings were then plotted versus these modified sound insulation measures to determine how accurately they predicted the annoyance ratings. The results are summarized in Table 7 in terms of the associated R2and S.E. values.
Measure R2: Anoy M R2: Anoy S S.E. Anoy M, dB S.E. Anoy S, dB
Rw+Lliving(50-5000) 0.979 0.661 1.19 5.84
Rw+Lliving(63-5000) 0.978 0.664 1.22 5.79
Rw+Lliving(80-5000) 0.956 0.708 1.63 5.34
Rw+Lliving(100-5000) 0.920 0.742 2.10 5.04
Table 7. R2and S.E. values associated with sigmoidal regression fits to plots of Anoy M and
Anoy S versus the modified Rw+Llivingmeasures with low frequency bands systematically
removed.
The complete Rw+Lliving measure was a particularly good predictor of Anoy M ratings of transmitted music sounds. As the very low frequency bands were incrementally removed from the measure, the R2 values decreased and the S.E. values increased showing increasingly less accurate results. However, when only the 50 Hz band was removed, the changes were extremely small and are not of much practical importance. For example, the S.E. increased by only 0.03 dB for the Anoy M results, when the 50 Hz band was removed. These results indicate that eliminating the 50 Hz band data from the Rw+Lliving measure would have very little effect on the accuracy of the results. Removing the 50 Hz band from the sound insulation, measure is supported by Hongisto’s results [10] that show the measurement errors are much larger in the 50 Hz band than in other
4. Rating building elements for multiple types of sounds
This section discusses how best to set criteria for situations with multiple types of sounds. While ratings can be devised for particular spectrally different sounds, compromise weighting spectra are not a successful approach for cases with more than one type of sound source. Multiple criteria are a much better approach.
Previous studies [1,2] showed that ratings of speech and music sounds were different due to the large spectral differences between the two types of sounds. As a result, successful measures for predicting the annoyance due to each type of sound have to reflect the importance of frequencies that are more disturbing components of each type of sound after transmission through a range of typical wall constructions. Thus, measures for predicting the annoyance due to transmitted speech sounds tended to emphasize the importance of mid- and higher-frequency sounds that are important components of the annoyance caused by transmitted speech sounds. On the other hand good predictors of annoyance due to transmitted music sounds tended to also emphasize the more disturbing low frequency components. One can imagine a number of spectrum weightings for spectrally very different sounds.
However, we don’t need individual measures for rating the annoyance due to all of the large number of possible types of transmitted sounds. We probably only need to accommodate major spectral differences in types of sounds. As a minimum, we should try to accommodate the differences among three types of spectrally different sounds. These should include broad spectrum sounds, approximating a pink noise source spectrum and with strong sound energy over a broad range of frequencies such as the music sounds in these results. A second type would be those sounds for which the spectrum consists of predominant strong low frequency sounds such as road traffic noise. The third type of sounds would be speech sounds because they are a very common and distracting source of disturbance. For speech sounds we need a rating that emphasizes the importance of mid- and high-frequency components as they strongly influence the annoyance due to speech sounds. Two of the three are justified by the differences obtained between ratings of transmitted speech and music sounds in the previous studies [1,2]. The third spectrum, for road traffic noise, can only be inferred by statistical differences obtained when this spectrum was used for predicting annoyance due to music sounds (Section 3.1) and to the typical spectrum of road traffic noises.
It is very tempting to try to create compromise weighting spectra that try to average the requirements for more than one type of sound such as music and speech sounds, for example. This cannot succeed as it leads to less accurate predictions of the effects of both types of sounds. This would lead to less accurate predictions of the acceptability
of the sound insulation provided by various constructions and possibly to costly over-design of sound insulation due to the larger error bars on each prediction.
For example, enhancing the low frequency components of a spectrum weighting intended for use with speech sounds would introduce low frequency components that are not well correlated with the judgements of the annoyance due to transmitted speech sounds. The added low frequency components are essentially statistical noise which would lead to lower R2 values and less accurate results for speech sounds. Similarly adding strong higher frequency components to a spectrum intended for rating road traffic sounds adds information that is not well related to judgments of the annoyance due to transmitted road traffic sounds. Again the result would be reduced R2values and a less accurate prediction of annoyance ratings of the transmitted sounds. Thus compromise weighting spectra will always lead to less accurate predictions.
A better approach is to include separate ratings for each major type of spectrally very different sound and require different criteria in terms of each appropriate measure for a particular situation. For example, in many cases use of the Rw+Lliving measure would be appropriate for many types of common sounds in homes and use of a measure similar to Rw+OptSpeech would accurately predict the quality of sound insulation for speech sounds. Setting and meeting criteria in terms of both measures would ensure each building element is adequate for attenuating both types of sounds. This approach does not add any additional measurements, only a few additional calculations.
This concept was tested using the data from the 20 walls used to simulate conditions in the previous listening tests. To illustrate the procedure, sound insulation criteria were arbitrarily set to be below a particular mean annoyance rating. (Of course other methods could be used for setting criteria). Three different spectrum weightings were used to best estimate the annoyance due to the proposed 3 spectral types of sounds. These were the Lliving spectrum weighting, for broad spectrum sounds; the Ltraffic weighting for sounds with predominant low frequency components, and the OptSpeech weighting for speech sounds. Two criterion levels were set: mean annoyance equal to or less than 2.5 (least annoyance or most acceptable) and mean annoyance equal to or less than 3.0 (second lowest annoyance category).
Table 8 lists the details of the 20 walls with their Rwand STC ratings. In this table they are listed in order of their Rwratings. The three right hand columns list the values of the Rw+Lliving, Rw+Ltraffic, and Rw+OptSpeech measures. At the bottom of the table the values of these three measures corresponding to annoyance values of 2.5 and 3.0 are tabulated for both annoyance due to music sounds (Anoy M) and annoyance due to speech sounds (Anoy S). These were determined from the regression equations to the plots of annoyance versus each sound insulation measure. To make it easy to read the
pink and those a little less successful, but with annoyance values equal to or less than 3.0 are highlighted in green.
Table 8 shows that walls #15, #16 and #17 all have Rw values equal to 50. However, the three other sound insulation rating values show they do not have equal performance for the three types of sounds. Wall #15 has similar annoyance ratings for all 3 types of sounds, although not in the highest category. Wall #16 is in the highest category (lowest annoyance rating) for broad band and low frequency sounds but not for speech sounds. Wall #17 is not in either of the top two annoyance categories (lower annoyance) for broad band and low frequency sounds, but is in the top category (least annoyance) for speech sounds. That is it would be good for attenuating speech sounds but not sounds with more low frequency content.
Table 8. Calculated values of the Rw+ Lliving, Rw+Ltraffic, and Rw+OptSpeech ratings for the 20
walls used in the listening tests. The highlighted cells indicate whether the condition corresponds to the lowest annoyance category (less than or equal to 2.5 and shaded pink) or to the second lowest annoyance category (less than 3.0 but more than 3.5 and shaded green).
No. Descriptor STC Rw Lliv ing Ltraffic OptSpeech
2 G13_SS65_G13 34 33 31.4 24.2 23.5 5 G16_SS90_G16 37 36 34.4 26.8 26.2 1 G13_GFB90_WS89_G13 34 37 33.3 26.2 28.4 3 G16_SS65_G16 35 37 34.0 26.3 28.6 4 G16_SS90_G16 36 37 34.4 26.4 29.1 7 G16_SS40_AIR10_SS40_G16 39 38 35.6 27.5 28.9 6 G13_GFB90_SS90_G13 39 41 35.9 26.4 33.3 8 G13_GFB90_SS90_G13 40 42 36.8 27.2 34.4 9 G13_GFB65_SS65_G13 43 43 38.5 28.6 34.9 10 BLK90 44 44 44.0 39.7 31.8 11 G16_MFB40_SS90_G16 45 45 40.0 29.7 36.7 13 G16_GFB90_SS90_G16 47 45 39.0 26.8 36.1 12 BLK140 47 47 47.4 42.8 35.1 14 BLK190_PAI 48 48 47.7 42.9 36.2 15 G16_BLK190_G16 49 50 48.5 42.8 37.8 16 BLK190 50 50 49.4 44.7 37.5 17 G16_GFB90_SS90_2G16 52 50 43.9 32.6 41.2 18 2G13_GFB90_SS90_2G13 53 52 44.5 32.4 43.5 19 PAI_BLK140_WFUR40_GFB38_G13 56 55 53.3 45.1 43.3 20 PAI_BLK140_GFB38_WFUR40_G13 58 56 53.9 45.0 45.4 Anoy M = 3.0 47.5 41.0 41.2 Anoy S = 3.0 46.0 40.5 37.8 Anoy M = 2.5 49.2 43.1 43.2 Anoy S = 2.5 49.1 45.3 39.8
Table 8 illustrates how one could use the calculation of several sound insulation ratings to create a system for selecting building elements for different combinations of sounds. One would only apply criteria for types of sound that would be important in each situation. For example, if there is no road traffic noise then there is no need to meet a criterion for road traffic noise. For easy application, the table could be simplified by replacing the calculated values by one, two or three stars to indicate likely annoyance due to each type of sound for each building element.
Using multiple criteria with separate measures for each type of predominant sound would ensure that the selected criteria can be met more accurately than when using compromise weighting spectra.
5. Developing new spectrum weightings
In the previous section it was suggested that only a small number of spectrum weightings are needed for sounds with quite different spectral characteristics. In this report it is recommended that without more knowledge, only 3 weighting spectra can be justified. Of course, other sounds may be identified with spectral characteristics quite different to those considered here, and for which new spectrum weightings may be desirable. The question is how should one determine a suitable spectrum weighting for such sounds?
One approach would be to use a spectrum weighting that approximates the spectrum of the A-weighted sound for the particular source. In the current tests, the spectra of the sound sources (speech and music) are known and hence this concept of a weighting based on the A-weighted sound source spectrum could be tested.
Spectrum weightings were created from the measured average source spectra of the speech sounds and music sounds, both A-weighted and un-weighted. The results using these spectrum weightings were compared to those for the measures that provided the best predictions of annoyance ratings to the speech and the music sounds, in terms of the related R2values and are shown in Table 9.
Measure R2, Anoy M R2, Anoy S
Rw+Lliving 0.979 0.661 Rw+Music 0.768 -Rw+MusicAwt 0.885 -Rw+OptSpeech 0.565 0.977 Rw+Speech - 0.452 Rw+SpeechAwt - 0.788
Table 9. Summary of R2 values derived from the regression fits to the data of the annoyance
ratings versus each sound insulation rating measure. Anoy M is annoyance ratings of music sounds and Anoy S is annoyance ratings due to speech sounds. Results for Rw+Lliving and
Rw+OptSpeech are from Figures 4 and 18 respectively. Rw+Music included the music weighted spectrum weighting and Rw+MusicAwt included the A-weighted music spectrum weighting. Rw+Speech included the un-weighted speech spectrum weighting and Rw+SpeechAwt included the A-weighted spectrum weighting.
For both the speech and music results the spectrum weightings derived from the source signals did not provide very accurate predictions of annoyance ratings. This is because an ideal spectrum weighting must emphasize the frequency components according to how important they are to annoyance ratings rather than the actual spectrum of the sounds. Spectrum weightings are ‘band importance functions’ that should reflect the relative importance of each frequency band to the annoyance ratings of the transmitted sounds.
Therefore the best way to accurately determine importance functions is from data derived from a group of subjects in a controlled listening test. That is, one must optimize the frequency weightings by adjusting them to maximize the R2values from plots of the results of future listening tests.
6. Discussion and conclusions
The results of these analyses show that many of the proposed weighting spectra led to similarly accurate measures for predicting annoyance ratings of broad spectrum sounds such as the music samples in the original tests. These would include the following spectrum weightings: Lliving, Lliving,85%, Road, and TGM, which all predict annoyance ratings of music sounds very well but never quite as well as the Lliving spectrum weighting. These values are highlighted in Table 10, which summarises all of the calculated results. There is no benefit to having so many similarly accurate spectrum weightings. The Lliving spectrum weighting led to the most accurate predictions of annoyance due to music sounds and has the advantage of having been included in previous versions of the ISO 717 standard.
Measured R2: Anoy M R2: Anoy S S.E. Anoy M, dB S.E. Anoy S, dB
Rw+Lliving 0.979 0.661 1.19 5.84 Rw+Ltraffic 0.944 0.389 2.36 10.78 Rw+Lspeech 0.239 0.874 13.14 2.62 Rw+Lliving,85% 0.976 0.660 1.30 5.52 Rw+C(100-3150) 0.917 0.744 2.42 4.53 Rw+Ctr(100-3150) 0.951 0.566 2,17 7.41 Rw+TGM 0.974 0.682 1.31 5.44 Rw+Road 0.969 0.697 1.34 4.93 Rw+Railway 0.744 0.920 3.20 1.95 Rw+Aircraft 0.949 0.732 1.58 4.42 OptSpeech 0.565 0.977 4.65 0.99 Rw+Plus 0.827 0.854 2.58 3.18 Rw+L30phon 0.819 0.881 2.68 2.78 Rw+L40phon 0.844 0.853 2.49 3.23 Rw 0.799 0.891 2.91 2.72
Table 10. Summary of R2and S.E. values from regression fits to predict annoyance due to music sounds (Anoy M) and annoyance due to speech sounds (Anoy S). Highlighted values indicate very similar R2values for annoyance due to music sounds.
The Ltraffic spectrum weighting is probably the best of the available weightings for predicting annoyance responses to sounds with predominant low frequency content such as outdoor road traffic noise. As seen in Figure 21, the Ltraffic spectrum weighting has higher spectral values than the Lliving spectrum below about 250 Hz, and lower values than Lliving from 2500 Hz to higher frequencies. This spectrum shape makes it more suitable for sounds with predominant low frequency content. This, combined with
the lower R2 values when predicting annoyance due to music sounds than when using the Lliving spectrum, suggest that it may be considered a statistically different quantity than Lliving, and may be a potentially more accurate predictor of annoyance ratings of sounds with predominant low frequency content.
The OptSpeech spectrum weighting is a new speech spectrum weighting which is considerably more accurate than the Lspeech spectrum weighting, included in the initial draft of the standard, for the prediction of annoyance due to transmitted speech sounds. The OptSpeech spectrum weighting should be used for rating the disturbance (annoyance) caused by all types of transmitted speech sounds. The three recommended spectrum weightings are compared in Figure 21 and are seen to have distinctly different spectrum shapes.
Figure21. Comparison of the three recommended spectrum weightings.
Comparison of measures that include 50 to 5000 Hz spectrum weightings (Rw+Llivingand Rw+Ltraffic) with the same weightings limited to the 100 to 3150 Hz range (Rw+C(100-3150) and Rw+Ctr(100-3150)), indicated that the lower frequency components (50-80 Hz) are subjectively important and including them can lead to more accurate predictions of the annoyance due to some types of sounds such as the music sounds in these analyses. However, it was shown that the 50 Hz band could be removed from the Rw+Lliving measure without significantly reducing the prediction accuracy of annoyance ratings of music sounds. This result and the increased uncertainty of 50 Hz measured levels strongly suggests that 50 Hz values should be excluded from this sound insulation measure. 63 125 250 500 1000 2000 4000 -50 -40 -30 -20 -10 0 Level, dB Frequency, Hz Lliving Ltraffic OptSpeech
The proposed spectrum weightings L30phon and L40phon were only moderately successful predictors of annoyance due to the speech and music sounds. This is probably because although they are based on revised equal loudness contours, equal loudness contours are only intended for determining the loudness of single frequency sounds. The loudness of more complex sounds such as speech and music can be determined by loudness calculation methods such as that of Zwicker [11]. Such loudness calculations have previously been evaluated and found to successfully predict annoyance ratings of transmitted speech and music sounds [2]. However, they have the disadvantage of being more complicated to calculate.
It is concluded that with the current state of our knowledge it is only justifiable to use 3 spectrum weightings: Lliving, Ltraffic, and OptSpeech. It is not now possible to justify the use of other spectrum weightings.
The Lliving spectrum weighting should work well for rating the disturbance caused by transmitted sounds with broad source spectra such as many sounds in homes including the music sounds used in the previous listening tests.
The Ltraffic spectrum weighting should be used for sounds with predominant low frequency source components such as often occurs for road traffic noise.
The OptSpeech spectrum weighting should be used for rating annoyance due to speech sounds.
It is only necessary to have different spectrum weightings for sounds of significantly different spectra. When new sound sources with significantly different spectra are encountered, new spectrum weightings should be developed from the results of listening tests to determine the relative importance of each frequency band to annoyance ratings of the transmitted sounds.
Compromise spectrum weightings are not recommended because they lead to less accurate ratings of sound insulation. A much better and more accurate approach is to use multiple ratings and criteria that include those for the important types of sounds in each situation.
These conclusions are based on the best available information at the time of the analyses in this report. Further controlled listening tests with a wider range of types of sound source could be carried out to confirm and possibly extend these conclusions.
References
1. Park, H.K and Bradley, J.S., “Evaluating standard airborne sound insulation measures in terms of annoyance, loudness and audibility ratings”, J. Acoust. Soc. Am., 126, (1) 208-219, (2009).
2. Park, H.K. and Bradley, J.S., “Evaluating signal-to-noise ratios, loudness and related measures as indicators of airborne sound insulation”, J. Acoust. Soc. Am., 126, (3) 1219-1230 (2009).
3. “IEEE recommended practice for speech quality measurements,” IEEE Trans. Audio and Electroacoustics, 17, 227–246 (1969).
4. ISO 16717 committee document, n090a-Scholl-ISO 16717-1
5. ISO 16717 committee document, n094, ISO WD16717-1.20120706JoS
6. ISO 16717 committee document, n101, J. Seidel, SAR 12 074, “Derivation of a living noise reference spectrum to be proposed for ISO 16717-1”, (18 June, 2012).
7. Park, H. K., Bradley J.S. and Gover, B.N., “Evaluating Airborne Sound Insulation in Terms of Speech Intelligibility”, J. Acoust. Soc. Am. Vol. 123 (3) 1458-1471 (2008). 8. ASTM E2638-08, “Standard Method for Objective Measurement of the Speech Privacy
Provided by a Closed Room”, ASTM International (formerly American Society for Testing and Materials), West Conshohocken, PA, U.S.A.
9. ISO 16717 committee document, n113-French contribution to ISO16717-Foy
10. Hongisto V., Keränen, J., Kylliänen M. and Mahn, J., “Reproducibility of the present and the proposed single-number quantities of airborne sound insulation”, Acta Acustica 98, 811-819 (2012).
11. E. Zwicker, H. Fastl, and C. Dallmayr, “BASIC-Program for calculating the loudness of sounds from their 1/3-oct band spectra according to ISO 532 B,” Acustica 55, 63–67 (1984).
Appendix A. Details of spectrum weightings used to calculate sound
insulation ratings
This appendix provides the details of the 14 spectrum weightings that were evaluated in these studies. These were mostly spectra that, at the time of these evaluations, were being considered with respect to the proposed ISO 16717-1 standard. Table A1 lists the 1/3-octave band values of all 14 spectra along with the R2 values associated with the sigmoidal regression fits of annoyance due to speech sounds and annoyance due to music sound versus these calculated sound insulation ratings of the 20 different test walls. Also included in the last column of Table A1 are the corresponding R2 and S.E. values when the basic Rw measure was used to predict annoyance responses to speech and music sounds [1]. Generally, to be useful the new prediction measures must have smaller S.E. values than the approximately 3 dB for the Rwvalues.
From reference [5] Previous ISO 717-1 From reference [5] Ref [6] Reference [9] Ref [1] Number
→ 1 2 3 4 5 6 7 8 9 10 11 12 13 14
Frequency
Hz Lliving Ltraffic Lspeech Lliving,85% C(100- 3150) Ctr(100- 3150) TGM Road Railway Aircraft SpeechOpt- Plus L30phon L40phon Rw
50 -41 -25 -33.6 40.1 -45.2 -50.1 -47.1 -45 -59.1 -53.3 -49.4 63 -37 -23 -29.4 48.3 -37.2 -44.8 -37.9 -40 -46.0 -48.2 -44.7 80 -34 -21 -25.3 53.8 -33.0 -41.1 -31.3 -35 -39.1 -43.2 -40.1 100 -30 -20 -21.1 -29 -20 57.6 -29.6 -36.7 -26.3 -30 -32.5 -38.8 -36.0 125 -27 -20 -17.8 -26 -20 60.4 -25.9 -31.2 -23.5 -25 -27.1 -34.6 -32.2 160 -24 -18 -15.4 -23 -18 62.8 -22.9 -24.7 -20.8 -20 -23.3 -30.4 -28.3 200 -22 -16 -38 -12.9 -21 -16 65.0 -21.6 -22.2 -18.6 -15 -22.0 -26.8 -25.0 250 -20 -15 -28 -10.5 -19 -15 67.1 -18.8 -18.5 -14.4 -10 -19.1 -23.5 -22.0 315 -18 -14 -18 -8.5 -17 -14 69.3 -16.7 -15 -11.7 -5 -15.4 -20.4 -19.2 400 -16 -13 -10 -6.6 -15 -13 71.4 -14.8 -12.5 -9.5 0 -12.9 -17.5 -16.6 500 -14 -12 -10 -5.0 -13 -12 73.3 -12.6 -10.6 -8.7 0 -9.3 -15.4 -14.7 630 -13 -11 -10 -5.0 -12 -11 74.8 -10.8 -8.7 -8.5 0 -7.9 -13.5 -12.9 800 -12 -9 -10 -5.0 -11 -9 75.8 -8.7 -7.5 -8.2 0 -7.1 -12.1 -11.7 1000 -11 -8 -10 -5.0 -9 -8 76.1 -8.0 -9.8 -8.9 0 -9.0 -12.0 -11.6 1250 -10 -9 -10 -5.0 -9 -9 75.5 -10.3 -12.3 -11.8 0 -11.6 -13.6 -13.4 1600 -10 -10 -10 -5.0 -9 -10 74.1 -11.7 -14.7 -13.7 0 -12.9 -14.0 -14.1 2000 -10 -11 -10 -5.0 -9 -11 71.9 -10.0 -11.2 -13.1 0 -13.2 -10.8 -10.8 2500 -10 -13 -10 -5.5 -9 -13 69.0 -9.6 -10.1 -14.7 0 -12.6 -8.0 -8.1 3150 -10 -15 -13 -6.2 -9 -15 66.0 -10.9 -12 -19.2 0 -13.7 -7.0 -7.2 4000 -10 -16 -20 -7.0 63.2 -14.7 -14.5 -26.0 -8 -16.6 -8.0 -8.2 5000 -10 -18 -30 -7.7 61.4 -20.9 -19.4 -34.8 -16 -22.1 -11.4 -11.6 R2Anoy M 0.979 0.944 0.239 0.976 0.917 0.951 0.974 0.969 0.744 0.949 0.565 0.827 0.819 0.844 0.798* R2Anoy S 0.661 0.389 0.874 0.660 0.744 0.566 0.682 0.697 0.920 0.732 0.977 0.854 0.881 0.853 0.890* S.E. Anoy M 1.19 2.36 13.14 1.30 2.42 2.17 1.31 1.34 3.20 1.58 4.65 2.58 2.68 2.49 2.91 S.E. Anoy S 5.84 10.78 2.62 5.52 4.53 7.41 5.44 4.93 1.95 4.42 0.99 3.18 2.78 3.23 2.72