Assessment of Cirrus Cloud Optical and Microphysical Data Reliability by Applying
Statistical Procedures
VALERYSHCHERBAKOV*
Institute of Physics, Minsk, Belarus
JEAN-FRANÇOISGAYET AND OLIVIERJOURDAN
Laboratoire de Météorologie Physique, UMR/CNRS, Université Blaise Pascal, Clermont-Ferrand, France
ANDREASMINIKIN
Institut für Physik der Atmosphäre, DLR, Oberpfaffenhofen, Germany
JOHANSTRÖM
Institute of Applied Environmental Research, Stockholm University, Stockholm, Sweden
ANDREASPETZOLD
Institut für Physik der Atmosphäre, DLR, Oberpfaffenhofen, Germany
(Manuscript received 6 May 2004, in final form 15 September 2004) ABSTRACT
A methodology of employing statistical procedures, specifically the principal component analysis (PCA) technique, to assess cirrus cloud data reliability is described. The approach is demonstrated by an example of a study of optical and microphysical characteristics measured during two campaigns performed at mid-latitudes in the pristine Southern (SH) and polluted Northern (NH) Hemispheres within the international INCA project (Interhemispheric Differences in Cirrus Cloud Properties from Anthropogenic Emissions). The datasets were obtained by using state-of-the-art airborne instruments including the polar nephelometer and PMS particle size spectrometers for the ice-particle characterization. The approach is applied to both the measured angular scattering intensities and the ice-particle size distributions. It is shown that the PCA technique allows for impartial elimination of nonreliable channels of instruments. Furthermore, this tech-nique is efficient in a study if the dataset is statistically homogeneous, and provides the possibility of removing specific records corresponding to distinguishing statistical ensembles. The results, expressed in terms of significant components and corresponding eigenvalues, show that the Southern and Northern Hemisphere datasets are in good agreement and they can be considered as statistically representative of the sampled cirrus. Furthermore, the frequency distributions of the cirrus cloud microphysical and optical properties can be regarded as arbitrary positive quantities, which are lognormally distributed. The valida-tion of the measurements is provided by intercomparison of parameters estimated from different and independent techniques. The statistical relationships between quantities derived from angular scattering intensities and from ice-particle distributions as well as the similarity of the results obtained for the South-ern and NorthSouth-ern Hemisphere cases serve as proof of the reliability of the measured cloud properties.
1. Introduction
It is generally recognized that inadequate parameter-ization of ice-phase clouds is one of the greatest sources of uncertainty in both the modeling of climate pro-cesses and the interpretation of satellite remote sensing data (see, among others, Gonzalez et al. 2002). Accu-rate determination of their optical and microphysical * Additional affilation: OPGC, Laboratoire de Météorologie
Physique, UMR/CNRS, Université Blaise Pascal, Clermont-Ferrand, France.
Corresponding author address: Dr. J.-F. Gayet, Laboratoire de
Météorologie Physique, Université Blaise Pascal, 24, Avenue des Landais, 63177 Aubie`re Cedex, France.
E-mail: [email protected]
© 2005 American Meteorological Society
characteristics is also crucial for improved understand-ing of cloud formation and evolution (see, among oth-ers, Platt et al. 1989). For this reason, several intensive field campaigns have been carried out over the last two decades in order to improve our knowledge of ice-phase cloud systems—for example, the First Interna-tional Satellite Cloud Climatology Project (ISCCP) Re-gional Experiment (FIRE) experiments (Starr and Wylie 1990; Randall et al. 1995), the International Cir-rus Experiment (ICE’89; Raschke et al. 1990), the E u r o p e a n C l o u d a n d R a d i a t i o n E x p e r i m e n t (EUCREX’94; Sauvage et al. 1999), Formation Pro-cesses and Radiative Properties of Particles in Aircraft Wakes (AEROCONTRAIL; Schröder et al. 2000), and the Subsonic Aircraft: Contrail and Cloud Effects Spe-cial Study (SUCCESS; Lawson et al. 1998). Usually these experiments involve airborne instruments that si-multaneously measure microphysical, optical, and other characteristics of clouds as well as meteorological pa-rameters. Due to the well-known instrument shortcom-ings in the presence of small ice crystals in cirrus clouds (Gayet et al. 2002b) and because of the diversity of shapes and internal structures of ice particles (see, e.g., Heymsfield et al. 2002), the measurements must be carefully analyzed in order to reduce the uncertainties on the derived parameters.
Nowadays, a great deal of attention is paid to data reliability in the atmospheric sciences. Conferences have even featured special sessions devoted to the problem. As an example, we note the “Data Reliability and Usability” session at the 13th Conference on Ap-plied Climatology of the American Meteorological So-ciety (AMS 2002). We have not succeeded in finding out a strict definition of the term “data reliability” in the context of earth sciences. For social research meth-ods, McNeil (1990) defined data reliability in the fol-lowing terms: “If a method of collecting evidence is reliable it means that anybody using this method, or the same person using it at another time, would come up with the same results. The work could be repeated and the same results gained.” And, we believe that McNeil’s definition can serve for the atmospheric sciences. Of course, this definition should be considered along with the fact that instruments are dedicated to measure the physical quantities and, in principle, it may be possible to ensure data reliability by high-precision probes.
As far as measurement in cirrus clouds is concerned, the data reliability is usually ensured by rigorous cali-brations and repeated checks of the instruments before and during campaigns. An outstanding example of thorough calibrations is the laboratory measurements of the response of a PMS OAP-2DC performed by Strapp et al. (2001). Another widely used approach consists in validation—that is, comparing the same pa-rameter measured by different instruments using inde-pendent techniques. The case when the same param-eter is estimated from data recorded by different
probes (see, e.g., Gayet et al. 2002b) directly relates to this methodology.
From our standpoint, calibration and validations are necessary, however, not entirely sufficient for data re-liability assessment. Nowadays, datasets of routine or campaign measurements are usually too huge to be manually checked by an operator through all records. For instance, both approaches mentioned above are well established in meteorology. In addition, statistical methods are employed in meteorological data quality-control processes (Menne and Duchon 2001) despite the fact that, for example, temperature measurements are performed correctly. Statistical procedures provide checks for errors like electronic noise, defective records, a scale shift of the instrument, etc.
Compared to meteorological quantities, the mea-surement of cirrus cloud optical and microphysical pa-rameters is a much more challenging task. Conse-quently, we believe that not only do calibrations and validations have to be employed in the control of the reliability of the measured and estimated data, but methods of statistics as well. Statistical procedures can serve as powerful tools providing additional, but nec-essary, checks. With McNeil’s definition in mind, the following tactics of data reliability assessment can be employed. If several datasets are obtained in similar conditions and with clouds having the same properties, the most fundamental statistical features have to be shared by the datasets. Furthermore, the difference comes out in parameters like mean, variance, etc. These parameters serve as degrees of freedom. If a dataset (or several datasets) significantly differs by its main fea-tures from a whole ensemble, at least it means that special attention has to be paid to this dataset. Addi-tional investigations are to be performed in order to provide reasons for the decision whether the difference is a consequence of the properties (i.e., types) of the clouds sampled or instrument problems.
Among other statistical methods, the principal com-ponent analysis (PCA) is widely used in the atmo-spheric sciences (see, e.g., Wilks 1995). Having a num-ber of advantages, the PCA technique is used for vari-ous applications. One of the most important advantage consists in the fact that the PCA provides the possibility of reproducing almost all the variability of a dataset with reasonably good accuracy while considering only a few principal components. It is also advantageous to use the first principal components in the study if the measured datasets share the main statistical features. It should be noted that the principal components ob-tained in the course of such study provide by them-selves fruitful information. For instance, they can be used in applications when there are needs to model not only cloud mean parameters, but variations of them as well. The main goal of this paper is to describe a method-ology of applying statistical procedures, specifically the PCA technique, to assess data reliability. Another ob-jective is to report on statistical parameters of cirrus
cloud optical and microphysical characteristics mea-sured during two campaigns of the European INCA experiment (Interhemispheric Differences in Cirrus Properties from Anthropogenic Emissions; Ström et al. 2001). The first campaign, in the Southern Hemisphere (SH), was carried out from Punta Arenas (southern Chile), and the second, in the Northern Hemisphere (NH), from Prestwick (Scotland). Note that the nota-tion NH (“Northern”) and SH (“Southern”) is used to distinguish the respective campaigns; it is not intended to suggest hemispheric averages. The same instrumen-tation was operated in both campaigns on board the German DLR Falcon and during the same local season (autumn). In a previous paper (Gayet et al. 2002b), the reliability of the microphysical measurements of four combined and independent techniques had been evalu-ated from some representative examples. A statistical comparison has also been performed between ice-particle number concentrations measured by the CVI and the FSSP-300 (Seifert et al. 2002).
We first describe the main conditions of measure-ments and the in situ instrumeasure-ments. Then the principal component analysis technique is discussed. This tech-nique is applied to both the measured angular scatter-ing intensities (i.e., nonnormalized scatterscatter-ing phase functions) and the ice-particle size distributions and al-lows for a statistical evaluation on measurement reli-ability for the two datasets in terms of significant com-ponents and corresponding eigenvalues.
The PCA technique is used along with the data vali-dation. The validation is provided by intercomparison of parameters derived from different and independent measurements. The statistical relationships between quantities derived from angular scattering intensities and ice-particle distributions, as well as the similarity of the results obtained for the Southern and Northern cases serve as proof of the reliability and reproducibil-ity of the measured cloud properties. Consequently, the two datasets can be used for the comparison between the results from the SH and NH campaigns. The differ-ences in cirrus microphysical and optical properties be-tween the two hemispheres, together with interpreta-tion of the results are presented in detail by Gayet et al. (2004).
2. Instruments and observations
During the INCA campaigns, the probes were mounted on board the German Falcon research aircraft operated by Deutsches Zentrum für Luft- und Raum-fahrt. The INCA dataset includes the 1-Hz measure-ments performed during 11 flights carried out in the Southern Hemisphere and 10 flights in the Northern Hemisphere. (For additional information on the INCA project and the flight logs we refer to data available online at http://www.pa.op.dlr.de/inca/.)
Three independent techniques were used to measure optical and microphysical properties of cirrus clouds: (i)
the polar nephelometer, (ii) the PMS FSSP-300, and (iii) the PMS 2D-C probes. The instruments have al-ready been thoroughly described by Gayet et al. (2002b).
The polar nephelometer (Gayet et al. 1997) measures the angular scattering intensity at the wavelength of 0.8 m of an ensemble of cloud particles (i.e., water drop-lets or ice crystals or a mixture of these particles from a few micrometers to about 800 m in diameter). The observations were limited to 32 scattering angles near-uniformly positioned from 15° to 162° and restricted to nonpolarized light measurements due to the intrinsic optical setting of the polar nephelometer.
The PMS FSSP-300 optical particle counter basically measures particles from 0.3 to 20 m in diameter (Baumgardner et al. 1992). In the present study the particles larger than 3m in diameter have been as-sumed to be ice crystals. Evidence for aspherical small ice particles measured during INCA with typical asym-metry parameter of 0.77 has been highlighted by Gayet et al. (2002b). With regards to the previous work (Gayet et al. 2002b), which considered the calibration proposed by Borrmann et al. (2000), the size calibration of the last channel has been refined. Therefore, the upper size limit of the FSSP-300 in this study is actually 21.8m, which leads to better agreement with the first channel of the 2D-C probe in terms of particle concen-tration, extinction and ice water content. In this paper we consider the FSSP-300 results only in the size range from 3.0 to 21.8m.
The PMS 2D-C probe provides information on crys-tal size and shape for the size range 25–800m. The method of data processing used in this study has al-ready been described in detail by Gayet et al. (1996). We recall that the method provides, at a frequency of 1 Hz, the size spectrum distributed over 32 channels (each having a 25-m resolution from a 25–800-m size range) and the usual microphysical parameters: ice-particle concentration, mean ice-particle size, and ice water content (for more details see Gayet et al. 2004).
The inherent shortcomings of the PMS probes and data processing limit the accuracy of derived micro-physical parameters as exemplified in Table 1 (Gayet et al. 2004). The rough estimates of random uncertain-ties (based on published literature) include statistical errors related to sampling statistics, noise errors mainly due to sampling volume determination, and uncertain-ties from assumptions in the inversion of the PMS probe data (shape, density of particles, airspeed correc-tions, etc.).
The polar nephelometer is designed to measure the angular scattering intensity of an ensemble of particles. Thus, its sampling volume is much larger (about 200 times) than that of the PMS FSSP-300 and the statistical errors are considerably lower (Table 1). More detailed discussion of the potential problems is given in (Gayet et al. 2004). Considering the sufficiently low level of the polar nephelometer errors, we will use in section 3 the
angular scattering intensity records sampled for 1 s. In section 5 averaging will only be used for synchroniza-tion with the PMS probes data.
For both the INCA campaigns, no supercooled water or frozen ice spherical droplets were detected by the polar nephelometer for a temperature below –33°C. That is, the corresponding records do not contain data that may be considered as angular scattering intensities of an ensemble of spherical particles. Therefore, the analysis only includes data collected below that tem-perature. The in-cloud criterion was defined on the ba-sis of the extinction coefficient values derived from the polar nephelometer measurements. The optical and microphysical parameters were related to in-cloud cases when the corresponding extinction coefficient values were larger than a threshold of 0.05 km⫺1, which roughly corresponds to a concentration of ice particles of 0.1 cm⫺3 with a diameter of 5 m. Accordingly, we deal with a subset of the INCA data and the opti-cally thin cirrus clouds that are not included in the analysis.
In the following, all results are presented separately for the Southern and Northern field experiments. Spe-cial attention will be paid to analysis and possible in-terpretation of the similarity and the difference in char-acteristics. The following results are obtained on the basis of samples with a total number of 32 214 and 21 664 for the Southern and Northern cases, respectively. (This corresponds to around 5476 and 3683 km of the total length of the in-cloud flights.) One sample means, a data structure that contains optical and microphysical records all together.
3. Angular scattering intensities from polar nephelometer measurements
The angular dependence of the irradiance scattered by cloud particles—that is, the single-scattering phase function() with representing the scattering angle— belongs to a set of the most important cloud optical characteristics. The phase function and/or its derived parameters, such as the asymmetry parameter, are widely used in applications for climate modeling and remote sensing retrievals. The polar nephelometer pro-vides very important information on the scattering phase function, despite the fact that the measurements are performed in the limited range of angles. In our
investigation, we are dealing with an angular scattering intensity (i.e., nonnormalized scattering phase func-tion) expressed in (m⫺1sr⫺1) and documented on 32 angular scattering coefficients(i), where the
param-eter i represents the channel number. As we will dem-onstrate later in this section, the probability density function of the logarithm of cirrus cloud scattered en-ergy values at each scattering angle fit very closely to the normal distribution. Therefore, the statistical study of reliability of the polar nephelometer data has been performed not for the measured values (i) but for
their logarithm, that is, 1n(i).
a. Results from the principal component analysis
The PCA is known to be designed to generate a new set of uncorrelated parameters, called principal compo-nents, representative of the original dataset. Algebra-ically, principal components could be defined as par-ticular linear combinations of a set of variables. These linear combinations represent the selection of a new coordinate system obtained by rotating the original sys-tem of coordinates. The new axes correspond to the directions with maximum variability and provide a sim-pler description of the covariance structure of the origi-nal set of variables (Johnson and Wichern 1998). In many practical implementations, only a few principal components, called significant components, are re-quired to reproduce almost all the system’s variability with reasonably good accuracy (see, e.g., Wilks 1995). This is especially true when a limited number of pri-mary physical parameters have a major impact on the measured functions (in this case, angular scattering in-tensities).
According to the PCA technique, the principal com-ponents l(i), that is, the first eigenvectors of the
dataset correlation matrix, allow for the angular scat-tering intensities (expressed in log scale) to be de-scribed with the following expansions (for more details see Jourdan et al. 2003):
lnj共i兲⬇具ln共i兲典⫹
兺
l⫽14
Cjll共i兲, 共1兲
where具. . .典 denotes averaging over the total dataset, j is the number of the function from the set, and Cj,l⫽ 共lnj
⫺ 具ln典)Tជ
l are the expansion coefficients of lnj (
T
denotes a transposed matrix). Each vector (i.e., lnjat
TABLE1. Random uncertainty estimates on microphysical and optical parameters for two particle concentrations: A⫽ 5 cm⫺3, B⫽
0.5 cm⫺3. Labels (i), (ii), (iii), and (iv) refer to the works of Baumgardner et al. (1992), Gayet et al. (1996), Gayet et al. (2002b), and Gayet et al. (2004), respectively. PMS means FSSP-300 and 2D-C taken altogether.
Parameter Particle concentration Particle size Extinction coefficient Phase function
Asymmetry parameter Probe FSSP-300 (i) 2D-C (ii) FSSP-300 (i) 2D-C PMS (i) Polar neph. (iii) Polar neph. (iv) Polar neph. (iii)
Uncertainty A 30% 50% 35% 25% 60% 25% 4% 4%
each j) is expressed with good accuracy by four coeffi-cients Cj,l. At the same time, the considerably reduced
number of parameters (Cj,l,, l⫽ 1, . . . , 4) is much more
convenient for further analysis than the vectors [j(i),
i⫽ 1, . . . , 32].
1) ELIMINATION OF NONRELIABLE CHANNELS AND DATA OF DISTINGUISHING CASES
First of all, the PCA can be used as a tool for impar-tial elimination of the data corresponding to the non-reliable channels. This relates to channels having had some nonobvious problems (e.g., electronic noise of a rather high level or defective records) during measure-ments. If this is the case, the first eigenvectors l(i)
graphs have high discontinuities (peaks). Usually, the values of the angular scattering intensities at the neigh-bor angles are well correlated and the principal com-ponents have to be pretty smooth functions. Accord-ingly, the peaks indicate the nonreliable channels (see the detailed example in Jourdan et al. 2003). As far as it is concerned the INCA dataset, the two channels (102.5° and 134°) were eliminated on the base of the approach described and the records of the angular scat-tering intensities at the 30 remaining channels are used in the following.
It is worth noting that the PCA technique can be employed in the “bad data pursuit” wherever the mea-sured parameters are supposed to be reasonably corre-lated—for example, such parameters as angular or spectral functions of the irradiance that are obtained from remote sensing. Another important point is that the described approach is not able to discover biases, for instance, caused by improper calibrations or well-correlated errors in data processing algorithms. On the other hand, the validation is a rather convenient tool to check out if data are biased or not (see section 5).
After eliminating the nonreliable channels, we ap-plied the PCA to the remaining set of angular scattering intensities once more. As expected, the high disconti-nuities in the principal components disappeared.
It was stated in the introduction that the PCA tech-nique could be employed in the study if the recorded data are statistically homogeneous. The probability distribution functions (PDFs) of the expansion co-efficients or their linear combinations as well as the scatterplots Cj,nversus Cj,mare fruitful in such a study.
Usually, if there is a distinguishing subensemble in a dataset, a rigorous investigation of all available param-eters has to be performed for the final decision. It was found on the base of such an investigation that in the INCA dataset, the records corresponding to the orographic wave cirrus (OWC) sampled over Punta Arenas on 13 April 2000 and the anvil cirrus (AC) sampled over Prestwick on 12 October 2000 clearly dif-fered from those recorded during other flights. We chose the polar nephelometer data of the OWC case to show an example. In that particular case, the discrep-ancy is most clearly seen from PDFs of the quantity
⌽j⫽ Cj,1⫺ Cj,2⫺ Cj,3. Figure 1 shows the normalized
to 100% PDFs of⌽. The black graph corresponds to the OWC data, the dashed curve relates to the South-ern data without the wave cirrus case. It is seen that the difference is pronounced and statistically significant. This conclusion is in agreement with the PMS probe data. In the particular OWC and AC cases, the particle number concentration reached very high values (up to 100 cm⫺3; Gayet et al. 2002c), which were much larger than the “usual” particle concentrations observed in the other cases.
It follows that the sampled orographic wave-cirrus and anvil-cirrus records differ from other INCA data by their optical and microphysical properties; that is, they belong to other statistical ensembles. Accordingly, the full dataset has to be separated into subsets. The same tactics should be applied to each of them. For simplici-ty’s sake, we will demonstrate the results of the data reliability assessment only on the example of the largest subset; that is, we will investigate the INCA data with-out the two special cases mentioned. (This remark con-cerns the microphysical data as well.) It will be seen that the remaining ensemble of data is statistically ho-mogeneous and no other subsets have to be eliminated.
2) COMPARING STATISTICAL PARAMETERS
In a detailed study if data belong to the same statis-tical ensemble—that is, share main statisstatis-tical features— it is convenient to divide data into several subsets and to compare computed characteristics. From a statistical point of view, it is preferable to perform data separa-tion into subsets in an arbitrary and random way. On the contrary, we used the natural subsets of the INCA FIG. 1. Probability distribution functions of the parameter⌽ for the Southern case (dashed line) and the wave-cirrus case (black line).
data, that is, the Southern and Northern ones. This al-lows us to get ideas of distinctions between the data of the two campaigns along with the data reliability as-sessment.
The average angular scattering intensities calculated for the Southern and Northern datasets are plotted in Fig. 2. (The accuracy of the angular scattering intensity measurements is quite high. Accordingly, the size of the symbols outlines error bars in log presentation.) The results clearly show that the Northern mean values are significantly higher than the Southern ones. This obser-vation is discussed in detail in (Gayet et al. 2004). In addition, some differences are evident in the shapes of the functions by normalizing at ⫽ 113° the Southern average angular scattering intensity to the Northern one (see Fig. 2). It appears that compared to the North-ern case, more energy is scattered at the angle range
between 15° and 30° in the Southern case leading to a slightly larger value of the asymmetry parameter g. The mean values of g are 0.770 and 0.768 for the Southern and Northern campaigns, respectively.
After having shown distinctions between the mean values, we are going to discuss characteristics that are similar. The first step was to investigate the linear cor-relations between the logarithms of the scattered en-ergy values measured at different angles. The results show very high and similar correlation coefficients for both the Southern and Northern cases (greater than 0.95 and 0.97, respectively). This indicates that the data of the disputable channels were well eliminated and that both sets are rather homogeneous. The variations of the shape of the scattering functions due to the ice-particle shape and/or dimension distinctions can be in-vestigated by employing the PCA technique.
We applied the PCA separately to the Southern and Northern datasets. The results in Figs. 3a and 3b rep-resent the first two principal components or eigenvec-torsn(i) of the correlation matrices, where n is the
component’s number. The results highlight that the Southernn(i)Sand Northernn(i)Neigenvectors are
very similar for each component number and further-more have very close values. For both cases, the values of the first component l(i) are approximately
con-stant (see Fig. 3a). It should be noted that a strictly constant principal component relates to the case when only the magnitude of the angular scattering intensity varies without any change in the function shape. In turn, this principal component can be associated with the variation of the total cloud particle concentration when the ice-particle shape and the effective diameter remain unchanged. The corresponding eigenvalues of the first components␦1Sand␦1N, normalized as a
per-centage of the total variance, are of 98.9% and 99.4% for the Southern and Northern datasets, respectively (see Table 2). This means that about 99% of the angu-lar scattering intensity variance is roughly due to fluc-tuations of the total ice-particle concentration. FIG. 2. Average phase functions for the Southern case (gray line
with points), the Southern case normalized to the Northern one (dashed line), and the Northern case (black line).
FIG. 3. Principal components of the phase function datasets: (a) first and (b) second. The Southern case is the dashed line with points, the Northern case is the black line.
Figure 3b displays the second significant component, which is related to the variations of the shape of the angular scattering intensity. The components 2(i)S
and2(i)Nchange their sign twice, namely, around ⫽
45° and ⫽ 145°. Accordingly, they mostly govern the redistribution of the scattered energy from the angle range between 45° and 145° to the directions with value lower than 45° and higher than 145°, and vice versa.
The similarity between the Southern and Northern cases is preserved in the third and fourth components (not shown). Table 2 summarizes the normalized eigen-values for the second through to the fourth compo-nents. The second and the third eigenvalues are 0.50% and 0.28% (for the Southern and Northern cases) and 0.19% and 0.12%, respectively. The second compo-nents represent about 46% of the residual variance (i.e., the variance that remains after considering the first component; Kendall 1980). The second, third, and fourth components taken together represent about 72% of the residual variance for the two cases.
It should be noted that the principal components are always very sensitive to features of the object investi-gated. Therefore, the results presented above undoubt-edly provide evidence that both angular scattering in-tensity datasets have the same main statistical proper-ties. This serves as an additional reason to prove the reliability of the polar nephelometer’s data. Moreover, this gives grounds to treat both cases mixed together and thus to compute a common set of principal com-ponents, that is, a common coordinate system. This co-ordinate system provides the basis for a more detailed statistical analysis of the data. Therefore, the PCA was applied to the combined dataset. As expected, its re-sults give significant components, which are close to those presented in Fig. 3 (the corresponding normal-ized eigenvalues are reported in Table 2).
The outlined above data can be used in applica-tions—for instance, to model radiative transfer. Models of the cirrus cloud phase function can be compared against the vectors 具ln典 plotted in Fig. 2. Also, the principal componentsl(i) along with具ln典 provide an
easy way to model variations of the phase function. For this purpose it is enough to use Eq. (1) with l⫽ 1, . . . , 2 and vary the coefficient Cj,2 within a reasonable
range. The advantage of such way is that the variations will be modeled in agreement with the experimental data.
b. Interpretation of the results
The similarity of the Southern and Northern princi-pal components does not mean that both datasets are totally identical from a statistical point of view, but rather that the main features are the same. There are degrees of freedom that provide a possibility of distinc-tions, for instance, between the mean values. When the PCA technique is applied to the combined dataset, the difference in the characteristics appears as distinctions between properties of the expansion coefficients Cj,l.
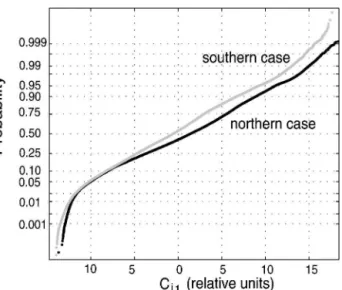
Figure 4 shows a normal probability plot of the coeffi-cients Cj,1, computed for the Southern and Northern
cases. In such a representation (Chambers et al. 1983), if the data do come from a normal distribution, the plot has to appear linear. The overwhelming majority of points lie close to the straight lines.
The difference in the slope between the two lines reflects the discrepancies between the Southern and Northern average angular scattering intensities. The nonlinear branch at the beginning of each curve is due to the extinction coefficient threshold used to define “in-cloud” observations. Therefore, the angular scatter-ing intensities that correspond to low concentration of ice particles (i.e., the smallest values of Cj,1) were
elimi-nated along with the clear atmosphere data and offsets. Because the coefficients of the linear correlation be-tween the values of Cj,1 and lnj(i) are very high
(⬎0.98 for all angles i), the cumulative distribution
functions of lnj(i) for each i are strictly close to
those represented in Fig. 4 and lnj(i) can be
consid-ered as the normal distributions. This property is in agreement with a fundamental result of statistics: the probability density of arbitrary positive quantities is the lognormal probability density (Tarantola 1994).
Two main conclusions follow from the foregoing. FIG. 4. Cumulative distribution functions of the coefficients Cj,1.
The Southern case has gray points, the Northern case has black points.
TABLE2. Normalized eigenvalues (in %) for the first four
com-ponents calculated for the polar nephelometer measurements. La-bels S, N, and W correspond to Southern cases, Northern cases, and the whole dataset, respectively.
Component No. 1 2 3 4
␦S 98.9 0.50 0.19 0.10
␦N 99.4 0.28 0.12 0.04
First, the probability distribution functions are of the same kind for the Southern and Northern cases. This result is in accordance with the observations of Immler and Schrems (2002) who discuss frequency of occur-rence of the optical depth of cirrus clouds during the INCA campaigns. This is another argument for proving the reliability of the polar nephelometer’s data. Second, the statement that a variety of cirrus cloud optical char-acteristics belong to the lognormal distribution can be used in climate and remote sensing applications as well as in inverse problem constraints.
To avoid misunderstanding, the following has to be pointed out. Cirrus cloud single-scattering characteris-tics do not vary independently, and there is a high cor-relation between them. However, each parameter by itself can be described by the lognormal law. Another point is that the variety of cirrus cloud types is large. None of parameters can be characterized by a unimodal distribution when experimental data were recorded in several types of clouds or when ice clouds were formed under considerably different conditions.
4. Particle size distributions from the PMS probes
The average cirrus ice-crystal size distributions are shown in Fig. 5a for both the Southern and Northern cases. Figure 5b illustrates the difference between the distributions (the Northern values minus the Southern ones). The right part of the histograms on Fig. 5a (from 25- to 800-m particle size) displays the data measured by the PMS 2D-C probe. The distinction is given in the corresponding size range of Fig. 5b (note the right y axis). The two distributions are very close with the number concentration a little higher for the Southern case. The left part of the histograms of Fig. 5a repre-sents the size distributions measured by the PMS FSSP-300 probe. The concentration of relatively small par-ticles is significantly higher for the Northern case (see the left histogram of Fig. 5b). In the size range up to 7.5 m, the difference is 2–5 times higher than the width of a 95% confidence interval for the estimated
average values. The features of the ice crystal size dis-tributions are in full agreement with the properties of the mean angular scattering intensities shown in Fig. 2. It is seen that the preponderance of the Northern an-gular scattering intensity comes from the dominance of the concentration of the relatively small particles.
Cloud particle size-distributions are derived using the PMS FSSP-300 and PMS 2D-C probes from the num-bers of particles counted on each size bin and from the corresponding volume of air sampled. The sampling pe-riod⌬t of 1 s was used for the optical and microphysical data processing in the INCA project database. Particle counting with an airborne spectrometer is a stochastic Poisson process (see, among others, Pawlowska et al. 1997; Snyder and Miller 1991). Therefore, the relative standard deviation (RSD) increases when the counted number decreases and it is inversely proportional to the square root of the counted number.
With regards to cirrus clouds, it is difficult to ensure a local statistically significant number of counts in every sample. Particle concentration is spatially variable and relatively low, especially the concentration of large par-ticles measured by the PMS 2D-C probe. The sampling volume of the PMS FSSP-300 probe is limited in order to ensure single particle counting. From a statistical significance viewpoint, polar nephelometer data are more reliable because this instrument is designed to measure the angular scattering intensity of an ensemble of particles. Thus, polar nephelometer sampling volume is about 200 times larger than PMS FSSP-300. Inherent random uncertainties including statistical errors related to probe sampling statistics have already been thor-oughly discussed with details by Gayet et al. (2002b). Obviously, these random uncertainties become very important for low particle number concentrations. These errors crucially affect results when the objective is, for instance, to study variations of particle size dis-tributions. They could be reduced considerably by av-eraging over longer periods—that is, by applying linear smoothing with a rectangular window of a fixed sam-pling period, which corresponds to a low-pass filter. FIG. 5. (a) Average cirrus ice-crystal size distributions. The Southern case is the gray-line
histograms, and the Northern case is the black-line histograms. (b) Difference between the Northern and the Southern average cirrus ice crystal size distributions.
Accordingly, such filtering leads to the loss of informa-tion on variainforma-tions at the small scale.
Aiming to apply the PCA technique, we chose a com-promise approach. Sampling periods were enlarged for the cases of low concentration and they remain at 1 s when the RSD is relevant. It was done according to the following algorithm.
It is preassigned the maximal value⌬tmax⫽ 150 s of
the sampling period and a RSD threshold of 5%. Start-ing from the first data sample of each flight, the param-eter⌬t is enlarged so long as the RSD is higher than the threshold or⌬t is lower than ⌬tmax. Depending on the
particle concentration, the new sampling period⌬t1
ob-tained can have a value from 1 s to ⌬tmax. The new
sample is computed by averaging data belonging to the obtained interval⌬t1. The parameter⌬t2is computed in
the same way starting from the first sample following those that were considered at⌬t1, and so on. As a
re-sult, one obtains the set of unequal sampling periods ⌬tk and the new series of corresponding samples. A
special procedure should be used at regions where func-tions jump. Averaging has to be prevented from taking data from intervals with low and high concentrations together. To synchronize filtered data from different probes, the described algorithm was applied to the PMS FSSP-300 records only. Polar nephelometer and PMS 2D-C data were averaged on the base of the series of ⌬tk, which came from filtering of the PMS FSSP-300
records. In the following, we deal with the filtered data only.
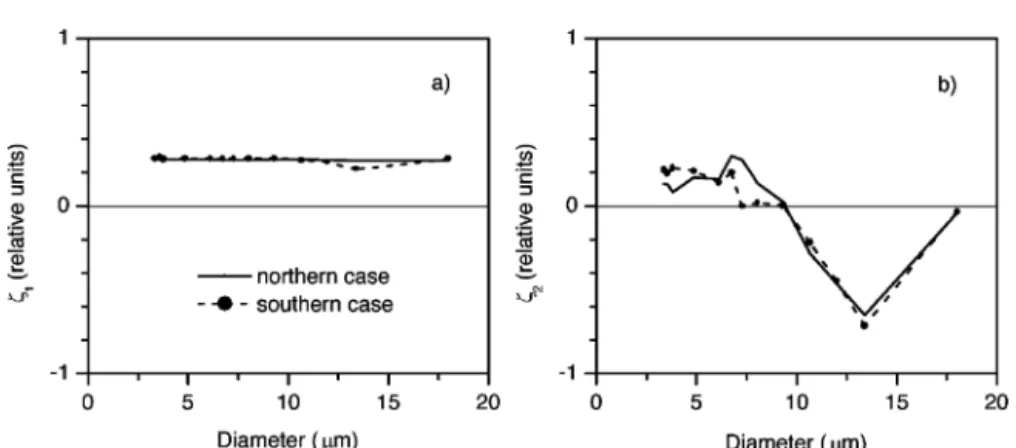
Because the histogram presentation is not sensitive enough to evidence minor differences between the two datasets, we turn to the PCA technique for a better statistical description of the results. Figure 6 displays two first principal componentsn(Di) of PMS FSSP-300
data. The results show that the Southern and Northern cases present very similar properties. The first compo-nents 1(Di)Sand 1(Di)N (Fig. 6a) mostly correspond
to variations of the total particle concentration. The second vectors l(Di)S and 2(Di)N (Fig. 6b) govern
changes of the effective diameter. Table 3 summarizes
the normalized eigenvalues for the first and second components. They are 86.0% and 94.5% (for the South-ern and NorthSouth-ern cases), and 5.7% and 1.2%, respec-tively. Accordingly, variations of the particle size dis-tribution shape are more likely for cirrus clouds sampled in the Punta Arenas area. Taken together, the first two significant components represent about 92% and 96% of the total variance for the Southern and Northern cases, respectively.
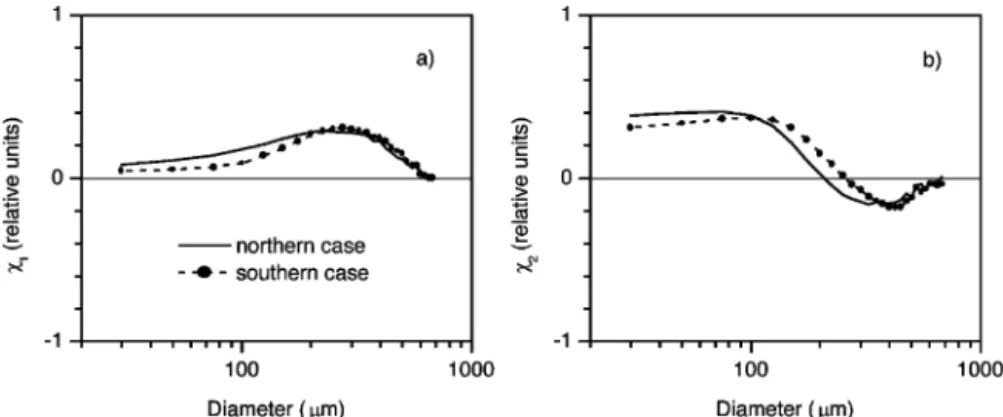
Figure 7 represents the first two principal compo-nentsn(Di) of PMS 2D-C data, which again highlight
that the results are very similar comparing the Southern and the Northern cases. The first component displayed on Fig. 7a [1(Di)] reveals that the variations of
con-centration of particles with diameters from 200 to 400 m dominate the feature. Compared to previous results the eigenvalues related to the PMS 2D-C are quite dif-ferent (see Table 4). They are 30.8% and 35.0% (for the Southern and Northern cases) and 20.4% and 15.7%, respectively. Taken together, the first two significant components represent only about 65% and 63% of the total variance for the Southern and Northern cases, re-spectively. This result arises from the relatively low lin-ear correlation between values of the size distributions of large crystals.
As mentioned above, PCA results are sensitive to minor variations of an observed dataset. Nevertheless, the foregoing clearly shows that the significant compo-nents of the size distributions as well as the normalized eigenvalues are close for the Southern and Northern cases. These results serve as an additional reason to prove the reliability of the data recorded by the PMS FIG. 6. Principal components of PMS FSSP-300 datasets: (a) first and (b) second. The
Southern case is the dashed line with points, and the Northern case is the black line.
TABLE3. Normalized eigenvalues (%) for the first two compo-nents calculated for the PMS FSSP-300 measurements. Labels S and N correspond to the Southern and Northern cases, respectively.
Component No. 1 2
␦S 86.0 5.7
FSSP-300 and PMS 2D-C probes during the INCA field campaigns. Also, it should be noted that the average size distributions and the principal components out-lined above can be used in applications in the same manner as the data reported in section 3a(2).
5. Intercomparison of parameters derived from the polar nephelometer and the PMS probes
In sections 3 and 4, it was shown that the Southern and Northern INCA datasets share the main statistical features and, consequently, the optical and microphysi-cal records are not self-contradictory. As mentioned above, the PCA technique is not able to discover biases, for example, caused by improper calibrations or well-correlated errors in data processing algorithms. This is why it is highly desirable to employ the PCA along with procedures of validation—that is, comparing estima-tions of the same parameters derived from data re-corded by different probes.
In the following, the intercomparison of the extinc-tion coefficient estimaextinc-tions is presented. The process-ing method of the INCA data from FSSP-300 and 2D-C probes and the uncertainties on the derived microphysi-cal parameters have been described in detail in Gayet et al. (2002b, 2004). The derivation of the extinction coefficient and the asymmetry parameter from angular scattering intensity measurements documented in a lim-ited range of angles can be found in Gayet et al. (2002a). (Random uncertainty estimates on the extinc-tion coefficient are outlined in Table 1.) Those two techniques can be considered as quite independent. They use different optical characteristics of particles, and the polar nephelometer measures angular scatter-ing intensities of an ensemble of particles, whereas the PMS probe results are derived from single event count-ing.
Figure 8 displays in log–log scale the extinction co-efficient inferred from the polar nephelometer as a function of the extinction derived from both the FSSP-300 and the 2D-C probes. The log–log scale is used
according to the results of section 3b and in order to avoid dominance of the cases with higher extinction values. Scatterplots from the Southern case (Fig. 8a) and the Northern case (Fig. 8b) are represented. We recall that filtered sampled data are used in this com-parison. The examination of Fig. 8 confirms that the extinction coefficients derived from independent tech-niques are in due agreement throughout the large range of the magnitude. In some instances the discrepancy is rather high. Enlarging of sampling periods did not al-low us to completely overcome the inherent shortcom-ings of the probes. The two datasets are characterized by relationships having very close values of the slope parameters. The correlation coefficients are of 0.89 with the 99% confidence interval from 0.876 to 0.903 for the Southern case, and of 0.82 with the 99% confi-dence interval from 0.796 to 0.841 for the Northern case. This result gives evidence for the reliability of the measurements of ice particles by both PMS and polar nephelometer probes and on our method of data pro-cessing.
6. Conclusions
This paper describes the methodology of applying statistical procedures and, in particular, the principal component analysis technique to assess cirrus cloud data reliability. The approach is demonstrated by an example of a statistical reliability study of optical and microphysical properties measured during two cam-paigns of the European INCA experiment. The PCA technique was applied to both the measured angular
TABLE4. Normalized eigenvalues (in %) for the first two com-ponents calculated for the PMS 2D-C measurements. Labels S and N correspond to the Southern and Northern cases, respectively.
Component No. 1 2
␦S 30.8 20.4
␦N 35.0 15.7
FIG. 7. Principal components of PMS 2D-C datasets: (a) first and (b) second. The Southern case is the dashed line with points; the Northern case is the black line.
scattering intensities and the ice-particle size distribu-tions.
It is shown that the approach allows for impartial elimination of data not obviously contaminated—for instance, by electronic noise and/or defective records— that is, the nonreliable channels of instruments.
The PCA technique can serve in a study if the dataset is statistically homogeneous and provide the possibility of eliminating records corresponding to distinguishing statistical ensembles. It follows from the analysis that the sampled orographic wave-cirrus and anvil-cirrus clouds differ from other INCA data by their optical and microphysical properties.
The PCA results, expressed in terms of significant components and corresponding eigenvalues, show that the Southern and Northern datasets can be considered as statistically representative of the cirrus sampled. Fur-thermore, the frequency distributions of the cirrus cloud microphysical and optical properties can be con-sidered as arbitrary positive quantities, which are log-normally distributed.
The validation of the measurements is provided by intercomparison of parameters derived from different and independent techniques. Because the instruments have very different sampling volumes, random uncer-tainties related to sampling statistics could be reduced considerably by adjusting the sampling periods as a function of the particle number concentration. The sta-tistical relationships between quantities derived from angular scattering intensities and ice-particle distribu-tions as well as the similarity of the results obtained for the Southern and Northern cases serve as proof of the reliability of the measured cloud properties. Conse-quently the two datasets can be used for the compari-son between the results from the SH and NH cam-paigns. The differences in cirrus microphysical and op-tical properties between the two hemispheres are presented and discussed in detail in (Gayet et al. 2004). The described cirrus cloud characteristics—namely,
the average angular scattering intensities, the average size distributions, and the principal components—can be used in applications; for instance, to model radiative transfer. They provide the possibility to simulate varia-tions of parameters in agreement with the experimental data.
Acknowledgments. This work was partially funded by
the European Union Contract EVK2-CT-1999-00039, by DLR within the PAZI project, and grants from the CNRS/PATOM. Thanks are due to our INCA col-leagues for their helpful contribution to the experi-ments. We are very grateful to the members of the DLR who operated the Falcon aircraft during the two experiments. We acknowledge all the people that sup-ported us at the Punta Arenas and Prestwick airports both before and during the campaigns. We also thank J-F Fournol and C. Gourbeyre (LaMP) for their tech-nical assistance.
REFERENCES
American Meteorological Society, 2002: Session 2: Data Reliabil-ity and UsabilReliabil-ity. Preprints, 13th Conf. on Applied
Climatol-ogy, Portland, OR, Amer. Meteor. Soc., 2.1–2.16.
Baumgardner, D., J. E. Dye, R. G. Knollenberg, and B. W. Gan-drud, 1992: Interpretation of measurements made by the FSSP-300X during the Airborne Arctic Stratospheric Expe-dition. J. Geophys. Res., 97, 8035–8046.
Borrmann, S., B. Luo, and M. Mishchenko, 2000: Application of the T-Matrix method to the measurement of aspherical (el-lipsoidal) particles with Forward Scattering Optical counters.
J. Aerosol Sci., 31, 789–799.
Chambers, J., W. Cleveland, B. Kleiner, and P. Tukey, 1983:
Graphical Methods for Data Analysis. Wadsworth Publishing,
395 pp.
Gayet, J.-F., G. Febvre, G. Brogniez, H. Chepfer, W. Renger, and P. Wendling, 1996: Microphysical and optical properties of cirrus and contrails: Cloud field study on 13 October 1989. J.
Atmos. Sci., 53, 126–138.
——, O. Crépel, J.-F. Fournol, and S. Oshchepkov, 1997: A new airborne Polar Nephelometer for the measurements of opti-FIG. 8. Extinction coefficient inferred from the scattering phase function vs the extinction
calculated from the PMS FSSP and 2D-C probes: (a) Northern case and (b) Southern case. The symbols n, a, and r refer to the number of data points, the slope of the best-fit curve equation (solid line), and the correlation coefficient, respectively. The following relationship is assumed to fit the data: log( y)⫽ a ● log(x) ⫹ b.
cal and microphysical cloud properties. Part I: Theoretical design. Ann. Geophys., 15, 451–459.
——, S. Asano, A. Yamazaki, A. Uchiyama, A. Sinyuk, O. Jour-dan, and F. Auriol, 2002a: Two case studies of winter conti-nental-type water and mixed-phase stratocumuli over the sea 1. Microphysical and optical properties. J. Geophys. Res., 107, 4569, doi:10.1029/2001JD001106.
——, and Coauthors, 2002b: Quantitative measurement of the microphysical and optical properties of cirrus clouds with four different in situ probes: Evidence of small ice crystals.
Geophys. Res. Lett., 29, 2230, doi:10.1029/2001GL014342.
——, F. Immler, F. Auriol, A. Minikin, A. Petzold, J. Ovarlez, and J. Ström, 2002c: Microphysical and optical properties of a wave-cirrus cloud sampled during the INCA experiment. Preprints, 11th Conf. on Cloud Physics, Ogden, UT, Amer. Meteor. Soc., CD-ROM, P1.2.
——, and Coauthors, 2004: Cirrus cloud microphysical and optical properties at southern and northern mid-latitudes during the INCA experiment. J. Geophys. Res., in press.
Gonzalez, A., P. Wendling, B. Mayer, J.-F. Gayet, and T. Rother, 2002: Remote sensing of cirrus cloud properties in the pres-ence of lower clouds: An ATSR-2 case study during the In-terhemispheric differences in cirrus properties from anthro-pogenic emissions (INCA) experiment. J. Geophys. Res., 107, 4693, doi:10.1029/2002JD002535.
Heymsfield, A. J., A. Bansemer, P. R. Field, S. L. Durden, J. L. Stith, J. E. Dye, W. Hall, and C. A. Grainger, 2002: Obser-vations and parameterizations of particle size distributions in deep tropical cirrus and stratiform precipitating clouds: Re-sults from in situ observations in TRMM field campaigns. J.
Atmos. Sci., 59, 3457–3491.
Immler, F., and O. Schrems, 2002: LIDAR measurements of cir-rus clouds in the northern and southern midlatitudes during INCA (55°N, 53°S): A comparative study. Geophys. Res.
Let., 29, 1809, doi:10.1029/2002GL015077.
Johnson, R. A., and D. J. Wichern, 1998: Applied Multivariate
Statistical Analysis. 4th ed. Prentice Hall, 816 pp.
Jourdan, O., S. Oshchepkov, J.-F. Gayet, V. Shcherbakov, and H. Isaka, 2003: Statistical analysis of cloud light scattering and microphysical properties obtained from airborne measure-ments. J. Geophys. Res., 108, 4155, doi:10.1029/2002JD002723. Kendall, M. G., 1980: Multivariate Analysis. 2d ed. Charles
Grif-fin, 210 pp.
Lawson, P., A. J. Heymsfield, S. M. Aulenbach, and T. L. Jensen, 1998: Shapes, sizes and light scattering properties of ice crys-tals in cirrus and a persistent contrail during SUCCESS.
Geo-phys. Res. Lett., 25, 1331–1334.
McNeil, P., 1990: Research Methods. 2d ed. Routledge, 320 pp. Menne, M. J., and C. E. Duchon, 2001: A method for monthly
detection of inhomogeneities and errors in daily and mini-mum temperatures maximini-mum. J. Atmos. Oceanic Technol.,
18, 1136–1149.
Pawlowska, H., J.-L. Brenguier, and G. Salut, 1997: Optimal non-linear estimation for cloud particle measurements. J. Atmos.
Oceanic Technol., 14, 88–104.
Platt, C. M. R., J. D. Spinhirne, and W. D. Hart, 1989: Optical and microphysical properties of a cold cirrus cloud: evidence for regions of small ice particles. J. Geophys. Res., 94 (D8), 11 151–11 164.
Randall, D. A., B. Albrecht, S. Cox, D. Johnson, P. Minnis, W. Rossow, and D. Starr, 1995: On FIRE at Ten. Advances in
Geophysics, Vol. 38, Academic Press, 37–177.
Raschke, E., J. Schmetz, J. Heintzenberg, R. Kandel, and R. Saun-ders, 1990: The International Cirrus Experiment (ICE): A joint European effort. Eur. Space Agency J., 14, 193–199. Sauvage, L., H. Chepfer, V. Trouillet, P. H. Flamant, G. Brogniez,
J. Pelon, and F. Albers, 1999: Remote sensing of cirrus ra-diative properties during EUCREX’94. Case study of 17 April 1994. Part I: Observations. Mon. Wea. Rev., 127, 504– 519.
Schröder, F., and Coauthors, 2000: On the transition of contrails into cirrus clouds. J. Atmos. Sci., 57, 464–480.
Seifert, M., J. Ström, R. Krejci, A. Minikin, A. Petzold, J.-F. Gayet, U. Schumann, and J. Ovarlez, 2002: In situ observa-tions of aerosol particles remaining from evaporated cirrus crystals: comparing clean and polluted cases. Atmos. Chem.
Phys. Discuss., 2, 1599–1633.
Snyder, D. L., and M. J. Miller, 1991: Random Point Processes in
Time and Space. Springer-Verlag, 480 pp.
Starr, D. O’C., and D. P. Wylie, 1990: The 27–28 October 1986 FIRE cirrus case study: Meteorology and clouds. Mon. Wea.
Rev., 118, 2259–2287.
Strapp, J. W., F. Albers, A. Reuter, A. V. Korolev, U. Maixner, E. Rashke, and Z. Vukovic, 2001: Laboratory measurements of the response of a PMS OAP-2DC. J. Atmos. Oceanic
Tech-nol., 18, 1150–1170.
Ström, J., and Coauthors, 2001: Aerosol and cirrus measurements at midlatitudes on the Southern hemisphere: An overview based on the first INCA experiment. Air Pollut. Rep. 74, Rep. EUR 19, 428. EN, European Commission, Brussels, 314 pp.
Tarantola, A., 1994: Inverse Problem Theory: Model for Data
Fit-ting and Model Parameter Estimation. 1st ed. Elsevier
Sci-ence, 601 pp.
Wilks, D. S., 1995: Statistical Methods in the Atmospheric Sciences. International Geophysics Series, Vol. 59, Academic Press, 464 pp.