Publisher’s version / Version de l'éditeur:
Analytical Chemistry, 82, 21, pp. 8978-8982, 2010-09-30
READ THESE TERMS AND CONDITIONS CAREFULLY BEFORE USING THIS WEBSITE. https://nrc-publications.canada.ca/eng/copyright
Vous avez des questions? Nous pouvons vous aider. Pour communiquer directement avec un auteur, consultez la
première page de la revue dans laquelle son article a été publié afin de trouver ses coordonnées. Si vous n’arrivez pas à les repérer, communiquez avec nous à PublicationsArchive-ArchivesPublications@nrc-cnrc.gc.ca.
Questions? Contact the NRC Publications Archive team at
PublicationsArchive-ArchivesPublications@nrc-cnrc.gc.ca. If you wish to email the authors directly, please see the first page of the publication for their contact information.
NRC Publications Archive
Archives des publications du CNRC
This publication could be one of several versions: author’s original, accepted manuscript or the publisher’s version. / La version de cette publication peut être l’une des suivantes : la version prépublication de l’auteur, la version acceptée du manuscrit ou la version de l’éditeur.
For the publisher’s version, please access the DOI link below./ Pour consulter la version de l’éditeur, utilisez le lien DOI ci-dessous.
https://doi.org/10.1021/ac1019396
Access and use of this website and the material on it are subject to the Terms and Conditions set forth at
Metrological triangle for measurements of isotope amount ratios of
silver, indium and antimony using multicollector-inductively coupled
plasma mass spectrometry: the 21st century Harvard method
Yang, Lu; Sturgeon, Ralph E.; Mester, Zoltán; Meija, Juris
https://publications-cnrc.canada.ca/fra/droits
L’accès à ce site Web et l’utilisation de son contenu sont assujettis aux conditions présentées dans le site LISEZ CES CONDITIONS ATTENTIVEMENT AVANT D’UTILISER CE SITE WEB.
NRC Publications Record / Notice d'Archives des publications de CNRC: https://nrc-publications.canada.ca/eng/view/object/?id=dfdae362-c915-4f7a-b270-f4238a41efe4 https://publications-cnrc.canada.ca/fra/voir/objet/?id=dfdae362-c915-4f7a-b270-f4238a41efe4
Metrological triangle for measurements of isotope amount ratios of
silver, indium and antimony using MC-ICPMS: the 21st century
Harvard method
Lu Yang*, Ralph E. Sturgeon, Zoltán Mester and Juris Meija
Institute for National Measurement Standards, National Research Council Canada,
Ottawa, Ontario, Canada, K1A 0R6.
ABSTRACT
The calibration of measurements of isotope amount ratio using a log-linear regression method with multicollector inductively coupled plasma mass spectrometry (MC-ICPMS) is the latest development in isotope amount ratio metrology. This calibration method, however, is often met with criticism. In this work, we evaluate the robustness of this calibration strategy wherein measurements of antimony and indium isotope amount ratios are calibrated against isotope amount ratio of silver, despite the significant difference in their atomic mass. In addition, a metrological triangle comprising Ag-Sb-In measurement results is constructed from three pairs of inter-elemental isotope amount ratio calibrations: N(123Sb)/N(121Sb) from the N(109Ag)/N(107Ag) of NIST SRM 978a
measurement standard, N(115In)/N(113In) from the N(123Sb)/N(121Sb), and then calibration
of N(109Ag)/N(107Ag) from the obtained N(115In)/N(113In) measured ratio values to verify
consistency with the known N(109Ag)/N(107Ag). This calibration method revives one of
the salient features of the classical ‘Harvard method’—a network of relationships amongst the isotopic compositions of various elements. The atomic weights of antimony and indium, reported here for the first time using MC-ICPMS, 121.7590(22)k=2 and
114.818 27(35)k=2, are in good agreement with their current Standard Atomic Weights. In
addition, this study provides the first calibrated mass spectrometric isotope amount ratio measurements for indium.
KEYWORDS Metrologically traceable isotope ratios, atomic weight, mass bias correction, MC-ICPMS, indium, antimony, silver, metrology, commutability.
1. INTRODUCTION
Building on the accomplishments of Berzelius, Cannizzaro and Stas, high-accuracy determinations of atomic weights culminated in the early 20th century in the work of
Theodore W. Richards.1 For this, he was awarded the 1914 Nobel Prize in Chemistry.
The Harvard method, as it was known, essentially established a firm relationship between the atomic weights of metallic elements by precipitation of their halides with silver salts. The atomic weight of antimony, for example, was established by titration of pure SbBr3
with AgNO3. Thus, the isotopic composition of antimony was calibrated against the
isotopic composition of silver (and bromine).2-3 Although now entirely absent from the
scientific arsenal, such an approach had the advantage of cross-validating isotopic composition amongst the elements—a feature that is lacking with modern mass spectrometry methods, wherein isotopic composition for each element is determined in isolation using blends of near-pure isotopes of the same element for calibration.4-7 In
modern metrological parlance, this corresponds to establishing commutability of isotope amount ratio measurement results.
Traditionally, thermal ionization mass spectrometry (TIMS) has been the authoritative technique for delivering the smallest possible measurement uncertainty of isotope amount ratios8. Recent developments in multicollector inductively coupled plasma mass
spectrometry (MC-ICPMS) have enabled this technique to become a powerful research tool with over four-hundred papers published annually in the past several years9. In
addition to its simple and robust sample introduction system, the ICP source is capable of ionizing nearly all elements, providing relative repeatability of the isotope amount ratio measurements as low as 1.10-5, similar to that achieved with TIMS8. The simultaneous
multi-element measurement capability enables correction of isotope amount ratio values against readily available certified isotopic reference materials of other elements. For example, measurements of isotope amount ratios for mercury can be calibrated using thallium admixed to the Hg sample10. Although this principle of ‘external normalization’
in mass spectrometry dates back to 198711, its full potential remains untapped due to
First, there is a common belief that an effective isotope amount ratio correction can only be achieved when working in close vicinity to the atomic mass of the measurand due to higher likelihood that both it and the calibrant will have identical mass-bias, or nearly so. In other words, silver would typically be dismissed as a calibrant for the establishing the value of N(123Sb)/N(121Sb) owing to their large difference in atomic masses. Rather, that
selection is more rationally undertaken using the adjacent element tin12. It is clear that
such a mode of operation restricts the number of potential applications of external normalization even within the limitations of current MC-ICPMS instruments, which allow for an ∼20% spread in atomic mass to be measured simultaneously.
Second, the mathematical formalism of the mainstream isotope amount ratio measurement protocol—the exponential correction model—is based on the assumption of identical mass-bias between the isotopes in the calibrant and those of the measurand.8In
recent years, however, it has been recognized that the extent of isotope fractionation differs from element to element. Consequently, the isotope amount ratios derived in this manner can be erroneous8. For example, errors of up to half a per cent have been noted
when the 202Hg/200Hg ratio is calibrated via 205Tl/203Tl using the exponential correction
model10. Moreover, the isotope amount ratios corrected using the exponential model can
show dependence on the concentration of the measurand, which clearly invalidates the use of such a correction approach10. The modern log-linear regression model of isotope
amount ratio calibration abandons both of these restrictions while delivering metrologically traceable isotope amount ratios with unprecedented small measurement uncertainties.10, 13-15
To date, there is a limited set of published MC-ICPMS Sb isotope amount ratio measurements, all of which report variations against a common working calibrator (delta scale) to circumvent the challenge of mass-bias correction for measurements of metrologically traceable data and to achieve much smaller uncertainty for relative measurements, not necessarily metrologically traceable isotope amount ratios.12, 16-17
There are none for indium by MC-ICPMS. To the best of our knowledge, this is first report of measurements of metrologically traceable isotope amount ratios of antimony and indium using MC-ICPMS.
As noted earlier, mass bias is traditionally corrected for using the principle of least difference between the atomic masses of the measurand and calibrant. In this study, we test the robustness of the regression calibration both in the domain of time and mass difference between the measurand and the calibrant. A metrological triangle comprising Ag-In-Sb measurement results is constructed from the three pairs of inter-elemental isotope amount ratio calibrations: N(123Sb)/N(121Sb) from the N(109Ag)/N(107Ag) provided
by a NIST SRM 978a calibrant, N(115In)/N(113In) from the N(123Sb)/N(121Sb), and then
calibration of N(109Ag)/N(107Ag) from the obtained N(115In)/N(113In) to verify consistency
with the known value of N(109Ag)/N(107Ag). Such a two-step mass bias transfer provides
a robustness test of the regression model.
2. EXPERIMENTAL SECTION
2.1. Instrumentation. A Neptune MC-ICPMS (Thermo Fisher Scientific, Bremen,
Germany) equipped with nine Faraday cups and a combination of cyclonic and Scott-type spray chambers with a self-aspirating perfluoroalkoxy polymer nebulizer MCN50 (Elemental Scientific, Omaha NE, USA) was used for all measurements. The plug-in quartz torch with sapphire injector was fitted with a platinum guard electrode. Low resolution mode was employed. Optimization of the Neptune was performed as recommended by the manufacturer18and typical operating conditions are summarized in
Table 1. The gain on each Faraday cup was monitored daily to ensure normalization of its efficiency.
2.2. Reagents and solutions. Reagent grade nitric and hydrochloric acids (Fischer
Scientific Canada, Ottawa ON, Canada) were purified in-house prior to use by sub-boiling distillation of reagent grade feedstock in a quartz still. High-purity (18 MΩ-cm) deionized water was obtained from a NanoPure mixed bed ion exchange system fed with reverse osmosis domestic feed water (Barnstead/Thermolyne Corp, Iowa, USA). Isotopic standard reference material for silver, SRM 978a (AgNO3), was obtained from the
National Institute of Standards and Technology (Gaithersburg MD, USA). A 1000 µg g–1
stock solution of silver was prepared by quantitative dissolution of SRM 978a in HNO3
and diluted with water to a 2% volume fraction of HNO3. A 1000 µg g–1stock solution of
(99.9999%, Johnson Matthey, London, UK) in a mixture of HNO3and HCl, which was
then diluted with deionized water. A 1000 µg g–1stock solution of indium was prepared
by quantitative dissolution of high purity indium metal (99.9999%, Johnson Matthey, London, UK) in HNO3 and then diluted with deionized water. SCP Science (Quebec,
Canada) was used to source 1000 µg g–1stock solutions of In and Sb.
2.3. Sample preparation and analysis. Sample preparation was conducted in a class-100
clean room. Replicate solutions of 0.25 to 2 µg Sb g–1 or 0.25 to 1 µg In g–1 were
prepared by diluting the antimony stock solution in a mixture of 1% HNO3and 3% HCl
followed by an addition of the NIST 978a Ag stock solution. The mass fraction of silver in the test solutions varied from 250 to 500 ng g–1. Samples were introduced into the
plasma in a self-aspiration mode at a flow rate of 50 μL min–1. Ion currents of Sb or In
and Ag isotopes obtained from a blank solution containing 1% HNO3and 3% HCl were
subtracted from those of all samples. A static run was employed to collect isotope ions of each pair of elements, as shown in Table 2. Ten to fifteen measurements were made on each sample solution, the duration of each session of measurements being of the order of 10–15 h. Data reported here were collected between March and June of 2010.
3. RESULTS AND DISCUSSION
3.1. Instrument settings. To obtain optimum results, a static measurement procedure is
desired whereby the ion currents from all isotopes of interest are simultaneously collected. As the Neptune allows for a maximum 17% difference in atomic mass between the outermost detectors18, their configurations for each pair or for all three
elements, presented in Table 2, permitted monitoring of Ag, In and Sb isotope ions currents simultaneously, or separately in pairs of Ag→Sb and Ag→In.
3.2. Mass bias correction. With metrologically traceable values of isotope amount ratios
being of interest, the log-linear regression mass bias correction model was used to measure isotope amount ratios of Sb and In in this study, in a manner similar to that used in previous studies of Zn14, Cu14, Hg16and Ge13isotopes. This model is based on
monitoring the temporal drift in the simultaneous isotopic ratio measurements where the intercept and slope of the constructed log-linear regressions between the observed (uncorrected) isotope amount ratios of the measurand N(123Sb)/N(121Sb) (r
N(115In)/N(113In) (r
In) and the calibrant N(109Ag)/N(107Ag) (rAg) forms the basis for
calibration of Sb and In isotope amount ratio measurements.8, 10, 13The present approach
for measurements of Sb and In isotope amount ratios uses silver isotopic measurement standard (NIST SRM 978a); thus, it resembles the classical Harvard method wherein the atomic weight of antimony was essentially calibrated using the atomic weight value of silver. The major advantage of the regression model over the traditional exponential correction model is that the regression approach is free of the assumed need for identical fractionation behaviour between the element pairs.10, 13Additionally, the regression
model is not hampered by the untestable assumption regarding the very nature of the fractionation (linear, exponential, etc.). Equation (2) forms the basis for the Sb (or In) isotope amount ratio calibration with silver as the calibrant:10, 13
Ag b slope, Ag Sb , intercept Ag Sb Sb Sb ln lnln ln lnln ln ln r K K R K K R r a Ag (2) It is worth emphasizing that this expression is a logarithmic rearrangement of the expressions RSb= KSb.rSband RAg= KAg.rAg, where K is the isotope amount ratio
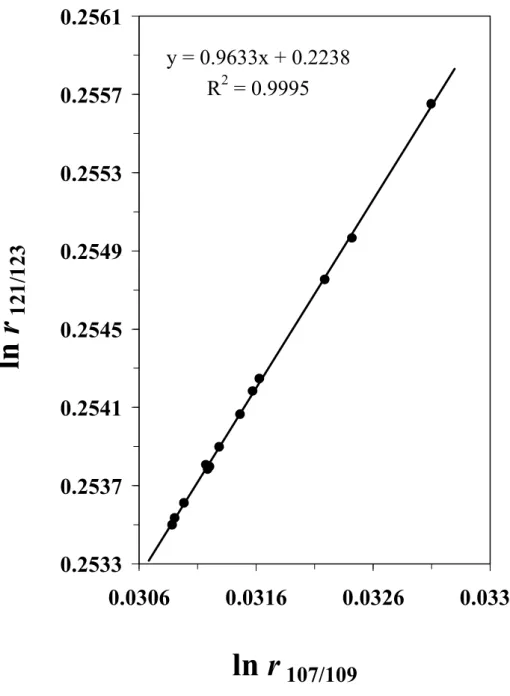
correction factor (constant) that links measured isotope amount ratio value (r) with the mass bias corrected isotope amount ratio (R). As evident from Figure 1, the drift in the
N(123Sb)/N(121Sb) and N(109Ag)/N(107Ag) measured isotope ratios defines a log-linear
relationship over a measurement session of 10–15 h in accordance with equation (2). The corresponding intercept (a) and slope (b) of the log-linear regression are calculated using a least squares approach and the estimates are then used to obtain the mass bias corrected isotope ratios of antimony using an expression that follows directly from equation (2):19
(3) In this work, the NIST certified value of N(109Ag)/N(107Ag) = R
Ag= 1.076 39(22)k=2is
used. Although equation (3) resembles the traditional exponential mass-bias correction in its appearance, the underlying logic of the two models is significantly different13.
3.3. Spectral interferences. Potential spectral interferences from 91Zr16O+, 90Zr16OH+, 93Nb16O+, 92Zr16OH+, 92Mo16OH+, 97Mo16O+, 96Mo16OH+, 40Ar73Ge+,40Ar75As+, 99Ru16O+, 123Te+, 105Pd16O+, 104Ru16OH+, 107Ag16O+and 106Pd16OH+ on Sb, In and Ag isotopes may
arise in samples containing these elements and thus could enlarge the measurement
RSb RAg b ea
uncertainty of the determined Sb or In isotope amount ratios. They require elimination or correction. Semi-quantitative analysis of the Sb and In sample solutions revealed that the mass fractions of potential interference-forming elements, Zr, Nb, Mo, Te, Pd and Ru, were less than 5 pg g–1. Such amounts would give rise to insignificant isobaric
interferences since the mass fraction of Ag, In and Sb in the samples was some six orders of magnitude larger, i.e., 0.2 and 2 µg g–1, respectively. Although silver was added to the
Sb or In sample solutions at mass fractions of up to 0.5 µg g–1, the ion current measured
at m/z 123 (107Ag16O+) was 1.1.10-14A from a 0.5 µg g–1standard solution of silver and is
similar to that obtained from a blank solution (1% HNO3 and 3% HCl). This clearly
indicates that any interference from107Ag16O+on 123Sb+is insignificant.
3.4. Measurements. For the measurements of Sb, In and Ag isotope amount ratios,
replicate sample solutions of 0.25 to 2 µg Sb g–1, 0.25 to 1 µg In g–1and 0.2 to 0.5 µg
Ag g–1 were prepared and each was measured under the optimized experimental
conditions during a 10–15 h measurement session. Over the four-month period encompassing March to June, 2010, many sets of the N(123Sb)/N(121Sb) or
N(115In)/N(113In) vs. N(109Ag)/N(107Ag) or N(115In)/N(113In) vs. N(123Sb)/N(121Sb)
log-linear regressions were acquired, each yielding the respective intercepts and slopes. Of these, 54 high-quality Ag→Sb sets, 30 high-quality Ag→In sets and 18 high-quality Sb→In sets exhibiting coefficient of determination larger than 0.99 were selected. The size of each result set was simply idiosyncratic and determined by the effort and investment of labour. One such measurement series is shown in Figure 1. The mass bias corrected Sb or In isotope amount ratios were then obtained using equation (3) with subsequent calculation of the corresponding isotope abundances and atomic weight.20
3.5. Uncertainty evaluation. Uncertainty estimations for the mass bias corrected Sb and
In isotope amount ratios as well as isotopic abundances and atomic weight were done in accordance with the JCGM 100:28 “Guide to the Expression of Uncertainty in Measurement”.22 The actual calculation procedure is described in detail elsewhere.10, 23
To wit, measurement uncertainty propagation of equation (3) leads to the following for antimony (Ag→Sb): . (4) ur2(R Sb) b 2u r 2(R Ag) (uaa,b ubln RAg) 2
The estimates of the Ag→Sb and Sb→In regression intercepts and slopes are perfectly anticorrelated (ρa,b= –1), whereas in the In→Ag measurement system—positively
correlated. Note that the uncertainty of the isotope amount ratio of silver is incorporated into the combined uncertainties of the Sb and In isotope ratios. Although trivial, this aspect is not widely appreciated.9 The uncertainty in the measurements of isotope
abundance is obtained from equation (5) as isotope abundance is calculated from isotope amount ratios, i.e., x121= 1/(1 + RSb) and x123= 1 – x121, hence:
(5) Lastly, the uncertainty in the measurements of atomic weight was calculated as follows:20, 24
(6) . (7) Using this approach, each regression plot yields a set of Sb isotope ratios, isotope abundances and atomic weight with their corresponding uncertainties for each estimate. The grand average of experimental results is then obtained which serves as the property value for all measurands. Similar equations were derived for Sb→In, In→Ag and Ag→In regressions.
The combined uncertainty of the grand mean, uc, was obtained by combining the
uncertainties of the individual estimates and the variations between these means as per recent guidelines from NIST—the Type B model of the bias method.25The following
equation was used:
, (8)
where smis the standard deviation of the p means and uiis the uncertainty of the
individual measurand estimates, i = [1…p].
3.6. Measurement results
Metrological triangle. As a result of the availability of isotopic silver measurement
standard (NIST SRM 978a), Sb and In were selected for study as they cover the largest possible atomic mass interval (17%) compatible with simultaneous MC-ICPMS
uc sm2 1 p ui 2
uAr(Sb) 2 (m 123 m121) 2u2(x 121) x121 2 u2(m 121) x123 2 u2(m 123) Ar(Sb) x121m121 x123m123 u(x121) u(x123) u(RSb) (1 RSb) 2measurements. This was done to evaluate the robustness of the regression calibration in the domain of atomic mass difference between the measurand and the calibrant. The crux of the estimation of accuracy of the regression mass bias correction model itself lies in a “triangle” of three isotope amount ratio calibrations constructed from nine high-quality sets of simultaneously measured Sb, In and Ag amount ratios in the samples prepared from same stock solutions. First, the NIST SRM 978a value of N(109Ag)/N(107Ag) = R
Ag
= 1.07639(22)k=2is used to calibrate N(123Sb)/N(121Sb) (RSb). Subsequently, the value
obtained for RSbis used to calibrate N(115In)/N(113In) (RIn). Lastly, the RInis used to
calculate RAgin NIST SRM 978a. Results are shown in Figure 2a. Despite the 17%
difference in atomic mass between the measurand and calibrant (Ag and Sb), an output result of RAg= 1.0763 (60)k=2is obtained, confirming the accuracy of this mass bias
correction model.
Furthermore, the robustness of the regression model was tested by performing the pair-wise isotope amount ratio calibrations sequentially over an extended period of time (see Table 2 for the Faraday cup configurations). This was done with samples prepared from different stock solutions. Again, the NIST SRM 978a value of RAg= 1.076 39(22)k=2was
used to calibrate N(123Sb)/N(121Sb) (R
Sb, March-April 2010) which was used to calibrate
N(115In)/N(113In) (May-June 2010). Finally, the R
Inwas used to determine RAgin NIST
SRM 978a (June 2010). Note also that each measurement step in the ‘triangle’ was performed using different Faraday cups. Results are shown in Figure 2b. Two
conclusions can be made. First, the regression model delivers mass bias transfer stable to 1.10-4over extended periods of time despite the 17% difference in atomic mass between
the measurand and calibrant (Ag→Sb→In). Second, the uncertainty estimates of the calibrated isotope amount ratios are not underestimated. In other words, the output result (RAg) is consistent with the input value of the NIST SRM 978a. The uncertainty in the
antimony and indium isotope amount ratio measurement results is largely driven by the repeatability and reproducibility of the measurements and not the uncertainty in the silver isotope amount ratio specified for the NIST calibrant.
Isotopic composition. The final results for the metrologically traceable isotope amount
ratios of Sb and In were calculated by combining all high-quality data sets obtained from March to June 2010 by MC-ICPMS with use of the regression mass bias correction
model based on the NIST SRM 978a Ag isotopic measurement standard. Results are summarized in Table 3. The corresponding atomic weights of Ar(Sb) = 121.7590(22)k=2
and Ar(In) = 114.818 27(35)k=2are in good agreement with the current Standard Atomic
Weights—121.760(1) and 114.818(3), respectively.20
CONCLUSIONS
The robustness of the log-linear regression method for mass bias correction has been evaluated for measurement of isotope amount ratios characterized by small measurement uncertainty. The approach is straightforward and offers significant advantages over other popular mass bias correction models currently in use. Most notably, the concept of commutability has been demonstrated, whereby the perceived constraint of selecting a calibrant having atomic mass close to that of the measurand has been obviated. Any calibrant isotope pair lying within the static run mass range of the spectrometer can be used for this purpose. Currently, this means that any reference pair within the
approximately 17% range of the multicollector field would be suitable. Ideally, a mass spectrometer capable of simultaneous full mass range detection (“all the signal, all the time”), such as that developed by Hieftje and co-workers26(and currently available from
Spectro), would require only a single isotopic measurement standard to enable mass bias correction for any measurand.
REFERENCES
1. Hartley, H. J. Chem. Soc., 1930, 1937-1969.
2. Willard, H. H; McAlpine, R. K. J. Am. Chem Soc, 1921, 43, 797–818. 3. Weatherill, P. F. J. Am. Chem. Soc. 1924, 46, 2437–2445.
4. De Laeter, J. R.; Hosie, D. J. Int. J. Mass Spectrom. Ion Processes, 1988, 83, 311–318.
5. Wachsmann, M.; Heumann, K. G. Int. J. Mass Spectrom. Ion Processes, 1991, 108, 75–86.
6. Chang, T. L.; Qian, Q. Y.; Zhao, M. T.; Wang, J. Int. J. Mass Spectrom. Ion
Processes, 1993, 123, 77–82.
7. De Laeter, J. R.; Böhlke, J. K.; De Bièvre, P.; Hidaka, H.; Peiser, H. S.; Rosman, K. J. R.; Taylor, P. D. P. Pure Appl. Chem. 2003, 75, 768-769.
8. Yang, L. Mass Spectrom. Rev. 2009, 28, 990-1011. 9. Douthitt, C. B. J. Anal. At. Spectrom. 2008, 23, 685-689.
10. Meija, J.; Yang, L.; Sturgeon, R. E.; Mester, Z. J. Anal. At. Spectrom. 2010, 25, 384-389.
11. Longerich, H. P.; Fryer, B. J.; Strong, D. F. Spectrochim. Acta 1987, 42B, 39-48. 12. Clayton, R.; andersson, P.; Gale, N. H.; Gillis, C.; Whitehouse, M. J. J Anal. At.
Spectrom., 2002, 17, 1248-1256.
13. Yang, L.; Meija, J. Anal. Chem., 2010, 82, 4188-4193.
14. Marechal, C. N.; Telouk, P.; Albarede, F. Chem. Geol. 1999, 156, 251-273. 15. Yang, L.; Sturgeon, R. E. Anal. Bioanal. Chem. 2009, 393, 377-385. 16. Rouxel, O.; Ludden, J.; Fouquet, Y. Chem. Geol., 2003, 200, 25-40.
17. Wehmeier, S.; Ellam, R.; Feldmann, J. J Anal. At. Spectrom., 2003, 18, 1001-1007.
18. http://www.thermo.com/eThermo/CMA/PDFs/Various/File_26979.pdf, Neptune Produce Brochure, BR30028_F12/08C.
19. Meija, J.; Yang, L.; Sturgeon, R. E.; Mester, Z. Anal. Chem. 2009, 81, 6774-6778. 20. De Laeter, J. R.; Böhlke, J. K.; De Bièvre, P.; Hidaka, H.; Peiser, H. S.; Rosman,
K. J. R.; Taylor, P. D. P. Pure Appl. Chem. 2003, 75, 683-800.
Associated Terms; VIM, 3rdedition, JCGM 200:2008, http://www.bipm.org/en/publications/guides/vim.html
22. (21)Evaluation of Measurement Data-Guide to the Expression of Uncertainty in Measurement; JCGM 100:28: http://www.bipm.org/en/publications/guides/gum.html
23. Meija, J.; Mester, Z. Metrologia 2008, 45, 53-62.
24. Audi, G.; Wapstra, A. H.; Thibault, C. Nuclear Phys. A, 2003, 729, 337-676. 25. Levenson, M. S.; Banks, D. L.; Eberhardt, K. R.; Gill, L. M.; Guthrie, W. F.; Liu,
H. K.; Vangel, M. G.; Yen, J. H.; Zhang, N. F. Journal of the Research of the
national Institute of Standards and Technology, 2000, 105, 571-579.
26. Schilling, G. D.; Ray, S. J.; Sperline, R.P.; Denton, M.B.; Barrinaga, C. J.; Koppenaal, D.W.; Hieftje, G.M. J. Anal. At. Spectrom., 2010, 25, 322 – 327.
Table 1. MC-ICPMS operating conditions Instrument settings
Reflected forward power 1250 W
Plasma gas flow rate 15.0 L Ar min–1
Auxiliary gas flow rate 1.00 L Ar min–1
Carrier gas flow rate 1.020 L Ar min–1
Orifice of the nickel sampler cone 1.1 mm Orifice of the high-performance
nickel skimmer cone 0.8 mm
Lens settings Optimized for maximum analyte ion current
Data acquisition parameters
Mass resolution, m/∆m ~300 Signal integration time 33.5 s Number of integrations, cycles,
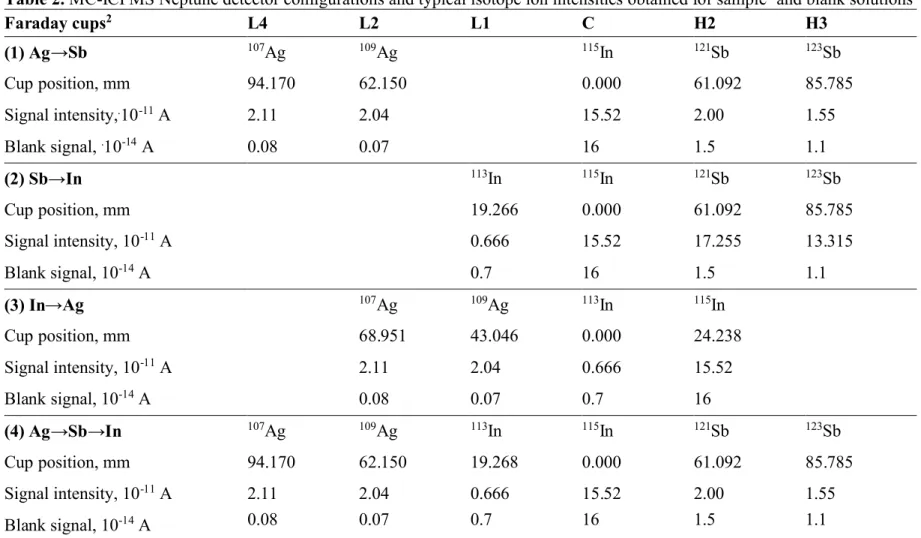
Table 2. MC-ICPMS Neptune detector configurations and typical isotope ion intensities obtained for sample1and blank solutions Faraday cups2 L4 L2 L1 C H2 H3 (1) Ag→Sb 107Ag 109Ag 115In 121Sb 123Sb Cup position, mm 94.170 62.150 0.000 61.092 85.785 Signal intensity,.10-11A 2.11 2.04 15.52 2.00 1.55 Blank signal, .10-14A 0.08 0.07 16 1.5 1.1 (2) Sb→In 113In 115In 121Sb 123Sb Cup position, mm 19.266 0.000 61.092 85.785 Signal intensity, 10-11A 0.666 15.52 17.255 13.315 Blank signal, 10-14A 0.7 16 1.5 1.1 (3) In→Ag 107Ag 109Ag 113In 115In Cup position, mm 68.951 43.046 0.000 24.238 Signal intensity, 10-11A 2.11 2.04 0.666 15.52 Blank signal, 10-14A 0.08 0.07 0.7 16 (4) Ag→Sb→In 107Ag 109Ag 113In 115In 121Sb 123Sb Cup position, mm 94.170 62.150 19.268 0.000 61.092 85.785 Signal intensity, 10-11A 2.11 2.04 0.666 15.52 2.00 1.55 Blank signal, 10-14A 0.08 0.07 0.7 16 1.5 1.1 1 Mass fraction of Sb, In and Ag is 0.3, 0.5 and 0.15 µg g–1, respectively.
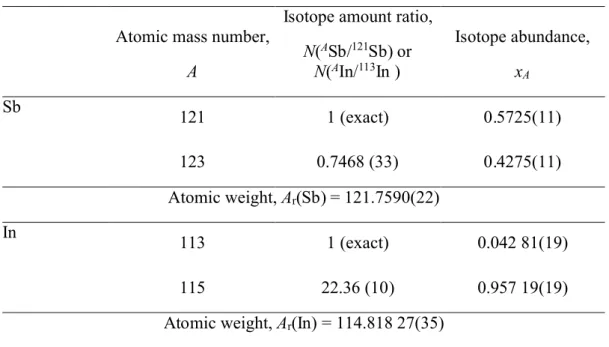
Table 3. Isotope amount ratios, abundances and atomic weights of Sb and Ina
Atomic mass number,
A
Isotope amount ratio,
N(ASb/121Sb) or N(AIn/113In ) Isotope abundance, xA Sb 121 1 (exact) 0.5725(11) 123 0.7468 (33) 0.4275(11) Atomic weight, Ar(Sb) = 121.7590(22) In 113 1 (exact) 0.042 81(19) 115 22.36 (10) 0.957 19(19) Atomic weight, Ar(In) = 114.818 27(35)
a Values are presented in a concise notation whereby the expanded uncertainty is given in
parenthesis next to the least significant digits to which it applies; for example, x121 =
0.5725(11) is the concise form of the expression x121 = 0.5725 ± 0.0011. It is intended
that the expanded uncertainty encompasses every aspect that reasonably contributes to the uncertainty in measurements of quantity value. A coverage factor of two (2) was applied. Atomic masses used for calculation are from the 2003 Atomic mass evaluation23.
Figures and Captions
Figure 1. Temporal drift of the determined N(123Sb)/N(121Sb) (r
sb) and N(109Ag)/N(107Ag)
(rAg) isotope amount ratios in a typical 14 h measurement session.
Figure 2. Metrological triangles for silver→antimony→indium→silver isotope amount
ratio calibrations using MC-ICPMS (a) constructed from sets of simultaneously measured isotope amount ratios of Sb, In and Ag and (b) constructed from data sets obtained sequentially during March to June 2010 in pairs of Ag→Sb, Sb→In and In→Ag.
y = 0.9633x + 0.2238
R
2= 0.9995
0.2533
0.2537
0.2541
0.2545
0.2549
0.2553
0.2557
0.2561
0.0306
0.0316
0.0326
0.0336
ln r
107/109
ln
r
12
1/
12
3
Figure 2. Temporal drift of the determined N(123Sb)/N(121Sb) (r
sb) and N(109Ag)/N(107Ag)
Figure 2. Metrological triangles for silver→antimony→indium→silver isotope amount
ratio calibrations using MC-ICPMS (a) constructed from sets of simultaneously measured isotope amount ratios of Sb, In and Ag and (b) constructed from data sets obtained
sequentially during March to June 2010 in pairs of Ag→Sb, Sb→In and In→Ag.