Publisher’s version / Version de l'éditeur:
ASHRAE Transactions, 114, pt. 1, pp. 369-378, 2008-07-01
READ THESE TERMS AND CONDITIONS CAREFULLY BEFORE USING THIS WEBSITE. https://nrc-publications.canada.ca/eng/copyright
Vous avez des questions? Nous pouvons vous aider. Pour communiquer directement avec un auteur, consultez la
première page de la revue dans laquelle son article a été publié afin de trouver ses coordonnées. Si vous n’arrivez pas à les repérer, communiquez avec nous à PublicationsArchive-ArchivesPublications@nrc-cnrc.gc.ca.
Questions? Contact the NRC Publications Archive team at
PublicationsArchive-ArchivesPublications@nrc-cnrc.gc.ca. If you wish to email the authors directly, please see the first page of the publication for their contact information.
NRC Publications Archive
Archives des publications du CNRC
This publication could be one of several versions: author’s original, accepted manuscript or the publisher’s version. / La version de cette publication peut être l’une des suivantes : la version prépublication de l’auteur, la version acceptée du manuscrit ou la version de l’éditeur.
Access and use of this website and the material on it are subject to the Terms and Conditions set forth at
CFD investigation of balcony spill plumes in atria
McCartney, C. J.; Lougheed, G. D.; Weckman, E. J.
https://publications-cnrc.canada.ca/fra/droits
L’accès à ce site Web et l’utilisation de son contenu sont assujettis aux conditions présentées dans le site LISEZ CES CONDITIONS ATTENTIVEMENT AVANT D’UTILISER CE SITE WEB.
NRC Publications Record / Notice d'Archives des publications de CNRC:
https://nrc-publications.canada.ca/eng/view/object/?id=abc26971-3052-4ba9-ad15-ddbcb2dea7da https://publications-cnrc.canada.ca/fra/voir/objet/?id=abc26971-3052-4ba9-ad15-ddbcb2dea7dahttp://irc.nrc-cnrc.gc.ca
C F D i n v e s t i g a t i o n o f b a l c o n y s p i l l p l u m e s i n
a t r i a
N R C C - 5 0 0 4 3
M c C a r t n e y , C . J . ; L o u g h e e d , G . D . ; W e c k m a n ,
E . J .
A version of this document is published in / Une version de ce document se trouve dans: ASHRAE Transactions, v. 114, pt. 1, 2008, pp. 369-378
The material in this document is covered by the provisions of the Copyright Act, by Canadian laws, policies, regulations and international agreements. Such provisions serve to identify the information source and, in specific instances, to prohibit reproduction of materials without written permission. For more information visit http://laws.justice.gc.ca/en/showtdm/cs/C-42
Les renseignements dans ce document sont protégés par la Loi sur le droit d'auteur, par les lois, les politiques et les règlements du Canada et des accords internationaux. Ces dispositions permettent d'identifier la source de l'information et, dans certains cas, d'interdire la copie de documents sans permission écrite. Pour obtenir de plus amples renseignements : http://lois.justice.gc.ca/fr/showtdm/cs/C-42
CFD Investigation of Balcony Spill
Plumes in Atria (RP-1247)
ABSTRACT
There have been a number of concerns regarding the balcony spill plume equation provided in North American standards and codes. These include: lack of verification by full-scale experiments and application of the equation for high atria even though it was developed for low-height atria. As a result of these concerns, the American Society of Heating, Refrigerating and Air-Conditioning Engineers (ASHRAE) initiated a project to evaluate the balcony spill plume equation used in North American codes and standards (RP-1247). The primary research conducted, as part of RP 1247, was a series of full-scale experiments conducted to investigate smoke flow in balcony spill plumes and the resulting mechanical exhaust requirements for an atrium. The research project included CFD modeling studies to investigate smoke entrainment in the balcony area and smoke entrainment in high atria. In this paper, the results of a CFD model study, which investigated the variation of plume mass flow rate with elevation in a simulated atrium, are presented. Results from the CFD model study were compared to existing engineering correlations. A new correlation was also developed for the variation in mass flow rate with elevation for a balcony spill plume. This correlation extends the present correlations to high elevations at which no experimental data is available.
INTRODUCTION
Until recently, atrium smoke management systems were designed assuming that the fire would occur on the atrium floor. It was further assumed that sprinklers would limit the fire size and thus the smoke produced by fires in any compartments attached to the atrium. However, some North American standards and model codes call for consideration of smoke exiting from these attached compartments as balcony spill plumes (NFPA 2003; IBC 2003).
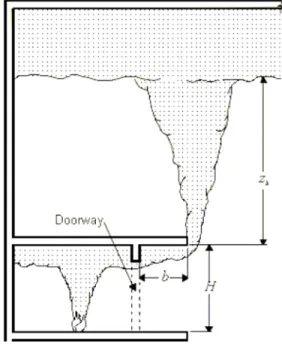
Atria with attached compartments are commonly found in office buildings and shopping malls. For a fire in an attached compartment that opens onto a balcony, smoke can flow out of the compartment, under the balcony and up through the atrium as a balcony spill plume (Figure 1). As this buoyant plume rises through the atrium, entrained air increases the mass flow rate of the plume. In order to design the atrium smoke management system to maintain a safe evacuation path, accurate calculation of the mass flow rate as a function of elevation is required.
The primary research conducted, as part of RP 1247, was a series of full-scale experiments which investigated smoke flow in balcony spill plumes and the resulting mechanical exhaust requirements for an atrium. Detailed results of the experimental studies are provided by Lougheed et al. 2006, Lougheed et al. 2007a and Lougheed et al. 2007b.
CFD modeling studies were undertaken to address two concerns with the experimental program: 1) the inability to fully investigate the effect of the parameters that affect air entrainment in the balcony area using full-scale experiments and 2) the limited distance (5-7 m) between the balcony and the ceiling. This distance exceeds the distance required in the initial request for proposals but does not span a representative range of North American atria elevations. To address these issues, an effort was made to verify a CFD model using NIST’s Fire Dynamic Simulator (FDS) software (McGrattan et al 2002a; 2002b) for determining smoke entrainment into a spill plume. Detailed results of the modeling study, which investigated smoke flow in the balcony area are provided by Ko (2006) and summarized in Ko et al. (2007).
There is a lack of full- or model-scale data for balcony spill plume mass flow rates at elevations greater than 9 m above the balcony (Harrison 2004). The CFD modeling study, which investigated the variation of plume mass flow rate with elevation in a simulated atrium, was used to extend the correlations to higher heights typical of modern North American atria. Previous research has demonstrated that CFD simulations
using FDS can accurately model buoyant plumes (Hadjisophocleous and McCartney 2005; Ma and Quintiere 2003). Results from the CFD model study were compared to existing engineering correlations. A new correlation was also developed for the variation in mass flow rate with elevation for a balcony spill plume. This correlation extends the present correlations to high elevations at which no experimental data is available.
Figure 1. Balcony spill plume schematic. EXPERIMENTAL STUDIES
There have been several experimental studies of balcony spill plumes. Most of these were conducted at the Building Research Establishment (BRE) in the UK using 1/10th scale models (Morgan and Marshall 1975; Morgan and Marshall 1979; Hansell et al. 1993; Marshall and Harrison 1996). Experiments were also conducted at the University of Canterbury, New Zealand using salt-water modeling (Yii 1998) and a 1/10th scale model similar to that used at BRE (Harrison 2004). Reviews of the physical model studies are provided by Harrison (2004) and Lougheed et al. (2006) and a brief summary is provided by Lougheed et al. (2007).
For RP-1247, a series of experiments were conducted using a fire compartment that was approximately the full-scale equivalent of the 1/10th scale physical model used in the earlier studies. A detailed discussion of the results of the full-scale experiments are provided by Lougheed et al. (2006) and summarized in Lougheed et al. (2007a; 2007b).
BALCONY SPILL PLUME CALCULATION METHODS
Existing balcony spill plume correlations are primarily based on data from one-tenth scale physical models of shopping mall atria (Morgan and Marshall 1975; Morgan and Marshall 1979; Hansell et al. 1993; Marshall and Harrison 1996). The physical model studies conducted by Morgan and Marshall (1975; 1979) were used to develop the BRE spill plume method. Data from these experiments were also used to develop a number of different algebraic correlations for balcony spill plume mass flow rates (Law 1986; Thomas 1987; Law 1995; Poreh et al. 1998; Thomas et al. 1998). Further information on the various methods used to estimate the mass flow rate in balcony spill plumes are provided by Morgan et al. (1999), Harrison (2004) and Lougheed et al. (2006).
The basic assumption in the methods for estimating the mass entrainment into a spill plume, including those developed by Law, is that it is analogous to a line plume. Based on this assumption, all the simplified equations for air entrainment into the rising plume vary linearly with the height of the plume above the balcony edge:
B Az
m&b = b+ (1)
where:
b
m& = mass flow rate at height zb (kg/s);
zb = height above the balcony (m);
A = linear coefficient for air entrainment in line plume (kg/s m);
B = coefficient defining initial conditions for line plume at balcony edge (kg/s).
The coefficients A and B are dependent on parameters such as fire size, opening width, balcony height and mass flow at the end of the balcony.
Law (1986) developed relationships for the coefficients A and B in terms of fire size, opening width and balcony height. The resulting equation was:
(
)
3 b p 1 2 c p b A Q W z B m& = & + (2) where: bm& = mass flow rate at height zb (kg/s);
c
W = length of the spill (m);
Q& = convective heat output (kW);
zb = height of plume above the balcony edge (m); Ap = linear coefficient for spill plume (kg/s kW1/3 m5/3); BBp = virtual origin term (kg/s).
Law (1986) used the results from the initial physical model experiments conducted at BRE (Morgan and Marshall 1975; Morgan and Marshall 1979) to determine a value for the linear coefficient and an estimate for the virtual origin based on the height of the balcony. Law (1995) slightly modified the estimate for both the linear coefficient and the virtual origin to derive the following relationship for the mass flow rate in a balcony spill plume using the experimental data provided by Hansell, Morgan and Marshall (1993):
(
)
( . ) .36Q W z 025H 0 m 2 13 b c b = & + & (3) where: bm& = mass flow rate at height zb (kg/s);
c
W = length of the spill (m); Q& = convective heat output (kW);
zb = height of plume above the balcony edge (m); H = height of the balcony (m).
Equation 3 is in the form used in CIBSE (1995), which was derived from Law (1995). The principle difference is that the total heat release rate was used in the algebraic relationship in Law (1995) as well as the earlier paper (Law 1986). The version provided in Equation 3 was developed assuming a radiative fraction of 0.35.
The equation in NFPA 92B (2005) was derived from the relationship given in Law (1995). However, the NFPA 92B equation is given in terms of the total heat release rate. If converted to the same form as Equation 3 assuming a radiative fraction of 0.35, the linear coefficient Ap = 0.41.
Several other algebraic relations for the mass flow rate in balcony spill plumes were developed. Morgan et al. (1999) noted four different methods for calculating smoke production rates developed at BRE: BRE spill plume method, Method by Thomas (1987), Method by Poreh et al. (1998) and Method by Thomas et al. (1998). All of these relationships have the same general form as Equation 2. The algebraic relationships developed at BRE assumed an infinite line plume in the atrium space. In some cases, additional terms were developed to include entrainment into the end of the plume.
Harrison (2004) also developed equations for the air entrainment into a balcony spill plume. The equations have a similar form to those developed by Poreh et al. (1998) and Thomas et al. (1998). However, the linear coefficient value of 0.2 is higher than that used in the earlier correlations (0.16). The linear coefficient developed in Harrison (2004) was determined by a fit to a set of physical model experiments and thus includes air entrainment into the end of the plume. The earlier correlations were
developed assuming an infinite line plume with an additional term used in some cases to estimate end entrainment.
The correlations developed by Harrison (2004) were based on physical model experiments with a downstand at the end of the balcony. The downstand depth was 0, 0.1 and 0.2 m for the 1/10th scale model. The linear portion of the equation is comparable to correlations used for line plumes (CIBSE 1995):
z L Q . ml l c 3 2 3 1 21 0 & & = (4) where: l
m& = mass flow rate for line plume at height z (kg/s);
c
Q& = convective heat release rate (kW);
Ll = length of longest side of rectangular source (m); z = height above the base of the fire (m).
In summary, the simplified methods for balcony spill plumes all assume a linear equation for the air entrainment with height above the balcony (Equation 1). However, two different approaches were used to determine the linear coefficient, Ap, and the virtual origin term, Bp.
1. Law (1985 and 1995) used a fit to experimental data to determine Ap and BBp.
2. The spill plume methods developed at BRE assumed a vertical infinite line plume in the atrium. Any additional entrainment at the end of the balcony was included in the virtual origin term.
MODELING THE SPILL PLUME
One concern with the experimental program was the limited distance (5-7 m) between the balcony and the maximum height of the smoke layer. This distance exceeds the distance required in the initial request for proposals. However, in comparison to scenarios in many North American atria, this distance was a concern.
To address this issue CFD modeling was undertaken using Fire Dynamic Simulator (FDS) software (McGrattan et al. 2002a; 2002b) to investigate the air entrainment in the far field. The CFD modeling was not required by the RFP and was conducted in addition to the primary work undertaken for the project.
The modeling study investigated three areas: 1) the compartment fire, 2) the full-scale experimental facility and 3) mass entrainment into the balcony spill plume in the far field. A detailed discussion of the CFD modeling is provided in McCartney (2006). In this paper, the modeling of the spill plume in the far field is discussed.
HIGH-ELEVATION ATRIUM CFD MODEL Model Description
A CFD model of a high-elevation atrium was developed to address limitations of the experimental facility. In particular, the limited height did not allow for investigations of air entrainment at heights in the far field (>20 m above the balcony edge).
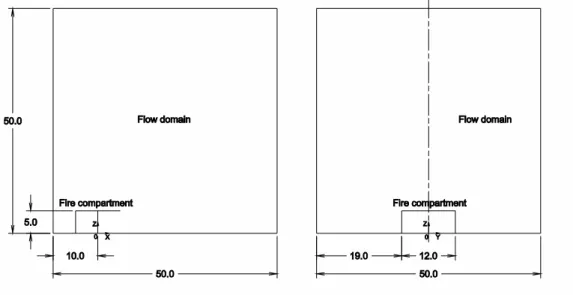
Figures 2 and 3 show the geometry of the high-elevation atrium CFD model. A 12 m wide by 5 m deep by 5 m high fire compartment similar to the experimental facility was located at floor level in a 50 m cubic atrium. The fire compartment opening was varied between 5 and 10 m. A 5 m wide balcony projected from the fire compartment. Variable height draft curtains were located at the edges of the fire compartment opening and ran the full depth of the balcony. A removable 1.5 m downstand (fascia) was located at the fire compartment opening.
All surfaces were specified as inert and all flow domain boundaries except for the floor were specified as open boundary conditions. No smoke layer formed in the atrium and the balcony spill plume was allowed to flow freely without interaction with atrium walls or an atrium smoke layer. This is in contrast to the experimental facility where the presence of an atrium ceiling allowed an atrium smoke layer to form. The mass flow rates in the spill plume were calculated across horizontal sections of the flow domain over its entire height at 0.5 m intervals.
The fire was modeled as a steady release of propane at the center of the fire compartment at floor elevation. One isometric computational mesh was defined over the entire flow domain. Simulation times of
300 s were chosen to achieve steady-state conditions. The fuel was specified as propane and a constant radiative fraction of 0.35 was used.
Figure 2. High-elevation atrium model geometry.
Figure 3. Fire compartment geometry. Grid Sensitivity Analysis
A grid sensitivity analysis was performed on the high-elevation atrium model with two objectives: to determine the most efficient grid size for a subsequent parametric study and to determine the atrium width and depth required to fully contain the balcony spill plume. The former ensures accuracy with minimal computational requirements and the latter prevents mass loss from the sides of the flow domain from affecting the vertical mass flow rate profiles.
For the grid sensitivity analysis simulations, a fire size of 2 000 kW and an opening width of 10 m were chosen as being in the middle of their respective ranges. The draft curtain and fascia depths were presumed not to affect the bulk plume flow as significantly as the other two parameters and were therefore ignored in the grid sensitivity analysis. The atrium height was reduced to 25 m to allow timely solution of the simulations with the smaller control volumes.
The accuracy of fire dynamics simulations depends primarily on the grid resolution around the fire and across plume boundaries. In particular, previous work by Hadjisophocleous and McCartney (2005) showed that accurate modeling of plume dynamics in atria requires control volume sizes in the range of 0.1 to 1.0 m. Various control volume sizes in this range were used in the grid sensitivity analysis.
Figure 4. Mass flow rate profile variation with grid size.
Figure 4 plots the mass flow rate versus elevation profiles from simulations using various control volume sizes. The mass flow rate data was averaged over the period t = 120 to 300 s. The 1 m control volume size profile shows duplicate data points since mass flow rates were measured at 0.5 m intervals. All three profiles exhibit a linear behaviour over the majority of the flow domain; the non-linearities near the top of the flow domain are discussed below. The 0.5 m profile is significantly different from the 1.0 m profile, indicating that 1.0 m is not a suitable choice for a grid-independent model. Since the profiles for control volume sizes of 0.25 and 0.5 m are very similar, a grid size of 0.5 m was chosen as the optimal grid size.
A flow domain area was required to allow the spill plume to be fully contained over the entire atrium elevation. Any loss of mass through the sides of the flow domain would generate errors in the mass flow rate profiles. Conversely, an overly large flow domain would affect simulation solution times. To choose the flow domain width and depth for the high-elevation atrium model, various simulations were performed with a 2 000 kW fire and a 10 m compartment opening using the optimal control volume size of 0.5 m. The velocity field at the four vertical flow domain boundaries was examined to estimate the amount of mass escaping from the flow domain sides. Although some mass transfer into the flow domain was expected to balance the balcony spill plume mass flow out of the flow domain top, significant outward mass flow across the vertical boundaries would indicate that the spill plume is exiting the flow domain. An arbitrary criterion of flow speed < -0.5 m/s everywhere along these four surfaces was chosen to represent minimal mass loss. Based on this criterion, a minimum atrium size of 50 m by 50 m was required to fully contain the spill plume. This atrium size was maintained for all simulations.
The grid sensitivity analysis yielded a model with a 50 m by 50 m by 50 m flow domain and a control volume size of 0.5 m for a total of 106 control volumes. These simulations took an average of 12.11 h to solve a simulation time of 300 s for an average efficiency ratio of 1:145.
Parametric Study
The objective of the CFD modeling study was to obtain balcony spill plume mass flow rate data for various combinations of fire size and fire compartment geometry. A parametric study based on the high-elevation atrium CFD model was conducted using the same parameters as the experimental program: fire size, compartment opening width, draft curtain depth and fascia depth. Table 1 lists the parameter values used in the parametric study.
Table 1. Parametric study parameter values.
Fire Size Opening Width Draft Curtain Depth Downstand Depth
(kW) (m) (m) (m)
1000 5.0 0.0 0.0 2000 8.0 2.0 1.5 5000 10.0
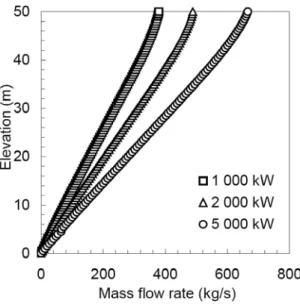
Each simulation in the parametric study produced a vertical mass flow rate profile based on mass flow rate data averaged over the period t = 120 to 300 s. Figure 5 shows the mass flow rate profiles for selected simulations. The profiles vary linearly with elevation, a characteristic of buoyant line plumes, which is supported by both fundamental dimensional analyses and experimental work (Heskestad 2002). This supports the conclusion that the modeling results accurately model plume dynamics.
The mass flow rate trends in Figure 5 are nonlinear near the top of the flow domain. These nonlinearities were found in all simulations and extended further into the flow domain for larger control volumes. This nonlinear behaviour is attributed to the propagation of the open boundary condition at the top of the atrium into the flow domain. The zero pressure requirements at the boundary forces the flow within the domain to change. In reality, a small pressure difference due to buoyancy would be present at the top of the atrium. This is considered a modeling error that does not affect the flow dynamics in the rest of the flow domain. These nonlinearities were not due to mass escaping the flow domain near its top since flow speeds at the flow domain boundaries under 0.5 m/s were verified for each simulation.
Figure 5. Mass flow rate profile variation with fire size.
Two expressions for the mass flow rate of a buoyant spill plume were selected for comparison with the mass flow rate profiles from the parametric study: The NFPA 92B equation (2005) and a buoyant line plume expression based on a relationship in CIBSE (1995) for line plumes originating on the floor of the atrium (Equation 4). The line plume approximation was in the form:
(
)
3 b o 1 2 c b 02Q W z m m& = . & + (5) where: bc
Q& = convective heat output (kW); W = length of the spill (m);
zb = height of plume above the balcony edge (m);
o
m& = initial mass flow (kg/s).
The balcony spill plume relationship used in NFPA 92B (2005) is given by:
(
Q W)
(
z 025H 41 0 m 2 13 b c b= . & + . &)
(6) where: bm& = mass flow entering the smoke layer at height zb (kg/s);
c
W = length of the spill (m); Q& = convective heat output (kW);
H = height of balcony above the base of the fire (m); zb = height of plume above the balcony edge (m);
The two equations are in the same general form. Both mass flow rate expressions predict that the plume mass flow rate varies linearly with elevation and they both include an initial mass term.
The mass flow profiles from the parametric study were fitted using linear regression to curves of the form: o b f b k z m m& = + & (7) where: b
m& = mass flow in the balcony spill plume at height zb (kg/s); zb = height of plume above the balcony edge (m);
kf = proportionality constant (kg/s m);
o
m& = initial mass flow (kg/s).
Steady state data was obtained by averaging the mass flow rate data over the period t = 120 to 300 s. Non-linear data at the top of the flow domain and near the balcony was removed by considering only data between z = 15 and 35 m. These subsets yielded linear regressions with minimum R2 values of 0.999. Table 2 lists the linear regression parameters for selected simulations from the parametric study. The linear coefficients and initial mass estimated using the NFPA 92B and line plume relationships are also shown in Table 2. The initial mass flow determined by the fit to the CFD profiles is used for the line plume. There is no direct method of estimating the initial mass flow or virtual origin term for the line plume equation based on the present CFD results. The initial mass flow rate estimated using the CFD calculations were used to provide a basis for initial comparison of the three equations. For actual applications, a more conservative method of estimating the initial mass flow rate at the balcony based on the height of the balcony is recommended.
Table 2. Linear regression parameters.
CFD NFPA 92B Line Plume
Fire Size Opening kf m0 kNFPA m0NFPA kLine m0Line
Width (kW) (m) (kg/s m) (kg/s) (kg/s m) (kg/s) (kg/s m) (kg/s) 1000 5 7.1 19.2 10.5 13.2 5.2 19.2 2000 5 9.0 25.3 13.3 16.6 6.5 25.3 5000 5 12.9 45.9 18.0 22.5 8.9 45.9 1000 8 7.9 26.2 14.4 18.0 7.1 26.2 2000 8 10.0 33.1 18.1 22.7 9.0 33.1 5000 8 13.2 53.1 24.6 30.8 12.1 53.1 1000 10 8.2 32.2 16.7 20.9 8.2 32.2
2000 10 10.7 42.2 21.0 26.3 10.4 42.2 5000 10 14.4 53.1 28.6 35.7 14.1 53.1
The linear coefficients estimated from the CFD simulations, kf, are consistently smaller than those determined using the NFPA equation. Specifically, the average ratio of kf/kNFPA is 0.57 for the 9 cases shown in Table 2. This indicates that the NFPA 92B equation l predicts higher entrainment rates in the far field than was determined from the CFD profiles. This is consistent with CFD modeling results used to design smoke management systems (Philips and Sinclair 2005).
The CFD simulations predict a proportionality constant, kCFD, higher than that predicted by the buoyant line plume expression, kLine. The ratio kCFD/kLine varies with the opening width: for simulations with opening widths of 5, 8 and 10 m this ratio is 1.41, 1.11 and 1.02, respectively. This indicates that the buoyant line plume expression more accurately describes the mass flow rate profile from the CFD simulations as the compartment opening width increases. Wider opening widths produce a wider plume, which more closely resembles a buoyant line plume. Narrower compartment opening produce a narrower spill plume, which more closely resembles an axisymmetric plume. Also, rectangular plumes will evolve into axisymmetric plumes with air entrainment as the plume rises (Quintiere and Grove 1998). This transformation will occur at lower heights for plumes with small aspect ratios (length/width). Axisymmetric plumes have a higher entrainment rate than an equivalent buoyant line plume.
Based on the parametric study data, a correlation for the balcony spill plume which provides the best fit for the scenarios, was developed:
o b 5 1 3 1 c b 059Q W z m
m& = . & + & (8) where:
b
m& = mass flow in the balcony spill plume at height zb (kg/s);
c
Q& = convective heat output (kW); W = length of the spill (m);
zb = height of plume above the balcony edge (m);
o
m& = initial mass flow (kg/s).
COMPARISON WITH SPILL PLUME RELATIONSHIPS
Figures 6 and 7 show a comparison of the mass flow rate determined using Equation 8 with that determined using the NFPA 92B relationship and the line plume approximation for a 2000 kW fire with 5 and 10 m opening widths, respectively.
Height (m) 0 10 20 30 40 50 Ma s s F lo w ( k g /s ) 0 250 500 750 1000 1250 1500 NFPA 92B Line Plume New Correlation
Figure 6. Spill plume mass flow rate for 2000 kW fire and 5 m opening.
In the far field, the estimated mass flow rates determined using the line plume relationship are typically 50-52% lower than the mass flows estimated using the NFPA 92B relationship. This difference is primarily due to the difference in the linear coefficient used for the two relationships. The initial mass flow used for
the line plume calculations is higher than those used for the NFPA 92B equation. However, the initial condition has a negligible effect at higher heights.
Height (m) 0 10 20 30 40 50 Ma s s F lo w ( k g /s ) 0 250 500 750 1000 1250 1500 NFPA 92B Line Plume New Correlation
Figure 7. Spill plume mass flow rate for 2000 kW fire and 10 m opening.
The difference between the mass flows determined using Equation 8 and using the NFPA 92B equation depends on the opening width. For the 5 m opening, the mass flow rate determined using Equation 8 are approximately 70% of the flows determined using the NFPA relationship. For the 10 m opening, the mass flows determined using Equation 8 are comparable to those determined using the line plume approximation.
The line plume equation given by Equation 5 is similar, in principle, to the BRE spill plume method and the simplified relationships developed by Poreh et al. (1998), Thomas et al. (1998) and Harrison (2004). For these approaches, it was assumed that air entrainment into a balcony spill plume in the atrium could be estimated assuming a vertical line plume. Various methods were developed to determine the initial mass flow at the balcony edge.
The comparisons of the line plume estimates with the CFD profiles indicate that this approach provides better estimates as the opening width increases. However, it does underestimate the air entrainment for the 5 m opening.
For high heights, the initial mass term in Equations 5 and 8 are negligible compared to the mass entrainment in the atrium space. Comparing the first terms in the two equations, the ratio of the far field mass flow determined using Equation 8 to that determined using the line plume equation is given by:
2 1 bLine bNew W 95 2 m m ≈ . & & (9) where: bNew
m& = mass flow entering the smoke layer at height zb determined using Equation 8 (kg/s);
bLine
m& = mass flow entering the smoke layer at height zb determined using Equation 5 (kg/s);
W = width of the spill (m);
Equation 8 was developed based on a best fit to the CFD simulations with maximum plume widths of 10 m. The results using this relationship are comparable to those determined using the line plume approach for the 10 m plume width. However, it estimates higher mass flows for the 5 and 8 m plume widths and will produce lower mass flow rates for plume widths > 10 m than the line plume method. For the narrow plume widths, the mass flows determined using Equation 8 are considerably less than those determined using the NFPA 92B relationship in the far field. This relationship may provide a better approach to estimating the air entrainment for the balcony spill plume at higher heights for narrow plume widths (< 10 m). However, the line plume equation would provide a more conservative estimate for plume widths > 10 m.
A detailed analysis of the initial mass flow, , is not possible using the CFD modeling study due to poor resolution of the flow under the balcony. However, at high elevations, the air entrainment in the atrium is much greater than the initial mass flow at the balcony edge. The results of the research on the mass entrainment in the balcony area by Ko (2006) can be used to estimate the initial mass flow for use with Equations 5 and 9.
o
m
&
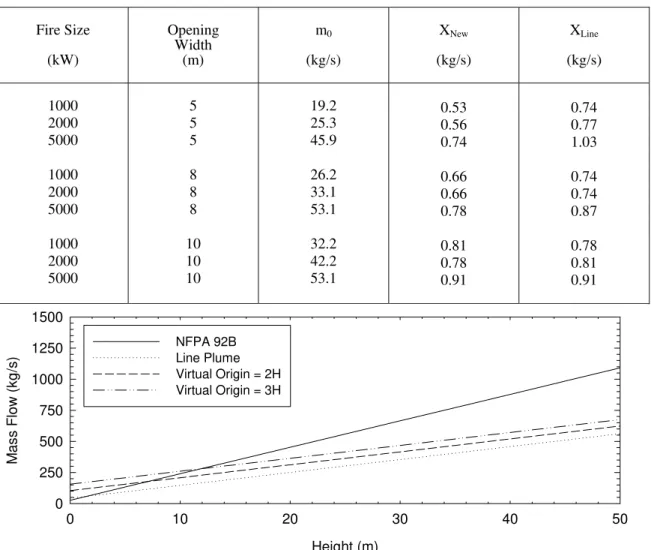
The initial mass flows determined using the CFD simulations for the far field can be used to estimate an approximate virtual origin term for Equations 5 and 8 related to the balcony height (i.e., the multiplication factors XNew and XLine for the balcony height which would put the equations in the same form as Equation 6). The results are shown in Table 3.
For the line plume, the multiplication factor, XLine, are in the range of 0.74 to 1.03. This indicates that the virtual origin for the line plume equation is at or near the floor of the atrium.
Table 3. Approximate height of virtual origin.
Fire Size Opening m0 XNew XL nei
Width (kW) (m) (kg/s) (kg/s) (kg/s) 1000 5 19.2 0.53 0.74 2000 5 25.3 0.56 0.77 5000 5 45.9 0.74 1.03 1000 8 26.2 0.66 0.74 2000 8 33.1 0.66 0.74 5000 8 53.1 0.78 0.87 1000 10 32.2 0.81 0.78 2000 10 42.2 0.78 0.81 5000 10 53.1 0.91 0.91 Height (m) 0 10 20 30 40 50 M a ss F lo w (k g /s ) 0 250 500 750 1000 1250 1500 NFPA 92B Line Plume Virtual Origin = 2H Virtual Origin = 3H
Figure 8. Comparison of line plumes with different virtual origins.
For the new correlation (Equation 8), the multiplication factor is in the range of 0.53 to 0.91. This indicates that the virtual origin is between the mid-height and the full-height of the balcony.
As noted in the previous section, the estimated mass flow rate at high heights is primarily due to air entrainment in the atrium. As such, conservative estimates for the multiplication factors could be used with limited effect on the mass flow estimates in the far field. Figure 8 shows the mass flow rate estimated using the line plume equation for a scenario with a 2000 kW fire size and a 10 m plume width. The plots shown include the line plume assuming the initial mass flow at the balcony edge estimated using the CFD simulation as well as assuming virtual origins at 2H and 3H. The mass flow rate estimated using the
NFPA 92B relationship is also shown. (Note: Mass flow rates estimated using Equation 8 are not shown. However, they are equivalent to the line plume estimate using the equivalent virtual origin.) The results indicate that it may be possible to determine conservative estimates for the initial mass flow, which would have minimal effect on the estimates in the far field.
CONCLUSIONS
There have been a number of concerns regarding the balcony spill plume equation provided in North American standards and codes. These include: lack of verification by full-scale experiments and application of the equation for high atria even though it was developed for low-height atria. As a result of these concerns, ASHRAE initiated a project to evaluate the balcony spill plume equation used in North American codes and standards (RP-1247). The research project included CFD modeling studies to investigate smoke entrainment in the balcony area and smoke entrainment in high atria.
The height of the simulated atrium space used in the full-scale experiments was limited. A second modeling study was used to investigate air entrainment at higher heights (the far field).
A series of CFD simulations were conducted using different fire sizes and widths of the plume in the atrium. The results of the simulations were used to determine the mass flow profiles in the simulated atrium. The results were compared with the mass flow rates estimated using the NFPA 92B equation for the spill plume. The results indicated that the estimates determined using the algebraic equation were higher than those determined using the CFD model.
Alternative relationships for the air entrainment into the spill plume were also evaluated: 1) an equation based on the best fit to the CFD profiles and 2) an equation assuming the plume was a vertical line plume with a virtual origin located below the balcony edge. The line plume equation is similar to the balcony spill plume equation developed at BRE and by others.
The mass flow rates in the far field estimated using the line plume equation are lower than those estimated using the correlation developed using the CFD simulations for small plume widths (< 10 m). This is likely due to the transformation of the initial rectangular plume into an axisymmetric plume at higher elevations resulting in increased air entrainment. Conversely, the air entrainment estimated using the line plume is higher for wider plumes (> 10 m).
The CFD simulations did not provide accurate estimates for the initial mass flow at the balcony edge. It may be possible to use the correlations developed for the air entrainment under the balcony and in the rotation area at the balcony edge to determine the initial mass flow rate, then use this value in the algebraic relationships for estimating the mass flow rate in the far field. However, a sensitivity analysis indicated the total mass flow in the far field is not sensitive to the initial mass flow rate at the balcony edge. The results of this analysis indicated that a virtual origin at floor height or up to 3 times the height of the balcony below the balcony edge could be used to provide conservative estimates for the mass flow rate in the far field. REFERENCES
Hadjisophocleous, G. V. and McCartney, C. J. 2005. Guidelines for the use of CFD simulations for fire and smoke modeling, ASHRAE Transactions, 111 (Part 1).
Hansell, G.O., Morgan, H.P. and Marshall, N.R. 1993. Smoke flow experiments in a model atrium. BRE Occasional Paper OP55, Borehamwood, UK: Building Research Establishment.
Harrison, R. 2004. Smoke Control in Atrium Buildings: A Study of the Thermal Spill Plume, Fire Engineering Research Report 04/1, Christchurch, NZ: University of Canterbury.
Heskestad, G. 2002. Fire plumes, flame height, and air entrainment, The SPFE Handbook of Fire Protection Engineering (3rd ed.), p. 2-1 – 2-17, Bethesda, MD: Society of Fire Protection Engineers.
IBC. 2003. International Building Code. Falls Church, VA: International Code Council, Inc.
Ko, Y.J. 2006. CFD Study of the Balcony Spill Plume: Focused on the Balcony Area, Master of Engineering in Civil Engineering Thesis, Ottawa, ON: Carleton University.
Ko, Y.J., Hadjisophocleous, G. and Lougheed, G. 2007. CFD Study of the Air Entrainment of Balcony Spill Plumes at the Balcony Edge, ASHRAE Transactions, to be published.
Law, M. 1986. A Note on Smoke Plumes from Fires in Multi-Level Shopping Malls, Fire Safety Journal, 10, p. 197-202.
Law, M. 1995. Measurements of balcony smoke flow, Fire Safety Journal, 24, p. 189-195.
Lougheed, G.D., McCartney, C.J and Gibbs, E. 2006. Balcony Spill Plumes, Final Report Research Project 1247, Ottawa, Ontario: National Research Council.
Lougheed, G.D., McCartney, C.J. and Gibbs, E. 2007a. Balcony Spill Plumes: Full-Scale Experiments, Part 1, ASHRAE Transactions, to be published.
Lougheed, G.D., Gibbs, E. and McCartney, C.J. 2007b. Balcony Spill Plumes: Full-Scale Experiments, Part 2, ASHRAE Transactions, to be published.
Ma. T.G. and Quintiere, J.G. 2003. Numerical simulation of axi-symmetric fire plumes: accuracy and limitations, Fire Safety Journal, Volume 38, p. 467-492.
Marshall N. R. and Harrison R. 1996. Experimental studies of thermal spill plumes. Building Research Establishment Occasional Paper, OP1, Borehamwood, UK: Building Research Establishment.
McCartney, C. 2006. CFD Investigation of Balcony Spill Plumes, Master of Applied Science in Mechanical Engineering Thesis, Waterloo, ON: University of Waterloo.
McGrattan, K.B., Baum, H.R., Rehm, R.G., Hammins, A., Forney, G.P. and Prasad, K. 2002a. Fire Dynamics Simulator (Version 3) – Technical Reference Guide, NISTIR 6783, Gaithersburg, MD: National Institute of Standards and Technology.
McGrattan, K.B., Forney, G.P., Floyd, F.E., Hostika, S. and Prasad, K. 2002b. Fire Dynamics Simulator (Version 3) – User Guide, NISTIR 6784, Gaithersburg, MD: National Institute of Standards and Technology.
Morgan, H.P., Ghosh, B.K., Garrard, G., Pamlitschka, R., De Smedt, J-C and Schoonbaert, L.R. 1999. Design Methodologies for Smoke and Heat Exhaust Ventilation, London, UK: Construction Research Communications Ltd.
Morgan, H.P. and Marshall, N.R. 1975. Smoke Hazards In Covered, Multi-Level Shopping Malls: an experimental-based theory for smoke production, BRE CP48/75, Borehamwood, UK: Building Research Establishment.
Morgan, H.P. and Marshall, N.R. 1979. Smoke control measures in a covered two storey shopping mall having balconies as pedestrian walk ways, BRE CP11/79, Borehamwood, UK: Building Research Establishment.
NFPA. 2003. NFPA 101, Life Safety Code, Quincy, MA: National Fire Protection Association.
NFPA. 2005. NFPA 92B, Standard for Smoke Management Systems in Malls, Atria and Large Spaces, Quincy, MA: National Fire Protection Association.
Phillips, D.A. and Sinclair, R. 2005. Reducing Exhaust Quantities for Atrium Smoke Control, ASHRAE Transactions, 111, Part 2, p. .
Poreh, M., Morgan, H.P., Marshall, N.R. and Harrison, R. 1998. Entrainment by two dimensional spill plumes in malls and atria, Fire Safety Journal, 30, p. 1-19.
Quintiere, J. and Grove, B.S. 1998. Correlations for fire plumes, NIST-GCR-98-744, Gaithersburg, MD: National Institute for Science and Technology.
Thomas, P.H. 1987. On the upward movement of smoke and related shopping mall problems, Fire Safety Journal, 12, p. 191-203.
Thomas, P.H., Morgan, H.P., Marshall, N.R. 1998. The spill plume in smoke control design, Fire Safety Journal, 30, p. 21-46.
Yii, E. H. 1998. Exploratory salt water experiments of balcony spill plume using laserinduced fluorescence technique. Fire Engineering Research Report, Christchurch, NZ: University of Canterbury.