Boosting (In)direct Detection of Dark Matter
byLina Necib
Submitted to the Department of Physics
in partial fulfillment of the requirements for the degree of Doctor of Philosophy
at the
MASSACHUSETTS INSTITUTE OF TECHNOLOGY
June 2017
@
Massachusetts Institute of Technology 2017. All rights reserved.Author
....
Signature redacted
Department of Physics
May 19, 2017
Certified by...
Signature redacted
Jesse Thaler
Associate Professor
Thesis Supervisor
Accepted by .... MAS ITUTEJUN
2
7
2017
Nergis Mavalvala
Associate Department Head of Physics
(0 LU
Boosting (In)direct Detection of Dark Matter
by
Lina Necib
Submitted to the Department of Physics on May 19, 2017, in partial fulfillment of the
requirements for the degree of Doctor of Philosophy
Abstract
In this thesis, I study the expected direct and indirect detection signals of dark matter. More precisely, I study three aspects of dark matter; I use hydrodynamic simulations to extract properties of weakly interacting dark matter that are relevant for both direct and indirect detection signals, and construct viable dark matter models with interesting experimental signatures. First, I analyze the full scale Illustris simulation, and find that Galactic indirect detection signals are expected to be largely symmetric, while extragalactic signals are not, due to recent mergers and the presence of substruc-ture. Second, through the study of the high resolution Milky Way simulation Eris, I find that metal-poor halo stars can be used as tracers for the dark matter velocity distribution. I use the Sloan Digital Sky Survey to obtain the first empirical velocity distribution of dark matter, which weakens the expected direct detection limits by up to an order of magnitude at masses
<
10 GeV. Finally, I expand the weaklyinter-acting dark matter paradigm by proposing a new dark matter model called boosted dark matter. This novel scenario contains a relativistic component with interesting hybrid direct and indirect detection signatures at neutrino experiments. I propose two search strategies for boosted dark matter, at Cherenkov-based experiments and future liquid-argon neutrino detectors.
Thesis Supervisor: Jesse Thaler Title: Associate Professor
Acknowledgments
I am very grateful to my amazing family: Sonia Bouzgarrou and Mohamed, Nada,
Abdelkarim and Yasmine Necib for their unconditional support, even when they told their friends I had a "desk job at a university," and could not understand why I had not discovered dark matter yet. I am so thankful to my partner and best friend George Brova for his love and kindness, no matter how far apart we are, for teaching me how to code, and for just making every day better, easier, and happier.
I would like to thank my incredible experimentalist friends Sylvia Lewin, Alex
Leder, Gabriel Collins, Nancy Aggrawal, and Amy Chell, for always being there for me, no matter what time of day or night it was, and for watching over me when life got too stressful. I am really thankful to my amazing fourth floor CTP friends Sarah Geller, Jasmine Brewer, Hongwan Liu, and Andrew Turner for making me look forward to coming to work every single day this past year, for being so kind, and making me feel like I belong here. I am also thankful to my CTP friends Nick Rodd, Gherardo Vita, Patrick Fitzpatrick, Kiaran Dave, Nikhil Raghuram, Dan Kolodru-betz, and Zachary Thomas, for making me feel part of a group, teaching me physics, and simply adding joy to the halls of the CTP. MIT is a wonderful place because of them, and I am saddened by the thought of leaving. I would also like to thank my amazing friend and housemate Alex Ji for being my unofficial astrophysics advisor, and helping me delve into this fascinating new area. I am more than lucky to have been surrounded by this amazing group of people.
While at MIT, I had the privilege of working with great collaborators. In partic-ular, I would like to thank Kaustubh Agashe, Nicolas Bernal, Yanou Cui, Frederic Dreyer, Nayara Fonseca, Jonah Herzog-Arbeitman, Gordan Krnjaic, Piero Madau, Pedro Machado, Siddharth Mishra-Sharma, Jarrett Moon, Ben Safdi, Paul Torrey, Mark Vogelsberger, Taritree Wongjirad, and Jesus Zavala. I am also grateful to my undergraduate advisor Ken Lane for his endless support and kindness over the years.
I would also like to thank in particular the brilliant female physicists, Tracy
opportu-nity to work, and who have been exceptional role models in the early stages of my career.
Also, I will be always grateful to my officemate and great friend Ian Moult, for spending day and night in our office teaching me physics, getting me cookies when I needed them, keeping me afloat when everything was beyond stressful, and making our office the great place that it was.
Finally, I am certain that I would not have become the physicist I am today if it was not for my astounding advisor Jesse Thaler, whom I thank for his ubiquitous presence, the preponderance of hours he spent teaching me how to do research, how to give a presentation, how to write papers, and how to stay sane, for which I am eternally grateful.
Contents
1 Introduction 1.1 Dark Matter . . . . 1.1.1 Introduction . . . . 1.1.2 Simulations . . . . 1.1.3 WIMP Freeze-Out . . . . 1.2 Spherical Cows of Dark Matter Indirect Detection . . . .1.3 Empirical Determination of Dark Matter Velocity Using S tars . . . . 1.4 Boosted Dark Matter . . . .
1.5 Additional Topics . . . .
2 Spherical Cows of Dark Matter
2.1 Introduction . . . . 2.2 Methodology . . . . 2.2.1 Illustris Simulation . . . . 2.2.2 Computing J-factors . . . . 2.2.3 Asymmetry Parameterization . . . . 2.3 Galactic Analysis . . . .
2.3.1 Observed Axis Ratio . . . .. . .
2.3.2 Quadrant Analysis . . . .
2.3.3 Correlation with Baryon Disk . . . . 2.3.4 Milky-Way-like Halos . . . . 2.4 Extragalactic Analysis . . . . Metal Poor 21 21 21 22 23 24 25 26 27 31 31 33 33 34 36 38 39 40 42 43 45
2.4.1 Axis Ratio . . . . 2.4.2 Quadrant Analysis . . . . 2.4.3 Correlation with Baryon Disk 2.4.4 Halo Mergers
/
Subhalos2.5 Comparison to Photon Data...
2.5.1 Fermi data . . . .
2.5.2 Cluster Data . . . .
2.6 Conclusions . . . .
3 Empirical Determination of Dark
Poor Stars
3.1 Introduction . . . .
3.2 The Eris Simulation . . . . 3.3 Stellar Tracers for Dark Matter
3.4 Empirical Velocity Distribution.
3.5 Conclusions . . . .
Matter Velocities using
Metal-57 . . . . 5 7 . . . . 59 . . . . 6 0 . . . . 6 3 . . . . 6 5 4 (In)Direct Detection of Boosted Dark Matter 4.1 Introduction . . . . 4.2 Two Component Dark Matter . . . . 4.3 Thermal Relic Abundances and Present-Day Annihilation. 4.4 Detecting Boosted Dark Matter . . . . 4.4.1 Flux of Boosted Dark Matter . . . .. . . . 4.4.2 Detection of Boosted Dark Matter . . . . 4.4.3 Backgrounds to Boosted Dark Matter . . . . 4.4.4 Impact of Earth Attenuation . . . . 4.5 Detection Prospects for Present and Future Experiments . 4.5.1 Event Selection . . . . 4.5.2 Signal Rates . . . . 4.5.3 Background Rates . . . . 4.5.4 Estimated Experiment Reach . . . . . . . . 4 5 . . . . 4 7 . . . . 4 8 . . . . 4 8 . . . . 4 9 . . . . 5 0 . . . . 5 2 . . . . 5 4 67 67 . . . . 71 . . . . 73 . . . . 76 . . . . 77 . . . . 79 . . . . 83 . . . . 87 . . . . 90 . . . . 91 . . . . 93 . . . . 95 . . . . 97
4.6 Summary of Existing Constraints . . . . 4.7 Conclusions and Other Possibilities . . . .
5 Extending Boosted Dark Matter to DUNE 5.1 Introduction . . . .
5.2 Boosted Dark Matter . . . .
5.2.1 Features of Boosted Dark Matter
5.2.2 Flux of Boosted Dark Matter from
5.2.3 Implications of Forward Scattering 5.2.4 Constant Amplitude Limit . . . .
5.3 Event Selection . . . .
5.3.1 Cherenkov Detectors: Super-K .
5.3.2 Argon-Based Detectors: DUNE
5.3.3 Detector summary . . . . 5.4 Background Modeling . . . . 5.4.1 Cherenkov Detectors . . . . 5.4.2 LArTPC Detectors . . . .
5.5 Reach at neutrino experiments . . . .
5.6 Dwarf Spheroidal Analysis . . . .
5.6.1 J-factor of Dwarf Galaxies . . . . 5.6.2 Event Reach . . . .
Annihilation
5.7 C onclusions . . . .
6 Conclusions
A Spherical Cows
A.1 Analysis of Decaying Dark Matter . . . . A.1.1 Galactic Analysis . . . .
A.1.2 Extragalactic Analysis . . . .
A.2 Mass Correlation . . . . A.3 Comparison of Asymmetry Parameterization to Axis Ratio . . . . .
99 103 107 107 109 109 110 112 114 115 115 116 117 118 118 119 121 122 123 124 125 129 131 131 131 131 132 133
B Boosted Dark Matter 137
B.1 Analytic Approximations to Relic Abundances . . . . 137
B.2 Direct Detection of Non-Boosted DM . . . . 140
B.3 Boosted DM Scattering Off Hadrons . . . . 143
B.3.1 Elastic Scattering Off Hadrons . . . . 143
B.3.2 Deep Inelastic Scattering Off Hadrons . . . . 145
B.4 Understanding Forward Scattering . . . . 146
List of Figures
1-1 Evolution of the abundance of a WIMP DM x of mass mX = 20 GeV, and an annihilation cross section to SM of o- = 5 x 10-26 cm3/s. . . . 23
2-1 Logarithmic map for DM annihilation for halo labeled "0" in the Illustris-1 simulation. Lighter colors signify higher DM luminosity. We used HEALPix with nside = 16 (see Eq. 2.4). This map is taken by posi-tioning the observer at 8.5 kpc from the center of the halo. The mass of this halo is 3.2 x 101 4M . . . . . 36
2-2 Histogram of the conventional 2-dimensional axis ratio (left) and the newly defined observed axis ratio (right) for annihilation and decay, comparing both Illustris-1 and Illustris-1-Dark (see Eq. 2.6). . . . . 39
2-3 The distribution of the asymmetry parameters Ropp (left) and Radj
(right) for DM annihilation as observed from a point 8.5 kpc from the halo center, in halos taken from the DM-only and DM+baryon simulations of Illustris-1. J-factors are computed over all halos (blue) as well as when omitting the inner 100 disk (red), and through the inner 30' only (green). All regions are centered on the halo center. The inset shows a zoom-in of the region of small Rpp/Radj. . . . . . . 40
2-4 Histogram of the angle between the minor axis of the DM halo and the angular momentum vector of the star forming gas. The minor axis is the eigenvector corresponding to the smallest eigenvalue of the inertia tensor found from regular projection (Eq. 2.5) or the weighed inertia tensor (Eq. 2.6) in the case of annihilation and decay. N is the mean of the distribution (a flat distribution in cos 0). . . . . 43
2-5 Histogram of the observed axis ratio for annihilation and decay of MW-like halos as defined by the requirements in Eqs. 2.11 and 2.12. The distribution of the MW-like halos is shown in solid lines while the distribution of rotated halos to increase statistics in shown in dotted lin es. . . . . 44
2-6 Histogram of the observed axis ratio for annihilation and decay for extragalactic sources, comparing both Illustris-1 and Illustris-1-Dark (see E q. 2.6). . . . . 46
2-7 The distribution of the asymmetry parameters Ropp (left) and Radj
(right) for DM annihilation as observed from a point outside the halo, taken from DM-only and DM+baryons simulations. J-factors are com-puted over all halos (blue) and through the inner 5' only (green). . .' 46
2-8 Histogram of the angle between the minor axis of the DM halo for the case of extragalactic signals and the angular momentum vector of the star forming gas. The minor axis is the eigenvector corresponding to the lowest eigenvalue of the inertia tensor found from regular pro-jection (Eq. 2.5) or the weighed inertia tensor (Eq. 2.6) in the case of annihilation and decay. N is the mean of the distribution (a flat distribution in cos0). . . . . 47
2-9 Logarithmic map for DM annihilation for halo labeled "499" in the Illustris-1 simulation from the point of view of an observer external to the halo. We used HEALPix with nside = 512 (see Eq. 2.4). The
observer is located at a distance 2R200 = 478 kpc of the center. The
2-10 Histogram of the newly defined observed axis ratio for annihilation and decay for extragalactic sources, comparing both 1 and
Illustris-1-Dark (see Eq. 2.6) after having omitted the "merger" halos (see text). 50
2-11 Histogram of the observed axis ratio for annihilation and decay of DM in MW-like halos as defined by the requirements in Eqs. 2.11 and 2.12. We also show the histograms of the distribution of gas and stars, computed in similar manner as DM decay. We finally show the axis ratio of the Fermi background data, as well as the residual Fermi signal as discussed in Sec. 2.5.1. . . . . 52
2-12 Histogram of the observed axis ratio for annihilation and decay of DM in cluster-like halos with masses larger than 2 x 10¹² M. We also show
the histograms of the distribution of stars, computed in similar manner as DM decay signals. We finally show the axis ratio of the X-ray data. In order to make a fair comparison, we show in blue (red) arrows the location of the annihilation (decay) axis ratio of the clusters that match in mass those observed, with a cut of M > 5 x 10¹³MO. We find 22 our of 352 halos that satisfy that criteria. . . . . 53
3-1 The density distribution as a function of Galactocentric radius for the dark matter (black) and all stars (blue) in ERIS. The distributions for subsamples of stars with [a-/Fe] > 0.2 and [Fe/H] < -1, -2, -3 are also shown (dotted brown, dashed red, and solid orange, respectively). The density of the most metal-poor stellar population exhibits the same dependence on radius as the dark matter near the Sun's position,
3-2 Distributions of the three separate velocity components of the DM
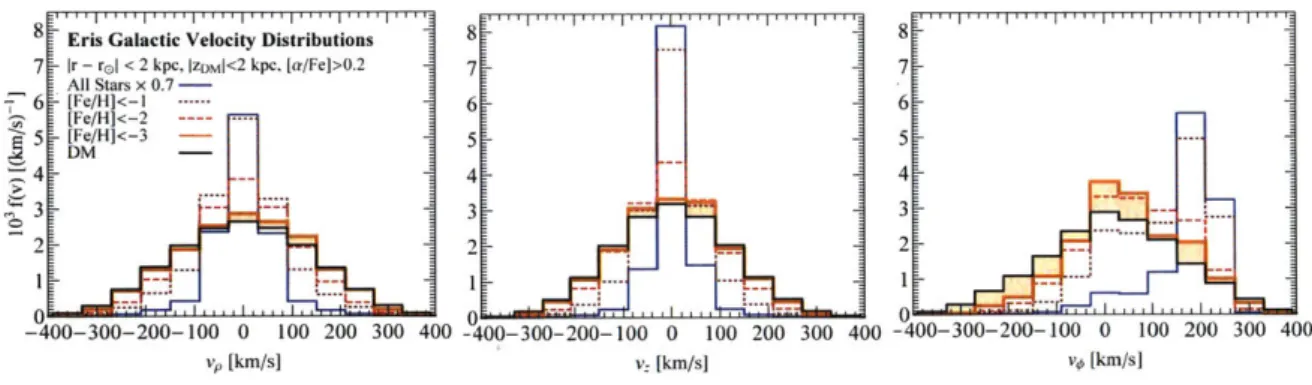
(solid black) and stars in ERIs. The velocities are in the galactocentric frame, where the z-axis is oriented along the stellar angular momen-tum vector. The stellar distributions are shown separately for differ-ent metallicities, with [a/Fe] > 0.2 and iron abundance varying from [Fe/H] < -1 (dotted brown) to [Fe/H] < -3 (solid orange). The dis-tribution for all stars-dominated primarily by the disk-is also shown (solid blue). All distributions are shown for Ir - r < 2 kpc; the DM is additionally required to lie within 2 kpc of the plane. To guide the eye, the orange shading highlights the differences between the DM and [Fe/H] < -3 distributions. The discrepancy in the vo distributions
is due to the preferential disruption of subhalos on prograde orbits in ERIS; observations of the Milky Way halo do not see such pronounced prograde rotation [1, 2]. . . . . 61
3-3 Galactocentric speed distribution for SDSS inner-halo stars (solid blue),
generated from Eq. 3.1. For comparison, we show the Standard Halo Model (dashed red), and the dark matter speed distributions in the ERIS (dot-dashed black) and ERISDARK halos (dot-dashed gray). The inset shows the expected background-free 95% C.L. limit on the DM spin-independent scattering cross section, assuming the exposure and energy threshold of the LUX experiment [3] for the SDSS and SHM velocity distributions. . . . . 64
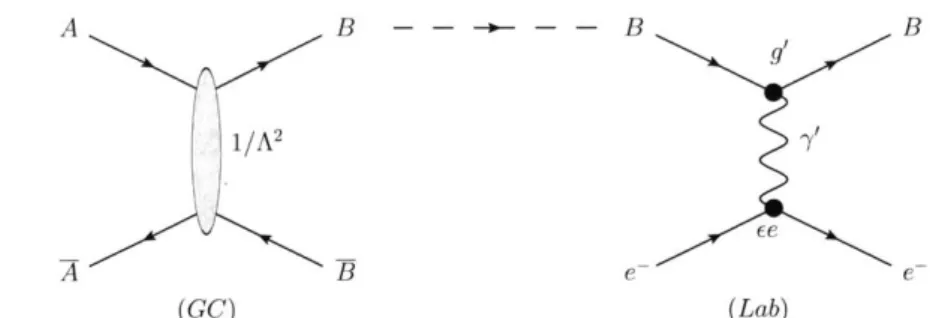
4-1 (Left) Production of boosted 4
'B particles through 'OA annihilation in
the galactic center: /A4 A - V)BV)B. This process would be considered "indirect detection" of OA. (Right) Scattering of /B off terrestrial
elec-tron targets: /Be- --+ Be~. This process would be considered "direct
4-2 (a) Ratio of the abundances QB/QA as a function of g', fixing mA -20 GeV, mB = 0.2 GeV, and my = 20 MeV. The solid line is the
numerical solution of the Boltzmann equation in Eq. (B.1), the dotted line is the analytic estimate from assuming independent thermal freeze-out of OA and 4B (naive freeze-out), and the dashed line is the analytic
estimate from Eq. (4.12) (balanced freeze-out). (b) Evolution of the co-moving abundances YA and YB as a function of x= mB/T for the benchmark in Eq. (4.13). The solid lines show the actual densities per unit entropy, while the dashed lines are the equilibrium curves. ... 75
4-3 Detection channels for boosted <B in neutrino experiments. (a) Elastic
scattering on electrons. (b) Elastic scattering on protons (or nuclei). (c) Deep inelastic scattering on protons (or nuclei). For Cherenkov ex-periments, we find that the most promising channel is electron scattering. 80 4-4 (a) Normalized recoil electron spectrum for different benchmark
sce-narios. Also indicated is the maximum scattered electron energy, given
by Eq. (4.25) as well as the experimental threshold of Super-K in the
Sub-GeV category (See Eq. (4.42)). (b) Recoil electron angular distri-bution for the same signal benchmarks, assuming a OB particle coming directly from the GC. The cutoff angle 0ithresh is obtained by
substitut-ing the 100 MeV energy threshold into Eq. (4.35). . . . . 83
4-5 Energy spectrum of signal and background events, normalized to the expected event yield over one year. The blue dashed line corresponds to the naive formula in Eq. (4.31) for the number of signal events in a 100 search cone. The solid blue line is spectrum obtained from the convolution in Eq. (4.45). The background spectrum of CC ve and
Pe events comes from Super-K [4], scaled by a factor 7r(10 )2/(47r) to account for the nominal 100 search cone. Note that data is available only for Ee > 100 MeV, which is the same experimental threshold given
in Eq. (4.42). Also indicated is the maximum scattered electron energy, given by Eq. (4.25). . . . . 84
4-6 Angles involved in boosted DM detection. When a VB particle arrives at an angle 0B from the GC, it scatters to produce an electron at angle 0e with respect to z (6' and 0'$ with respect to z'). To better isolate the
signal from the uniform atmospheric neutrino background, we impose a search cone of half-angle 0C. . . . . 85
4-7 Number of /Be -+ OBe~ signal events in Super-K, Hyper-K, PINGU, and MICA in the mA/mB plane, for my = 20 MeV (top) and m. =
50 MeV (bottom). The indicated regions are for 1 (left), 10 (center), 100 (right) detected events in a one year period, normalized to the
couplings E= 10-3 and g' = 0.5. We have imposed the angular criteria of Oc = 100 and the electron energy range of
{100
MeV, 100 GeV}({1.33 GeV, 100 GeV} for PINGU). Also shown are model-dependent
constraints on the relic /B population from Sec. 4.6: the solid gray lines are from CMB heating (shown only for g' = 0.5), and the dashed
gray lines are from DAMIC direct detection (which are independent of g', but can be eliminated by adding an inelastic splitting). The red star indicates the benchmark in Eq. (4.13). . . . . 94
4-8 Yearly signal significance in the Sub-GeV category for our benchmark in Eq. (4.13) as a function of the search cone angle Oc. The peak around
4-9. Signal significance at Super-K, Hyper K, PINGU and MICA on the
mA/mB plane, for mY 20 MeV (left) and mY = 50 MeV (right),
fixing c =0-- and g' 0.5. Shown are the 2c- reaches with 10 years of data, taking Oc 100 and adding the significances of the
Ee E {100 MeV, 1.33 GeV} and Ee G {1.33 GeV, 100 GeV} categories
in quadrature (only the latter for PINGU). Also shown is the current 2a- exclusion using all-sky data from Super-K, where we assume a 10% uncertainty on the background. The grey model-dependent limits are the same as in Fig. 4-7: the solid gray lines are constraints on OB from
CMB heating and the dashed gray lines are from DAMIC. The red star is the benchmark from Eq. (4.13). . . . . 98
4-10 Same as Fig. 4-9, but on the g'/mB plane, for mA = 20 GeV (left) and mA = 50 GeV (right), fixing 6 = 10-3 and my = 20 MeV. The spikes
in the CMB heating bounds (solid gray lines) are from Sommerfeld
resonances. ... ... 99
5-1 Scattering process of BDM B off of electrons. . . . . 108 5-2 Annihilation process that produces B with a Lorentz boost. . . . . .111 5-3 Geometry of a search cone for incoming B particles originating at the
GC and scattering off electrons at a neutrino experiment
[5].
. . . 1125-4 95% limits on parameter space for BDM annihilation for Super-K, Hyper-K and DUNE for 10 and 40 kton in volume. The gray region is excluded by the fact that no excess has been detected in Super-K in the past 11 year data set. . . . . 121
5-5 Map of the dSphs' locations in Galactic coordinates used in this anal-ysis. The center of the figure is the GC. . . . . 123 5-6 95% limits on parameter space for BDM annihilation in a stacked
anal-ysis of dSphs. The gray region is excluded by the fact that no excess has been detected in Super-K in the past 11 year data set. . . . . 125
A-2 As Fig. 2-7, except for decay rather than annihilation. . . . . 132 A-3 Histograms of the observed axis ratio for annihilation (left) and decay
(right) for different mass bins: M200 > 2 x 10¹²MO, 1010MO < M200 <
2 x 10¹²MO and M
200 < 1010M0. . . . . 133
A-4 Histograms of the angle between the halo's minor axis and the angular momentum vector of the baryons in annihilation (left) and decay (right) for three different mass bins: M200 > 2 x 10¹²MG, 1010MO < M20 0 <
2 x 10¹²MG and
M200 < 10'0M0 . . . . . 134 B-i Left: Direct detection mechanism for OA via a OB-# loop. Right:
Scattering cross section of OA on nucleons, sweeping mB = 0.1
GeV-3 GeV and fixing g' = 0.5 and E = 10-. Also shown are the current
LUX limit (gray hashes). . . . . 141 B-2 Maximum observed angle of the electron 0e as a function of the initial
angle at which the Boosted particle B was emitted for different values of the boost factor B. . . . . 148 B-3 Feynman diagrams for the production and detection of DM particles.
(Left) Diagram that controls the abundance of A in the early universe as well as today's production of B with a Lorentz boost through A an-nihilation. (Middle) Annihilation of B to -y', diagram that contributes to CMB limits. (Right) Signal diagram of B scattering off electrons. . 149 B-4 Super-K, Hyper-K and DUNE limits for the model from Ref. [5] with
an exposure of 13.6 years. . . . . 151
List of Tables
2.1 The particle masses and softening lengths for the 1 and Illustris-1-Dark simulations
[61;
"DM" subscripts label DM, while "b" subscripts label baryons. . . . . 344.1 List of experiments studied in this chapter, their angular resolutions
0res on the Cherenkov-emitted electron direction, and the typical min-imum energy threshold Eethresh of the detected electron. We note here that IceCube has too high of an energy threshold for our analysis, but we are interested in its future low-energy extensions such as PINGU and MICA. For PINGU, we have scaled the nominal volume (1 MTon) down by a factor of 2 to estimate particle identification efficiency. The
MICA values are speculative at present, since there is not yet a
tech-nical design report. . . . . 90
5.1 Detectors included in this analysis. We use the exposure time of Super-K as a reference for comparison with the rest of the experiments. . . . 118 5.2 A summary of the production frequency of free hadrons in collisions
between atmospheric electron (anti)neutrinos and argon-40 . . . . 119 5.3 Kinetic energy thresholds for DUNE to be able to detect various hadrons
[7 ]. . . . . 1 2 0 5.4 Table of dSphs's locations, distances and J-factors, compiled in Refs.
[8, 91 . . . .
Chapter 1
Introduction
1.1
Dark Matter
1.1.1
Introduction
One of the most important questions in physics today is Dark Matter (DM), a non-baryonic matter that represents a quarter of the energy budget of the universe, and is five times more abundant than the matter that makes up our visible universe. Understanding the origin of DM is therefore crucial; it is a question at the intersection of the smallest and largest scales, of particle physics and astrophysics. Making a consistent theory requires studying Nature across both the largest and smallest scales, which is the theme of this thesis.
Gravitational evidence for DM has been discovered when the movement of the luminous matter (gas, stars, galaxies) was inconsistent with the motion extrapolated from their brightness. Fritz Zwicky first measured the velocities of the stars of the Coma Cluster in 1933, and suggested that Dark Matter, a term coined by Henri Poincare in the early 20th century, might be more abundant than baryonic matter
[101. DM became the spotlight of modern physics with the seminal work of Vera
Rubin, in which she calculated the circular velocity of several galaxies, and found that the stellar velocity is independent of distance to the center of the host galaxies, a result that is unexpected if all the matter in a given galaxy only originated from
the observable gas and stars [11, 12, 13]. The evolution of cosmology only helped solidify the existence of DM, especially with the extremely accurate measurements of the cosmic microwave background [14, 15, 16].
Two plausible solutions to the discrepancy between the amount of luminous matter and the kinematics of the stars emerged: either a modification to gravity is required, or there exists an additional substance, which has yet to be detected, that makes up for the missing mass. What has driven the field to investigate further the theory of this new particle is the study of the Bullet Cluster [17]. A merger of the main Bullet Cluster with a subcluster has been observed, and the gas, stars, and the mass distribution have each been traced separately. Gas, representing 90% of the baryonic mass, has been detected in the middle of the merger, in collision between the two clusters. The total mass distribution of the mergers, traced through weak lensing, has been found to follow the collisionless stellar component, which should only account for 10% of the total mass. It has thus been concluded that there exists a collisionless unseen matter that dominates the mass of the clusters, which in this case passed essentially unperturbed through the merging event.
Different search methods have been set up to detect DM: direct detection exper-iments, in which a DM particle scatters off a heavy nucleus causing it to recoil and produce a detectable signal, indirect detection experiments, where standard model
(SM) particles that are the product of DM annihilation/decay are detected, and
col-lider experiments that attempt to produce DM particles. In this thesis, I will focus on predicting the behavior of DM from simulations in both direct and indirect detec-tion experiments, and then build a novel DM model with interesting hybrid (in)direct detection signals.
1.1.2
Simulations
N-body simulations are realizations of our known universe, or parts of it, tracing
the evolution of DM "particles" from early times to the present day. These. DM "particles" are generally ~ - 10 solar masses, and they are not to be confused
10 0 . 1 . I I I I I I Comoving Abundance - m,=20 GeV, c-=5x10-26 cm3/s -10 -5
---Yeq 110 -io1 - -101 102 x=mx/TFigure 1-1: Evolution of the abundance of a WIMP DM X of mass m = 20 GeV, and an annihilation cross section to SM of -= 5 x 10-26 cm3/s.
Interacting Dark Matter (WIMP) particles, or the DM candidate I introduced with collaborators, called Boosted Dark Matter (BDM) [5]; in both of these scenarios, the fundamental DM particle could have mass of several GeV (the mass of a few protons). These simulations have recently evolved into hydrodynamic simulations, which are
N-body simulations that also include star and gas particles [18, 19, 20, 21, 22].
Including baryonic physics furthers our understanding of the physics of DM, as the latter might be influenced by the kinematics of the baryons.
1.1.3
WIMP Freeze-Out
One of the most commonly discussed DM models the WIMP scenario, which we there-fore reference throughout this thesis. In this class of models, the weakly interacting DM particles are in thermal equilibrium with the SM at early times. For simplicity, let's assume that the process that maintains this equilibrium is the DM annihilation
XX -- SM SM, where x denotes the DM particle. The evolution of the DM
abun-dance as a function of inverse temperature T of the universe is shown in Fig. 1-1. Initially, this process occurs along with SM SM-+ xx, and therefore equilibrium is
maintained between the DM and SM sectors. As the universe expands and cools down, the process (SM SM-+
xx)
is less and less efficient, and therefore the number density of DM is slowly depleted, as shown in Fig. 1-1 for x = mx/T < 20, where mxis the DM mass. This would lead to the annihilation of all DM particles were it not for the process of freeze-out; as the universe expands, it is less and less likely for DM particles to find one another and annihilate, and therefore the abundance of DM (per co-moving volume) freezes out around x ~ 20 into the density that we have today.
1.2
Spherical Cows of Dark Matter Indirect
Detec-tion
In hydrodynamic simulations, DM particles interact only gravitationally with baryons. Although these simulations have large particles, which instead of being thought of as one object like a star, can be thought of as a stellar/DM population, they can con-sistently reproduce large scale features of the universe. Some zoom-in simulations, which are realizations of the Milky-Way, can successfully simulate the spiral arms of the Milky Way as well as the independence of the velocity from the distance to the center of the galaxy [23]. This leads us to believe that some of the features of DM are well reproduced in these simulations.
In Chapter 2, I present work performed with Nicolds Bernal and Tracy Slatyer, where I performed the analyses on the simulations
[24].
I use the cosmological simula-tion Illustris [25, 26, 271 to predict the morphology of DM indirect detecsimula-tion signals. Galaxies reside in the centers of large DM clumps referred to as DM halos. Pre-vious studies of DM halos have shown that they tend to be triaxially distributed[28, 29, 30, 31, 32, 33, 34, 35]. Indirect detection signals, however, are sensitive to
the DM morphology in projection, perpendicular to the line of sight. In Chapter 2, I perform two analyses of the expected projected morphology of DM from simulations: a Galactic analysis, in which I place an observer at 8.5 kpc from the halo center for halos of comparable size to the Milky Way, and an extragalactic analysis, in which I
place the observer outside the halo. I found that the expected Galactic indirect de-tection signals are highly symmetric, while the extragalactic signals, especially those of annihilating DM are almost uniformly distributed across axis ratios.
In these analyses, I built a new metric for the moment of inertia tensor that is weighed in DM "luminosity". This metric is easily applicable to data. Indeed, I compared the simulated axis ratios with those of the Milky Way in Gamma rays detected by the Fermi-LAT telescope [36]. This gamma ray data is of particular interest since, a few years ago, an excess of gamma rays has been detected at the center of the Milky Way [37, 38, 39, 40, 41], and many have theorized about the possibility of a DM origin for this excess [42, 43, 44, 45, 46, 47, 48]. I therefore compared the full gamma ray Fermi sky map in energies - 1 - 10 GeV, as well as
the residual gamma rays attributed to the excess with the predicted Illustris result. I found that the excess is in agreement with the expected morphology of a DM signal.
A stacked analysis of clusters in X-rays has shown the presence of a line at 3.5
keV, unaccounted for by atomic emission lines [49, 50, 51]. A few studies attributed these X-rays to DM being a sterile neutrino [52, 53]. Although it is difficult to isolate the photons contributing to the lines, I studied the full X-ray data from clusters and found that they tend to be more symmetric than we expected the background to be from the active merger history of Illustris. This should be followed closely, and will be of particular interest with the improvement in spatial resolutions of future telescopes.
1.3
Empirical Determination of Dark Matter
Veloc-ity Using Metal Poor Stars
Another method of detecting DM is direct detection. The detection rate of DM scattering off heavy nuclei depends on astrophysical quantities, and in particular the velocity distribution of DM. Most DM direct detection limits use the Standard Halo Model (SHM) which assumes a Maxwellian DM velocity distribution, obtained from a collisionless isothermal density distribution with a flat rotation curve. Using a
zoom-in simulation called Eris [23, 541, I found that metal poor stars, as they origzoom-inate zoom-in satellite galaxies that merge into the Milky Way halo similarly to DM, are excellent tracers for the kinematics of DM.
I used the velocity distribution of the stellar halo which is formed by old metal-poor stars kinematically unassociated with the stellar disk, obtained from the Sloan Digital Survey (SDSS) [55, 56, 2], to infer that of the DM, as shown in Chapter 3, which is a published work performed in collaboration with Jonah Herzog-Arbeitman, Mariangela Lisanti, and Piero Madau [57]. This is important in setting direct detection limits.
I found that at low masses, the limits set using the SHM are an order of magnitude
stronger than those found using the SDSS distribution. This work can be extended to more local stellar catalogs such as RAVE-TGAS [58, 59] to study the local DM velocity distribution, as well as DM substructure [60].
1.4
Boosted Dark Matter
All these previous analyses target collisionless DM (or the WIMP paradigm in the
limit where the DM interacts weakly), but it is important to investigate other DM scenarios. One such scenario is that of BDM, developed in Chapter 4, which presents published work performed in collaboration with Kaustubh Agashe, Yanou Cui, and Jesse Thaler [5]. It consists of two DM components A and B, where A is heavier and dominates the DM abundance. A annihilates to B which, due to the mass hierarchy, gets a Lorentz boost today. Such boosted particles can scatter off electrons in neutrino experiments, and cause an excess of electron events over muons, which can be studied in experiments such as Super-Kamiokande (Super-K) and its future upgrades [61, 62, 631. We are therefore directly detecting the B component, while indirectly detecting the A DM particle.
The boosted B particles generally emit electrons in the forward direction, which therefore point back to the DM origin -regions dense in DM, such as the Galactic Center, or dwarf galaxies
[64].
This is useful in Cherenkov-based experiments like Super-K in limiting the backgrounds, but can be used to set more constraining limitson BDM from DM point sources such as dwarf galaxies at liquid-argon detectors like the Deep Underground Neutrino Experiment (DUNE)
[651.
Argon-based detectors have excellent particle identification and spatial resolution, and can therefore extend the reach of observable BDM signals, as shown in Chapter 5, which is published work performed in collaboration with Jarrett Moon, Taritree Wongjirad, and Janet Conrad[641.
I present the limits on BDM in a simplified constant amplitude model acrossmultiple experimental technologies, and propose a search strategy that the limits atmospheric backgrounds for each technology separately.
1.5
Additional Topics
During my time at MIT, I worked on multiple aspects of dark matter research, beyond the ones I described above. In particular, I studied an asymmetric DM model with interesting indirect detection signals in gamma rays, analyzed Fermi-LAT gamma ray data at high latitudes to extract the fraction of the extragalactic gamma ray back-ground (EGB) dominated by point sources, studied the effect of an ultralight scalar field on neutrino oscillation parameters, and finally developed new jet substructure observables to discriminate boosted W and Z bosons as well as top quarks from backgrounds.
In Ref. [47], my collaborators and I built an asymmetric DM model with a hybrid thermal history. This particular DM model is both asymmetric and WIMP-like, and thus the final DM abundance is set by a hybrid mechanism at the intersection of thermal freeze-out and asymmetric DM. Such model has interesting potential indirect detection signals, which is generally lacking in asymmetric DM models. In particular, asymmetric DM candidates studied produced gamma rays consistent with the GeV excess at the center of the galaxy [38].
I have also studied gamma rays from the Fermi-LAT telescope in order to estimate the point source contribution to the extragalactic gamma ray background (EGB)
[66].
This is of particular interest since an excess of high energy neutrinos has recently been detected, the origin of which is still unknown
[671.
If these high energy neutrinosoriginated from star forming galaxies, these same galaxies would have also emitted gamma rays that would contribute to the EGB. In our work, we used a novel analysis method called Non Poissonian Template Fit [68, 691 to estimate the number of point sources in the EGB. This sets a limit on the fraction of diffuse gamma rays emitted by star forming galaxies. We alleviated some of the tension found in previous work [70], which set stronger bounds on the diffuse emission from the star forming galaxies and were therefore inconsistent with the interpretation that these high energy neutrinos originated in star forming galaxies.
With collaborators, I considered sub-eV scalar DM coupling to neutrinos as Ovv, inducing temporal variations on neutrino parameters
171].
The scalar#
has a local field value at the spacetime coordinate (t, x), and that can be written as# (x, t) = qo cos(mO(t - V'.sX)), (1.1)
where qo is a quantity set by the coupling of 0 to neutrinos, the mass of
#,
and the local DM density. U - 10- denotes the virial velocity of DM. The oscillations of thescalar field, although faster than ~ 0(s), can introduce distorted neutrino oscillations
by shifting the square mass differences as well as the neutrino angles by a quantity
proportional to r0. From precise measurements of neutrino parameters, we can set bounds on the mass and coupling of the scalar q, over decades in masses, from ~ 10-23
eV to ~ 1010 eV, expecting better improvement by the future experiments DUNE
[65] and JUNO 172].
Finally, another way of detecting DM is to produce it at colliders. Colliders are overwhelmingly dominated by Quantum Chromodynamics (QCD) backgrounds. Sprays of QCD particles are collimated into jets, some of which might have an inner substructure that helps identify its origin. Multiple jet substructure techniques have been developed to study multi-prong objects [73, 74, 75, 76]. Some of these are based on energy correlation functions, which are functions of energy fractions and angles of the different components of the jet
[77].
In order to disentangle new physics from QCD backgrounds, my collaborators and I introduced new jet substructure observables thatdiscriminate 2 and 3 prong jets from QCD backgrounds
[78].
We used power counting techniques [79, 80] to develop a new set of observables, N2, M2, and N3 that show excellent discrimination power, but also stability under changes in mass and PT cuts. Such a property is desirable in highly desirable in experimental searches [81]. These observables are currently being investigated by the CMS collaboration of the Large Hadron Collider, with a recent analysis published just days ago [82].Chapter 2
Spherical Cows of Dark Matter
2.1
Introduction
Gravitational evidence for dark matter (DM) is well established [10, 11, 83], yet DM
still evades all other means of detection [84, 85, 8, 48, 861. A current focus of the search for DM is indirect detection: DM annihilation or decay could produce observable Standard Model (SM) pchapters, including photons. If such a signal was detected, the direction of the incoming photons could be used to map out the morphology of DM halos.
N-body simulations constitute a valuable tool for studying the expected DM
dis-tribution [87, 88, 18, 89, 35], and can be used to predict the properties of indirect signals from DM
[90,
91, 92]. Hydrodynamic simulations include baryonic matter aswell as DM, and thus can probe the impact of baryonic feedback on the DM distri-bution
[35].
With recent hydrodynamic simulations that generate large ensembles of DM halos, we can make statistical statements about the general properties of DM halos with and without baryons [93, 94, 29, 95, 96, 97, 98, 30, 99, 100]. In particular, as we demonstrate in this work, we can map out the full distribution of properties relevant to indirect DM searches, rather than relying on a small number of example halos.In this chapter, we focus on studying the morphology of indirect detection sig-nals using N-body simulations. More specifically, we study sphericity/ asymmetry of
signals after projection along the line of sight. We perform a statistical analysis of the annihilation/decay signatures of a large number of halos in two simulations: the hydrodynamic simulation Illustris-1, which includes DM and baryons, and its DM-only equivalent Illustris-1-Dark [25, 101]. We predict the shape of annihilation/decay DM signals from Galactic and extragalactic (EG) sources, and diagnose the effect of baryons on the asymmetry and sphericity of these signals. For the remainder of the text, we will refer to signals as "spherical" if they could be produced by the line-of-sight projection of a spherical 3D source of photons; i.e. they are symmetric under rotation of the sky around the line-of-sight pointing toward their center.
Several potential signals have appeared in indirect DM searches over the past few years. An anomalous emission line at -3.5 keV has been found in a stacked analysis of 73 galaxy clusters [491 and in other regions [52, 53, 50, 51]. Analysis of data from the Fermi Gamma-Ray Telescope (hereafter Fermi)
[36]
has shown an unexplained spherically symmetric excess of O(GeV) gamma rays at the center of the Galaxy[37, 102, 38, 40, 39, 48, 41]. Studying expected properties could help discriminate
DM against astrophysical backgrounds.
This chapter is organized as follows. First we introduce our methodology in Sec. 2.2; we describe the Illustris simulation, and the related computations of DM density, and define the metrics used for the determination of halo shapes. We then perform two analyses of annihilation and decay signals, one where the observer is situated at a location 8.5 kpc from the center of the halo (Sec. 2.3), and one where the observer is outside the halo (Sec. 2.4). In each of these sections, we present the overall distributions for asymmetry and axis ratio. For the former (Galactic) anal-ysis, we focus on the subcategory of Milky-Way (MW) type halos. For the latter (extragalactic) analysis, we focus on cluster-sized halos. In both cases, we also study possible correlations between halo axes and the baryonic disk. In Sec. 2.5, we discuss two case studies of the morphology of astrophysical backgrounds for DM searches, first considering the gamma-ray background and signal for the Fermi inner galaxy excess, and then the clusters in which the - 3.5 keV line is detected. We summarize
2.2
Methodology
In the context of indirect DM searches for photons or neutrinos, the quantity of interest for decay (annihilation) is the integrated DM density (density squared) of DM particles along the line of sight. This is referred to as the J-factor; to compute it within the Illustris simulation, we must define it in the context of the discrete representation of the underlying matter distribution.
2.2.1
Illustris Simulation
The Illustris simulation is a publicly available' hydrodynamic simulation that traces the evolution of DM particles, as well as gas, stars and black holes across redshifts from z = 127 to today z = 0 [103, 104, 25, 101, 26]. The Illustris simulation employs
a comprehensive suite of baryon physics including stellar evolution and feedback, gas recycling, supermassive black hole growth, and feedback from active galactic nuclei
[251. In this work, we focus on the last snapshot at z = 0, which reflects the simulated
state of today's Universe
[27].
The simulation is conducted at 3 different resolution levels, Illustris-1, Illustris-2, and Illustris-3. It also includes the same set of simulations for DM only particles, at the same resolution levels, Illustris-1-Dark, Illustris-2-Dark, and Illustris-3-Dark. The simulations cover a total volume of (106.5 Mpc)3. In thiswork, we focus on the highest resolution simulations Illustris-1 and Illustris-1-Dark. Parameters of the simulations are shown in Table 2.1, including the mass of the DM and baryon particles, and the spatial resolutions of the simulations. The mass of a DM particle is fixed throughout the simulation, but that of a baryonic particle (which sums the mass of the gas, stars and black holes) is not conserved, but kept within a factor of 2 of the quoted baryonic mass mb. Gravity is included with softening of the
potential at small scales to avoid numerical two-body particle scattering [1051. The softening lengths for both DM and baryons, EDM and 6b, are also shown in Table 2.1.
The Illustris simulation used the friends-of-friends (FOF) algorithm to identify DM halos [106]. The Illustris-1 simulation has 7713601 halos, and 4366546 identified
Simulation mDM(M®) mb(M®) I EDM(kpc) Eb(kpc)
Illustris-1 6.3 x 10⁶ 1.3 x 10⁶ 1.4 0.7
Illustris-1-Dark 7.5 x 10⁶ - 1.4
-Table 2.1: The particle masses and softening lengths for the 1 and Illustris-1-Dark simulations [6]; "DM" subscripts label DM, while "b" subscripts label baryons.
as subhalos. The Illustris-1-Dark simulation includes 4263625 halos and 4872374 subhalos. To limit the impact of poorly resolved objects on our results, we only examine halos with at least 1000 DM particles. This cut leaves 1.6 x 10⁵ and 1.5 x 10⁵ halos for Illustris-1 and Illustris-1-Dark respectively. The halo mass function of the Illustris simulation described in Ref. [25] is in good agreement with the empirical data. Deviations from observations are present at the low and high end of the resolved masses, where the details of the implementation of the stellar and AGN feedback are important. The mass range of halos that pass the 1000 DM particle cut is - 5 x 10⁹M0
to 3 x 10'4Mo.
2.2.2 Computing J-factors
The quantity of interest in this analysis is the J-factor, defined by
f p2 ds dQ for annihilation, (2.1)
f
p ds dQ for decay,where p is the density of DM, and the integral is along the line of sight and over solid angles. In order to integrate the local DM density (or density squared) given the discrete particle distribution, we use a kernel summation interpolant to reconstruct a continuous DM density field [107, 108, 20]. More explicitly, for a field F(r, one can define a smoothed interpolated version F(r), related to F through a kernel function
W
where d defines the length of the smoothing. The kernel function W approaches a delta function as d - 0. We use a cubic spline to compute the local density p:
I - 6q2
+
6q'; 0 < q <82
w(q) = 3 2(1 - q)3; < q < 1 (2.3)
0; q > 1.
The smoothing kernel in this case is W(r, d) = w(r/2d), where d is chosen to be the distance to the 3 3rd nearest neighbor of the point considered. In order to compute
the density along a particular line of sight defined by the galactic coordinates (I, b), we sum over the density of the 32 nearest neighbors to a particular point, and adjust the next step in the integral to be the newly found d. We have checked that doubling the number of neighbor particles employed in this procedure from 32 to 64 does not alter our results. This is due to the fact that the contribution of further particles is proportional to 1/r2
We proceed to construct sky maps of annihilation/ decay J-factors for each halo,
by placing an observer at RO = 8.5 kpc from the center of the halo along the x-axis of
the simulation, and compute the J-factor for different values of galactic coordinates (1, b). The center of the halo is defined as the location of the gravitational potential minimum. We use the package HEALPix2 to divide the sky into equal area pixels
[109]. The total number of pixels in a map is defined by
nyx = 12 x nside2, (2.4)
where nside is an input parameter that defines the pixelation. We show an example of such constructed maps in Fig. 2-1, for the annihilation signal of a particular halo. For the example chosen, the halo radius, R200 defined as the radius such that the average density interior to that radius is 200 times the critical density of the universe,3 is
2http://healpix.sourceforge.net 3
The distances in the simulation are presented in units of kpc/h, where h = 0.704 is the reduced Hubble constant so that H = h x 100 km/sec/Mpc. The cosmological parameters used are Qm =
Figure 2-1: Logarithmic map for DM annihilation for halo labeled "0" in the
Illustris-1 simulation. Lighter colors signify higher DM luminosity. We used HEALPix with
nside = 16 (see Eq. 2.4). This map is taken by positioning the observer at 8.5 kpc from the center of the halo. The mass of this halo is 3.2 x 101 4MO.
1659 kpc/h = 2356 kpc, much larger than the observer distance from the center of
the halo Ro = 8.5 kpc, and therefore, there is still sizable signal from high latitudes.
2.2.3
Asymmetry Parameterization
Axis Ratio
One measure of sphericity is the axis ratio. First, we summarize previous methods of finding the axis ratio and the major axis. Unlike previous analyses that analyzed the halo shapes through the 3D moment of inertia tensor [110, 111, 93, 96, 98, 99], we compute the 2D projection of the inertia tensor along the plane perpendicular to the line between the observer and the halo center, as all indirect detection signals are found in projection. That is defined as [112]
Si
= E ni n
(2.5)
n
where the sum is taken over the DM particles n of the halo, and i,
j
correspond to the coordinates of the particle n projected on the plane perpendicular to the observer.4 For example, if the observer is located along the x axis (where the center of the Cartesian coordinate system is at the center of the halo, defined in the simulation4
See Ref. [113] for a discussion of the different definitions of the inertia tensor that occur in the literature.
as the location of the most-bound particle), xi, xj run over the four combinations of the y and z coordinates for each of the DM particles of the halo. The axis ratio is defined as the ratio of the square root of the eigenvalues of the inertia tensor, where in this work we use the convention where the axis ratio is always less than 1. The major axis of the halo is the eigenvector corresponding to the largest eigenvalue. In this notation, the axis ratio of a spherical halo is 1.
We introduce a variation on the inertia tensor defined in Eq. 2.5 that is adaptable to indirect detection signals. This new inertia tensor uses the same information that we would have looking at a DM annihilation/ decay signal. In this case, the DM particle coordinates are weighed by luminosity in DM signal, which is the J-factor at that location. The new inertia tensor that we call the J-tensor is therefore
Jij = E J(zn,i, zn,j) Zn,i ZnJ , (2.6)
n
where the coordinates z,,i are obtained from scanning through the pixels in the sky and inferring the Cartesian coordinates of that particular pixel (assuming we live in a sphere), and J is given by Eq. 2.1 at a point in the sky given by the coordinates Zni.
With this approach, all particles within the same line of sight contribute only once but their contribution is weighed with the observed intensity of the signal. As above, the observed axis ratio is defined as the ratio of the square roots of the eigenvalues of the J-tensor, and the halo's major axis is the eigenvector with the largest eigenvalue.
Quadrant Analysis
As a second parameterization of the observed asymmetry of DM signals, we divide the observed sky into four equal quadrants, with the origin of the coordinate system lying along the line of sight to the center of the halo. The halos are oriented randomly relative to the quadrant boundaries unless otherwise stated.
2.2.2
JA = Ji, (2.7)
iERk
where k c {1, 2, 3, 4} labels the different quadrants, and Rk is the list of pixels in quadrant k. Ji is the value of the J-factor found at pixel i. The quadrants are labeled such that quadrant 1 is adjacent to 2 and 4, and opposite to 3. We define the following ratios, describing the relative predicted emission in pairs of opposite or adjacent quadrants
S(Ji + J3) - (J2 + J4
)
(2.8)
Ei Ji
RadjZ
=(J
1 + J2) - (J3 + J4)J(2.9)
Ei Ji
For signals that appear spherical from the point of view of the observer, the ratios defined in Eqs. 2.8 and 2.9 RPP = Radj = 0. For signals that appear strongly
elongated or asymmetric, R,p -* 1 or Radj - 1 depending on which quadrants
dominate the DM signal.
2.3
Galactic Analysis
In this section, we perform a statistical analysis of the sphericity of annihilation/decay
signals as observed from a location RO = 8.5 kpc from the halo center, similar to the
Earth's separation from the center of the Milky Way [114, 115]. We first study
the distribution of the observed axis ratio in annihilation and decay as defined in
Sec. 2.2.3, as well as the distribution of the ratio in intensity of opposite and adjacent
quadrants as introduced in Sec. 2.2.3. We plot the histograms of probability densities
in each distribution, counting each halo just once unless otherwise stated. We then focus our analysis on Milky-Way-like halos, orienting the observer to be on the halo
1
0
I-100
Projected Axis Ratio
B+DM DM only ----0-1 0-2' n-3 14 0. 0.2 0.4 0.6 0.8 Axis Ratio
Figure 2-2: Histogram of the conventional newly defined observed axis ratio (right) for Illustris-1 and Illustris-1-Dark (see Eq. 2.6).
U, C U .0 0 I-1 1 * 'V ' I ' I ' I ' t
Observed Axis Ratio
B+DMDMonly Annihilation -Decay - -0-2 0-27 1. 0. 0.2 0.4 0.6 Axis Ratio 0.8 1.
2-dimensional axis ratio (left) and the annihilation and decay, comparing both
correlations between the halo minor axis and the baryonic disk.
2.3.1
Observed Axis Ratio
For comparison, we first illustrate the distribution of the axis ratio as obtained from the two-dimensional inertia tensor defined in Eq. 2.5. As shown in Fig. 2-2 (left), we find that the distribution peaks at axis ratio ~~ 0.85, which is consistent with results
found from the projected shapes of DM halos inferred from the position of galaxies in the Sloan Digital Sky Survey Data Release 4 [116]. This suggests that halos are mostly symmetric in Cartesian projection, which is independent of the observer's distance. In the same figure, we show the distributions of axis ratio in the DM-only and the DM+baryon simulations. We only find a minor tendency for halos in the DM+baryons simulation to be more symmetric in projection.
Moving to the J-tensor, we plot the distributions of the observed axis ratio for indirect detection signals in Fig. 2-2 (right), for observers at distances from the center of the halo comparable to the solar circle radius.5 These distributions are generally
5Since in this figure we include all halos, not only MW-sized halos, the solar circle radius may be
much smaller or larger as a fraction of the virial radius than it is in the Milky Way. However, we have checked that for all but a handful of halos, the observer is still within the halo virial radius at this distance; furthermore, we show results specifically for MW-sized halos in Sec. 2.3.4.