HAL Id: inserm-00668430
https://www.hal.inserm.fr/inserm-00668430
Submitted on 9 Feb 2012
HAL is a multi-disciplinary open access
archive for the deposit and dissemination of
sci-entific research documents, whether they are
pub-lished or not. The documents may come from
teaching and research institutions in France or
abroad, or from public or private research centers.
L’archive ouverte pluridisciplinaire HAL, est
destinée au dépôt et à la diffusion de documents
scientifiques de niveau recherche, publiés ou non,
émanant des établissements d’enseignement et de
recherche français ou étrangers, des laboratoires
publics ou privés.
and comparison with Doppler echocardiography.
Emilie Bollache, Alban Redheuil, Stéphanie Clément-Guinaudeau, Carine
Defrance, Ludivine Perdrix, Magalie Ladouceur, Muriel Lefort, Alain de
Cesare, Alain Herment, Benoît Diebold, et al.
To cite this version:
Emilie Bollache, Alban Redheuil, Stéphanie Clément-Guinaudeau, Carine Defrance, Ludivine Perdrix,
et al.. Automated left ventricular diastolic function evaluation from phase-contrast cardiovascular
magnetic resonance and comparison with Doppler echocardiography.. Journal of Cardiovascular
Mag-netic Resonance, BioMed Central, 2010, 12 (1), pp.63. �10.1186/1532-429X-12-63�. �inserm-00668430�
R E S E A R C H
Open Access
Automated left ventricular diastolic function
evaluation from phase-contrast cardiovascular
magnetic resonance and comparison with
Doppler echocardiography
Emilie Bollache
1*, Alban Redheuil
1,2, Stéphanie Clément-Guinaudeau
2, Carine Defrance
1,2, Ludivine Perdrix
3,
Magalie Ladouceur
1,2, Muriel Lefort
1, Alain De Cesare
1, Alain Herment
1, Benoît Diebold
1,3, Elie Mousseaux
1,2,
Nadjia Kachenoura
1Abstract
Background: Early detection of diastolic dysfunction is crucial for patients with incipient heart failure. Although this evaluation could be performed from phase-contrast (PC) cardiovascular magnetic resonance (CMR) data, its usefulness in clinical routine is not yet established, mainly because the interpretation of such data remains mostly based on manual post-processing. Accordingly, our goal was to develop a robust process to automatically estimate velocity and flow rate-related diastolic parameters from PC-CMR data and to test the consistency of these
parameters against echocardiography as well as their ability to characterize left ventricular (LV) diastolic dysfunction.
Results: We studied 35 controls and 18 patients with severe aortic valve stenosis and preserved LV ejection fraction who had PC-CMR and Doppler echocardiography exams on the same day. PC-CMR mitral flow and myocardial velocity data were analyzed using custom software for semi-automated extraction of diastolic
parameters. Inter-operator reproducibility of flow pattern segmentation and functional parameters was assessed on a sub-group of 30 subjects. The mean percentage of overlap between the transmitral flow segmentations
performed by two independent operators was 99.7 ± 1.6%, resulting in a small variability (<1.96 ± 2.95%) in functional parameter measurement. For maximal myocardial longitudinal velocities, the inter-operator variability was 4.25 ± 5.89%. The MR diastolic parameters varied significantly in patients as opposed to controls (p < 0.0002). Both velocity and flow rate diastolic parameters were consistent with echocardiographic values (r > 0.71) and receiver operating characteristic (ROC) analysis revealed their ability to separate patients from controls, with sensitivity > 0.80, specificity > 0.80 and accuracy > 0.85. Slight superiority in terms of correlation with echocardiography (r = 0.81) and accuracy to detect LV abnormalities (sensitivity > 0.83, specificity > 0.91 and accuracy > 0.89) was found for the PC-CMR flow-rate related parameters.
Conclusions: A fast and reproducible technique for flow and myocardial PC-CMR data analysis was successfully used on controls and patients to extract consistent velocity-related diastolic parameters, as well as flow rate-related parameters. This technique provides a valuable addition to established CMR tools in the evaluation and the management of patients with diastolic dysfunction.
* Correspondence: emilie.bollache@imed.jussieu.fr
1
INSERM U678/UPMC Univ Paris 6, 91 Bd de l’Hôpital, 75013 Paris, France Full list of author information is available at the end of the article
© 2010 Bollache et al; licensee BioMed Central Ltd. This is an Open Access article distributed under the terms of the Creative Commons Attribution License (http://creativecommons.org/licenses/by/2.0), which permits unrestricted use, distribution, and reproduction in any medium, provided the original work is properly cited.
Background
Altered diastolic function, which is strongly related to the quality of left ventricular (LV) filling, is a source of heart failure: it has been shown that 40 to 50% of patients suffering from heart failure have a normal LV ejection fraction while their diastolic function is impaired [1]. Furthermore, diastolic impairment without global systolic dysfunction is related to poor outcome [2,3]. Thus, the early and robust detection and quantifi-cation of diastolic dysfunction is crucial for optimal patient management. In clinical routine, the evaluation of diastolic function is achieved using Doppler echocar-diography [4]. More specifically, several conventional diastolic parameters are estimated: the early and late fill-ing peak velocities of the transmitral flow (E and A) and E-wave deceleration time (DT), as well as the annular myocardial early longitudinal peak velocity (E’). It has been shown that the calculated ratios E/A and E/E’, as well as DT, have a high prognostic value [4,5].
Cardiovascular magnetic resonance (CMR) with its recent developments in velocity encoding is increasingly used for the analysis of through-plane blood flows and myocardial velocities. Furthermore, several studies demonstrated the usefulness of phase-contrast (PC) CMR in the measurement of some of the aforemen-tioned conventional diastolic parameters [6-8]. However, these analyses were mostly based on manual positioning of regions of interest (ROIs) within the transmitral flow area or the myocardium on multiple phases [8-15]. This manual positioning of ROIs is time-consuming and operator-dependent.
Accordingly, our first goal was to develop a robust tech-nique to automatically delineate the transmitral flow pat-tern, as well as the myocardium throughout the cardiac cycle, and to extract functional diastolic parameters from both velocity and flow rate curves. Our second aim was to test the consistency of these parameters on a group of 53 subjects including controls and patients, by evaluating: 1) the correlation between CMR parameters and the echo-cardiographic indices acquired on the same day, and 2) the ability of both CMR and echocardiographic diastolic parameters to characterize LV dysfunction in patients with severe aortic valve stenosis, in which changes in diastolic parameters have been previously shown [16]. Moreover, the inter-operator variability of the CMR measurements was evaluated on a sub-group of 30 subjects.
Methods
Study population and acquisition protocols
A group of 53 subjects had an echocardiographic exam for the evaluation of LV function and a CMR exam on the same day. This group included 35 controls free from overt cardiovascular disease and 18 patients with severe aortic valve stenosis.
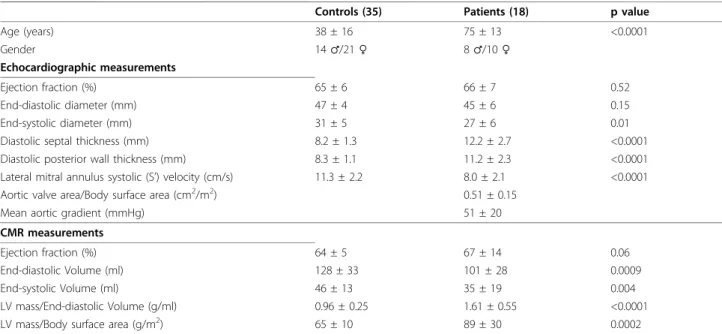
Subjects characteristics and clinical data of LV func-tion and remodeling are summarized in Table 1, for both groups. The study protocol was approved by the institutional review board and informed consent was obtained from all participants.
Doppler echocardiography was performed by an experienced echocardiographer ("top” ASE level) using a GEMS Vivid 7 system. Transmitral flow and mitral
Table 1 Controls and patients clinical characteristics
Controls (35) Patients (18) p value
Age (years) 38 ± 16 75 ± 13 <0.0001 Gender 14 ♂/21 ♀ 8 ♂/10 ♀ Echocardiographic measurements Ejection fraction (%) 65 ± 6 66 ± 7 0.52 End-diastolic diameter (mm) 47 ± 4 45 ± 6 0.15 End-systolic diameter (mm) 31 ± 5 27 ± 6 0.01
Diastolic septal thickness (mm) 8.2 ± 1.3 12.2 ± 2.7 <0.0001 Diastolic posterior wall thickness (mm) 8.3 ± 1.1 11.2 ± 2.3 <0.0001 Lateral mitral annulus systolic (S’) velocity (cm/s) 11.3 ± 2.2 8.0 ± 2.1 <0.0001 Aortic valve area/Body surface area (cm2/m2) 0.51 ± 0.15
Mean aortic gradient (mmHg) 51 ± 20
CMR measurements
Ejection fraction (%) 64 ± 5 67 ± 14 0.06
End-diastolic Volume (ml) 128 ± 33 101 ± 28 0.0009
End-systolic Volume (ml) 46 ± 13 35 ± 19 0.004
LV mass/End-diastolic Volume (g/ml) 0.96 ± 0.25 1.61 ± 0.55 <0.0001 LV mass/Body surface area (g/m2) 65 ± 10 89 ± 30 0.0002
Echocardiographic and CMR measurements obtained for both controls and patients groups as well as the statistical significance of the differences in these values between the two groups
annulus longitudinal velocities were recorded during relaxed end-of-expiration with the patient lying in supine left lateral decubitus. The transmitral early filling and atrial filling peaks (EUS and AUS) velocities and
deceleration time (DTUS), as well as the lateral annular
early peak (E’US) longitudinal velocity were measured.
All recordings were performed with simultaneous elec-trocardiographic (ECG) recording.
CMR imaging was performed using a 1.5 T MRI system (Signa HDx, GEMS, Waukesha, WI, USA). Previously acquired 2-chamber and 4-chamber views allowed posi-tioning of a retrospectively ECG-gated PC pulse sequences, in a plane perpendicular to the transmitral inflow and located below the mitral annulus at the level of the tips of the opened mitral leaflets. At this location, two dynamic PC series, corresponding to an entire car-diac cycle, were acquired during breathhold: 1) the trans-mitral flow velocity sequence (encoding velocity Venc = 180 cm/s, echo time TE = 3.1 ms, repetition time TR = 7.6 ms, views per segment = 2, view sharing was used resulting in an effective temporal resolution of 15 ms), and 2) a myocardial longitudinal velocity sequence
(Venc = 15 or 20 cm/sec, TE = 5 ms, TR = 9.5 ms, views per segment = 2, view sharing was used resulting in an effective temporal resolution of 20 ms). For both sequences, the following parameters were used: flip angle = 20°, slice thickness = 8 mm, pixel spacing = 1.9 × 1.9 mm, matrix 256 × 128. To minimize background offsets and so that acquisition duration remained compatible with breath holding, a 50% rectangular field of view was used. The mitral annulus was always at the centre of the acquired image and away from the PE-wraparound.
Blood flow and myocardial velocity PC images were transferred for off-line analysis using a custom software. This software allowed a display of velocity images using an adapted colour scale designed to distinguish through-plane velocities in both directions (Figure 1). Our software included algorithms for blood flow and tissue delineation, as well as velocity and flow rate curves analysis.
Semi-automated segmentation of blood flow velocity images
Each PC dataset included a modulus dynamic series (Figure 2a) and the associated velocity-encoded dynamic
Figure 1 Colour-coded display of the blood flow and myocardial longitudinal velocity-encoded PC images. Panel a: blood flow velocity images, selected during a systolic phase (left), in which we can visualize the aortic ejection flow, and a diastolic phase (right), in which we can visualize the transmitral filling flow. Panel b: myocardial longitudinal velocity images, selected at the beginning of the systolic phase (left) and at the beginning of the diastolic phase (right). Negative velocity values were coded in hot tones while positive velocity values were colour-coded in cold tones, to distinguish between through plane velocities in both directions.
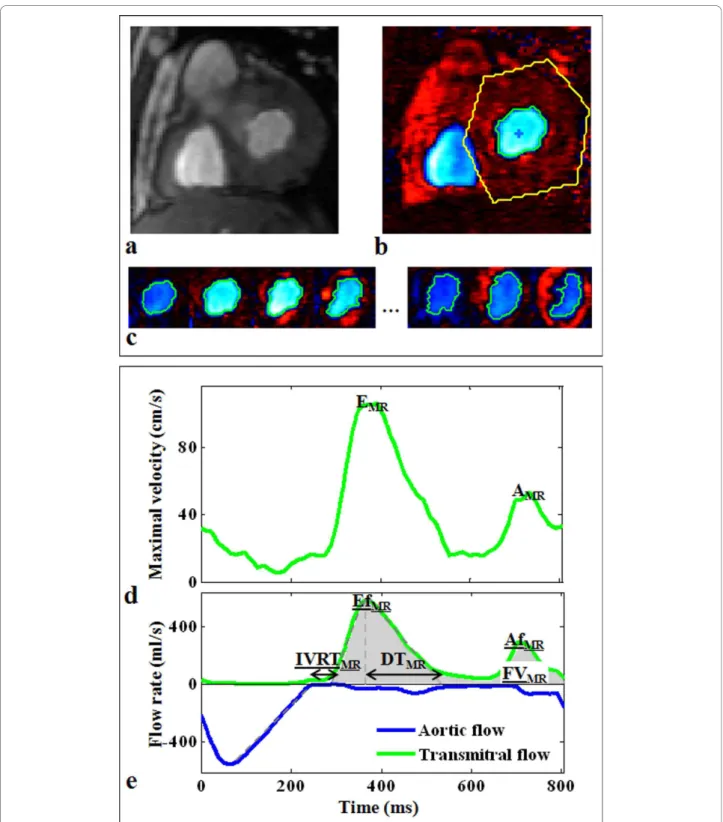
Figure 2 Example of segmentation and diastolic parameters extraction from a transmitral flow PC dataset. Top: description of the segmentation process performed semi-automatically on a velocity-encoded image after manual drawing of a rough region of interest around the transmitral flow (b). This segmentation resulted in a robust delineation of the transmitral flow pattern on each cardiac phase, as shown on the few selected phases (c) (see additional file 1: flowVideo, video file corresponding to the whole cardiac cycle). Of note, the modulus image corresponding to the phase image (b) was shown (a) to highlight the difficulty of segmenting such images. Bottom: the parameters automated extraction from the transmitral flow maximal velocity curve (d), and the transmitral (green) as well as the aortic (blue) flow rate curves (e), using the above segmentation. The estimated diastolic parameters (EMR, AMR, DTMR, IVRTMR, EfMR, AfMR, FVMR) are indicated on velocity (d) and flow rate
series (Figure 2b), acquired during an entire cardiac cycle. The modulus images described the variation in the geometry of the mitral valve orifice during the car-diac cycle. These images were difficult to segment because of the flow-related contrast variations during the cardiac cycle, as well as the variable shapes of the mitral orifice. We therefore preferred to process velocity images, which presented connected areas in terms of pixel sign, defined by the local direction of the blood flow velocity.
Based on these connectivity properties, our segmenta-tion algorithm comprised three main steps. First, a rough ROI was manually drawn on a single phase around the flow of interest (Figure 2b). This cardiac phase was automatically set to the middle of the cardiac cycle for transmitral flow segmentation and to the beginning of the cardiac cycle for aortic flow segmenta-tion. The mean velocity curve was calculated within this ROI, and the cardiac phase corresponding to its highest absolute value was detected. In the second step, this lat-ter cardiac phase was used to initialize the segmentation algorithm, by an automated detection of the biggest connected area, in terms of sign. The centre of mass of this area was calculated and reported on the neighbour-ing phases. In the third step, the biggest connected areas containing this centre of mass were detected on these neighbouring phases, and their centres of mass were used to repeat the process toward the beginning and the end of the cardiac cycle. The propagation of the centre of mass, while looking for the biggest connected area, constrained the segmentation process to track the flow of interest. This step provided a refined delineation of the blood flow pattern in each phase of the PC velo-city series (Figure 2c).
Blood flow functional parameters
After transmitral orifice segmentation, curves of maxi-mal and mean velocities, as well as flow rates (mean velocity × segmented area for each phase), were derived (Figure 2d and 2e). To reduce the effect of noise, the maximal velocity was calculated for each phase as the average of pixels velocity values greater than 95% of the maximal velocity within the segmented ROI. The PC series acquired for transmitral flow analysis were used for aortic orifice delineation, resulting in ejection flow rate curves. However, because of the important obliquity between the aortic flow and the acquisition plane, aortic flow rate curves were only used for the estimation of temporal parameters. More precisely, the aortic flow rate curve was used to estimate the end of the ejection phase (Figure 2e). This time enabled the delimitation of the diastolic period, which was used for peak detection while analyzing transmitral blood flow maximal velocity and flow rate curves. The transmitral
flow maximal velocity curve was used to estimate velo-city-related parameters (early and late peak velocities EMRand AMR), by automatically detecting the two
high-est local peaks during the defined diastolic period (Fig-ure 2d). For this detection, a temporal constraint, which consisted in requiring a minimal temporal distance of 1/ 6th of the cardiac cycle between EMR and AMR peaks,
was first used to avoid detecting possible artifactual local peaks around EMRor AMR. Then, regardless of the
magnitude, the peak that occurred first was defined as EMR, while the second was defined as AMR. Similar
pro-cessing was applied on the transmitral flow rate curve to detect the peak filling rate (EfMR, in ml/s) and the peak
atrial rate (AfMR, in ml/s) (Figure 2e). The EfMR/AfMR
ratio, as well as the peak filling rate normalized by the filling volume EfMR/FVMR(in s-1), were calculated. The
filling volume (FVMR, in ml) was defined as the area
under the transmitral flow rate curve comprised between the beginning and the end of the filling period, these times being defined as the intersection between the linear interpolation of the ascending and the des-cending slopes of the EfMRand the AfMRwaves and the
time axis, respectively. Of note, flow rate curves, being estimated from the mean velocities, were preferred to maximal velocity curves for the estimation of temporal parameters because of their expected lower sensitivity to noise.
Finally, the isovolumetric relaxation time, IVRTMR,
was estimated as the difference between the previously described beginning of the filling period and end of the ejection, and the deceleration time, DTMR, was
calcu-lated as the duration between the time to peak filling rate EfMRand the end of the EfMRwave (Figure 2e). The
end of the EfMRwave was estimated by linear
tion of its descending slope. Of note, all linear interpola-tions of ascending and descending slopes were automatically performed on the part of the curve com-prised between 40% and 70% of its maximal value, as previously presented in a study analyzing aortic velocity curves [17].
Semi-automated detection of the myocardial velocity profiles
Similar to blood flow PC data, myocardial PC datasets contained a modulus (Figure 3a) and a velocity-encoded (Figure 3b) series. Because of the basal position of the imaging plane and of the low contrast between the myo-cardium and the neighbouring structures, myocardial detection on modulus images is even more challenging than on conventional cine MR images, especially for the epicardial wall (Figure 3a). Again, velocity images were preferred for the longitudinal motion analysis. However, the connectivity process was not adapted because of the bi-directional (up and down) longitudinal motion of the
mitral annulus during a single cardiac cycle, which implies changes in velocity sign.
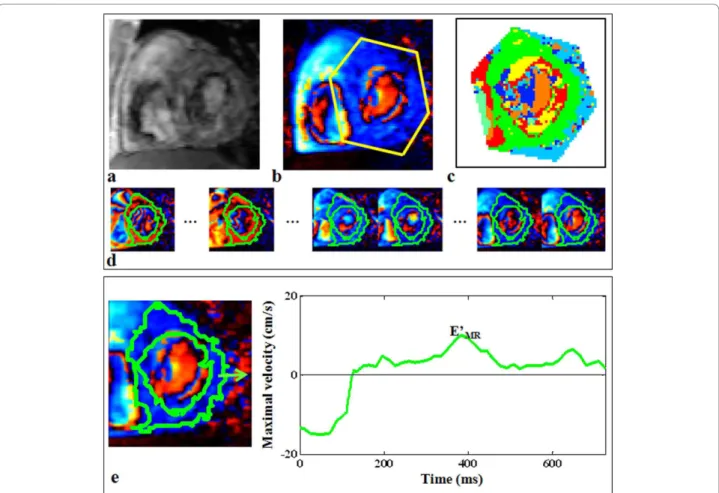
Accordingly, a classification based on the k-means algorithm [18] was applied on temporal velocity pro-files of fixed pixels during a whole cardiac cycle, within a rough ROI manually drawn around the LV on a sin-gle phase (Figure 3b). This classification allowed isolat-ing the biggest connected cluster, defined as the “myocardial” cluster (Figure 3c). We hypothesized that using the k-means classification while setting the num-ber of clusters to seven would enable isolating the cluster corresponding to fixed pixels that remain within the myocardium during the entire cardiac cycle (Figure 3d) from neighbouring structures (background or LV cavity) or from clusters in which the longitudi-nal velocity profiles were distorted by the myocardial radial contraction. Maximal and mean velocity curves can be calculated from the obtained myocardial global cluster, as well as from standardized myocardial local
segments (lateral, septal, inferior, and anterior seg-ments) [19] (Figure 3e).
Myocardial longitudinal velocities
The myocardial maximal longitudinal velocity curve, corresponding to the whole myocardium (Figure 3e), was used to derive the parameter E’MR, which was the
highest local peak occurring first during the filling per-iod. This peak velocity was used to estimate the conven-tional EMR/E’MRratio.
Evaluation of inter-operator variability
Since both flow segmentation and myocardial clustering required a manual initialization on a single phase, the inter-operator variability of our analysis in terms of blood flow segmentation, as well as functional velocity and flow rate parameters, was studied. For this evalua-tion, the whole process developed for flow and myocar-dial PC data analysis was repeated by two independent Figure 3 Example of longitudinal tissue velocity evaluation from a myocardial PC dataset. Top: detection of the myocardial cluster on a velocity-encoded image (b) using the k-means map (c), after manual drawing of a rough region of interest around the myocardium. The contours corresponding to the calculated myocardial cluster were superimposed on each cardiac phase, and shown on few selected phases (d) (see additional file 2: myocardiumVideo, video file corresponding to the whole cardiac cycle). Of note, the modulus image corresponding to the phase image (b) was shown (a) to highlight the difficulty of segmenting such images. Bottom: extraction of early peak diastolic longitudinal velocity (E’MR).
operators on a sub-group of 30 subjects including 20 controls and 10 patients.
Statistical analysis
For both controls and patients groups, mean values and standard deviations of diastolic parameters, obtained from echocardiographic and CMR data, were reported. A non-parametric Mann-Whitney test was used to eval-uate the significance of the differences between controls and patients functional parameters. A p value < 0.05 was considered as significant. In addition, Pearson cor-relation analysis was performed to compare CMR with Doppler echocardiography values. For both CMR and echocardiographic analyses, the ability of the calculated diastolic parameters to separate controls from patients, in terms of sensitivity, specificity, negative and positive predictive values (NPV and PPV) as well as the accu-racy, was evaluated using a receiver operating character-istic (ROC) analysis to define optimal thresholds.
To evaluate inter-operator variability in terms of blood flow segmentation, the percentage of overlap between the two segmentations was calculated for each cardiac phase. The means and standard deviations of these per-centages of overlap were calculated for the whole sub-group, on the diastolic period for the transmitral flow and on the systolic period for the aortic flow. Moreover, for both blood flow and myocardial parameters, inter-operator variability was calculated for each subject as the absolute difference of the repeated measurements in the percentage of their mean. These percentages were averaged on the whole sub-group.
Results
All developments, including blood flow and myocardial detection, as well as the automated extraction of func-tional parameters from velocity and flow-rate curves, were integrated in a user-friendly interface developed on Matlab (Mathworks, Natick, MA, USA). This software was used to analyze PC data of the 53 subjects. For each subject, the processing time was less than 5 minutes, on a personal computer (CPU 2.67 GHz, 3 Gb RAM).
Blood flow segmentation was reproducible, as reflected by an averaged percentage of overlap between the seg-mentations performed by two independent operators of 99.7 ± 1.6% for the transmitral flow and 98.7 ± 7.1% for the aortic flow. Table 2 summarizes the inter-operator variability for both blood flow and myocardial functional parameters averaged over the sub-group of 30 subjects.
Echocardiographic and CMR diastolic parameters
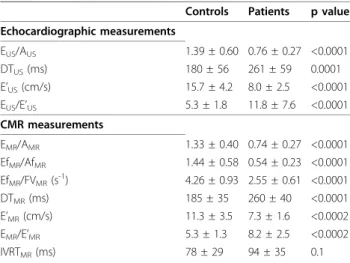
Table 3 summarizes mean values and standard devia-tions calculated for echocardiographic and CMR diasto-lic parameters on both controls and patients groups. Except for the IVRTMR, all echocardiographic and CMR
diastolic functional parameters significantly varied in patients with aortic valve stenosis when compared to the controls.
A stronger correlation and a slope closer to 1 were found for the comparison between the echocardiographic EUS/AUSand the CMR flow rate-related EfMR/AfMRthan
for the comparison with the CMR velocity-related EMR/
AMR(Figure 4a). In addition, although the CMR mitral
annulus longitudinal velocities E’MRwere lower than
echocardiographic values E’US, a good correlation was
found between these two velocities (Figure 4b).
A fair correlation was found between echocardio-graphic and CMR deceleration times DTUS and DTMR
(r = 0.56). However, a stronger relationship was found between the echocardiographic mitral annulus longitudi-nal velocities E’US and the CMR deceleration time,
DTMR, (Figure 5a) (r = 0.63, p < 0.0001) than for the
comparison between the echocardiographic mitral annu-lus longitudinal velocities and the echocardiographic deceleration time, DTUS (Figure 5b) (r = 0.40, p =
0.003).
Table 2 Diastolic parameters measurement: inter-operator variability Inter-operator variability EMR 0.14 ± 0.75% AMR 0.11 ± 0.60% E’MR 4.25 ± 5.89% DTMR 1.96 ± 2.95% EfMR 0.14 ± 0.49% AfMR 0.41 ± 1.44% FVMR 0.34 ± 0.81%
Percentage of variation in diastolic parameters estimated by two independent operators averaged on a sub-group of 30 subjects
Table 3 Echocardiographic and CMR diastolic parameters
Controls Patients p value Echocardiographic measurements EUS/AUS 1.39 ± 0.60 0.76 ± 0.27 <0.0001 DTUS(ms) 180 ± 56 261 ± 59 0.0001 E’US(cm/s) 15.7 ± 4.2 8.0 ± 2.5 <0.0001 EUS/E’US 5.3 ± 1.8 11.8 ± 7.6 <0.0001 CMR measurements EMR/AMR 1.33 ± 0.40 0.74 ± 0.27 <0.0001 EfMR/AfMR 1.44 ± 0.58 0.54 ± 0.23 <0.0001 EfMR/FVMR(s-1) 4.26 ± 0.93 2.55 ± 0.61 <0.0001 DTMR(ms) 185 ± 35 260 ± 40 <0.0001 E’MR(cm/s) 11.3 ± 3.5 7.3 ± 1.6 <0.0002 EMR/E’MR 5.3 ± 1.3 8.2 ± 2.5 <0.0002 IVRTMR(ms) 78 ± 29 94 ± 35 0.1
Mean values and standard deviations of the diastolic parameters calculated for controls and patients. Statistical significance of changes in diastolic parameters between controls and patients is provided
Abnormality detection
Table 4 summarizes the values of sensibility, specificity, negative and positive predictive values, and the overall accuracy obtained from the ROC analysis performed for each echocardiographic and CMR diastolic parameter on the 35 controls and the 18 patients with aortic valve stenosis. CMR diastolic parameters enabled abnormality detection with equivalent accuracy than the well estab-lished echocardiographic parameters. Indeed, all CMR parameters characterized the LV abnormality with a sensitivity and specificity above 0.80 and an accuracy above 0.85.
Discussion
The early diagnosis of diastolic dysfunction has an important prognostic value and may impact the man-agement strategy and the follow-up of patients with incipient heart failure. Although CMR is known as the
modality of choice for the evaluation of global LV func-tion [20,21], systolic funcfunc-tion and myocardial viability [22,23], Doppler echocardiography remains the clinical reference for the evaluation of diastolic dysfunction [4,24,25]. Several CMR studies, based on volume varia-tion curves extracted from cine images [26-29] or on velocity and flow rate curves extracted from PC images [8-15], reported capabilities of this modality for the assessment of diastolic function. However, despite these methodological developments and the recent technologi-cal improvements in PC-CMR sequences, the use of CMR in clinical evaluation of diastolic function remains limited because of the lack of automated methods designed for the analysis of PC images. Indeed, most of the PC-CMR studies previously presented in the litera-ture were based on manual positioning of ROIs on each phase of the cardiac cycle [8-15]. This manual position-ing is time-consumposition-ing [30] and subjective [8], leadposition-ing to Figure 4 Comparison between echocardiographic and CMR early to late peak ratios and mitral annulus peak longitudinal velocities. Panel a: comparison of the CMR velocity (EMR/AMR) and flow rate (EfMR/AfMR) ratios against the echocardiographic velocity ratio (EUS/AUS). Panel
b: comparison between the mitral annulus peak longitudinal velocities estimated from echocardiographic data (E’US) and CMR data (E’MR).
Figure 5 Comparison of the echocardiographic and the CMR deceleration times against the echocardiographic mitral annulus peak longitudinal velocity. Panel a: comparison between the echocardiographic mitral annulus peak longitudinal velocity (E’US) and the CMR
deceleration time (DTMR). Panel b: comparison between the echocardiographic mitral annulus peak longitudinal velocity (E’US) and the
inter- and intra-operator variability, as reflected by the previously reported variability coefficient of 10% [31]. Accordingly, our primary goal was to minimize manual intervention to reduce variability and shorten the pro-cessing time. The final objective was to test the ability of the resulting CMR diastolic parameters to character-ize LV diastolic dysfunction.
To achieve this aim, we first developed a connectivity-based technique for a semi-automated segmentation of the transmitral and the aortic flows patterns on blood velocity PC series. Because of the connectivity property, our technique is not related to the geometrical shape of the flow, which is an important feature of our technique. Thanks to this property, our segmentation method can be easily used for the delineation of various flow pat-terns, such as LV and right ventricular flows. In the pre-sent study, this segmentation was successfully used on the transmitral and the aortic flows of 53 subjects and was shown to be reproducible in a group of 30 sub-jects, in terms of area overlap and functional para-meters. The combination of this robust segmentation with an automated analysis of the derived velocity and flow rate curves enabled the estimation of consistent diastolic parameters. Indeed, despite the underestima-tion of velocity values, the comparison between the CMR and the echocardiographic E/A ratio revealed a good correlation. This correlation was higher and the slope of the linear interpolation between the CMR and the echocardiographic measurements was closer to one when considering the flow rate curves for the estimation of this ratio (EfMR/AfMR). This finding might be related
to the fact that flow rates are less sensitive to the shape of the velocity profile and to the slight mismatch between the acquisition plane and the true perpendicu-lar to the transmitral flow.
In addition, the proposed flow rate-related parameters EfMR/AfMRand EfMR/FVMRresulted in a higher accuracy
than the other CMR parameters, when used for LV
diastolic dysfunction characterization (Table 4). Also, the CMR deceleration time estimated from the flow rate curve was more sensitive and more accurate than the echocardiographic deceleration time for the separation between controls and patients. The slight superiority of the flow rate-related parameters can be explained by the fact that flow rate curves are less sensitive to data noise than conventional maximal velocity curves, since they are estimated from the averaged velocity throughout the blood flow surface.
Secondly, a clustering technique [18] was used for an automated classification of velocity profiles from tissue velocity PC-CMR data. It enabled isolating the myocar-dial cluster and the corresponding maximal velocity curve during the cardiac cycle. To the best of our knowl-edge, the estimation of myocardial longitudinal velocities in the setting of diastolic function was previously pre-sented in only few PC-CMR studies [8,11,13] and the positioning of myocardial ROIs was always done manu-ally. In the present study, the only manual intervention was the positioning of a rough ROI around the LV, resulting in a very small inter-operator variability of the myocardial annular early peak longitudinal velocity E’MR
(4.25 ± 5.89%). This variability was significantly lower than the 10% variability previously reported in a CMR study [31]. Of note, inter-operator variability of our CMR evaluation is also significantly lower than those pre-viously reported in echocardiographic studies [25,32].
The comparison between CMR and echocardiographic mitral annulus longitudinal peak velocity resulted in a higher coefficient of correlation than r = 0.49 presented in a previous CMR study [8]. However, our CMR veloci-ties were lower than the echocardiographic values. This might be due to the fact that Doppler values are derived from the envelop of the spectrum and to the difference in temporal resolution between the two techniques. Despite this underestimation, our CMR longitudinal velocity was significantly reduced in patients with severe
Table 4 Ability of echocardiographic and CMR diastolic parameters to separate controls from patients
Sensitivity Specificity NPV PPV Accuracy ROC threshold AUC Echocardiographic measurements EUS/AUS 0.78 0.94 0.88 0.89 0.89 0.77 0.89 DTUS(ms) 0.83 0.76 0.65 0.90 0.79 212 0.84 EUS/E’US 0.89 0.83 0.73 0.94 0.85 6.23 0.88 CMR measurements EMR/AMR 0.83 0.89 0.79 0.91 0.87 0.86 0.91 EfMR/AfMR 0.83 0.91 0.83 0.91 0.89 0.71 0.95 EfMR/FVMR(s-1) 0.89 0.91 0.84 0.94 0.91 3.17 0.95 DTMR(ms) 0.94 0.80 0.71 0.97 0.85 200 0.92 EMR/E’MR 0.80 0.87 0.75 0.90 0.85 6.5 0.84
Results of the receiver operating characteristic (ROC) analysis performed to calculate the sensitivity, specificity, negative and positive predictive values (NPV and PPV) and accuracy of each parameter. The ROC threshold and the area under the ROC curve (AUC) are provided
aortic valve stenosis and the resulting ratio EMR/E’MR
characterized LV dysfunction with a lower sensitivity than the echocardiographic ratio, but a higher specificity and an equivalent accuracy.
The differences in diastolic parameters found between echocardiography and CMR can be explained by the dif-ferences in imaging principles of the two techniques, including the difficulties of plane or beam positioning, but also by technical limitations inherent to the CMR acquisitions. These limitations included the limited tem-poral resolution of PC-CMR imaging as opposed to Doppler echocardiography, and the presence of phase offset errors, which were not corrected in the present study but were minimized using a 50% rectangular field of view centred on the mitral annulus. Alternatively, these errors can be corrected using techniques pre-sented in previous studies [33-35]. Despite these techni-cal limitations, high correlations were found between CMR and echocardiographic parameters and, more importantly, PC-CMR parameters were able to charac-terize LV diastolic dysfunction with the same accuracy than the echocardiographic indices.
Conclusions
Our semi-automated method was fast, reproducible and was successfully used on PC-CMR blood flow and myo-cardial data of 53 subjects, including controls and patients with severe aortic valve stenosis and a preserved ejection fraction. This application enabled the estimation of velo-city and flow rate-related diastolic parameters, which were highly correlated with echocardiographic measurements. In addition, significant differences were found between PC-CMR diastolic parameters estimated in controls and in patients with aortic valve stenosis, resulting in a high accu-racy of the CMR characterization of LV diastolic dysfunc-tion. Importantly, equivalent accuracy was found for both echocardiographic and CMR parameters, indicating a potential clinical usefulness of CMR for the evaluation of diastolic function, which however should be confirmed by additional studies performed on larger populations with subtle to severe diastolic dysfunction.
Additional material
Additional file 1: Example of transmitral and aortic flow detection on all phases of the cardiac cycle. Beginning of the video (systolic phase): the contours corresponding to the aortic flow were superimposed on each colour-coded velocity image. End of the video (diastolic phase): the contours corresponding to the transmitral flow were superimposed on each colour-coded velocity image.
Additional file 2: Example of the superimposition of the myocardial cluster on all phases of the cardiac cycle. The myocardial cluster defined by the k-means algorithm is superimposed on the colour-coded myocardial PC velocity images.
Acknowledgements
Nadjia Kachenoura is supported by a grant from “la Fondation Lefoulon-Delalande-Institut de France”.
Author details
1
INSERM U678/UPMC Univ Paris 6, 91 Bd de l’Hôpital, 75013 Paris, France.
2Radiology department, APHP, European Hospital Georges Pompidou, 20 rue
Leblanc, 75015 Paris, France.3Echocardiography department, APHP, European Hospital Georges Pompidou, 20 rue Leblanc, 75015 Paris, France. Authors’ contributions
EB and NK participated in the design of the study, in the technical developments, and in writing the manuscript. AR participated in the interpretation of the CMR data and in revising the manuscript. SCG, CD, MLa and LP participated in the acquisition and interpretation of
echocardiographic data. MLe participated in data processing for the reproducibility study. ADC and AH participated in the technical developments. BD and EM participated in the design and coordination of the study. All authors read and participated in revising the manuscript. They all approved its final version.
Competing interests
The authors declare that they have no competing interests. Received: 16 June 2010 Accepted: 9 November 2010 Published: 9 November 2010
References
1. Zile MR, Baicu CF, Gaasch WH: Diastolic heart failure–abnormalities in active relaxation and passive stiffness of the left ventricle. N Engl J Med 2004, 350:1953-1959.
2. Achong N, Wahi S, Marwick TH: Evolution and outcome of diastolic dysfunction. Heart 2009, 95:813-818.
3. Persson H, Lonn E, Edner M, Baruch L, Lang CC, Morton JJ, Ostergren J, McKelvie RS: Diastolic dysfunction in heart failure with preserved systolic function: need for objective evidence:results from the CHARM Echocardiographic Substudy-CHARMES. J Am Coll Cardiol 2007, 49:687-694.
4. Nagueh SF, Appleton CP, Gillebert TC, Marino PN, Oh JK, Smiseth OA, Waggoner AD, Flachskampf FA, Pellikka PA, Evangelista A:
Recommendations for the evaluation of left ventricular diastolic function by echocardiography. J Am Soc Echocardiogr 2009, 22:107-133.
5. Bess RL, Khan S, Rosman HS, Cohen GI, Allebban Z, Gardin JM: Technical aspects of diastology: why mitral inflow and tissue Doppler imaging are the preferred parameters? Echocardiography 2006, 23:332-339.
6. Karwatowski SP, Mohiaddin R, Yang GZ, Firmin DN, Sutton MS, Underwood SR, Longmore DB: Assessment of regional left ventricular long-axis motion with MR velocity mapping in healthy subjects. J Magn Reson Imaging 1994, 4:151-155.
7. Kayser HW, van der Geest RJ, van der Wall EE, Duchateau C, de Roos A: Right ventricular function in patients after acute myocardial infarction assessed with phase contrast MR velocity mapping encoded in three directions. J Magn Reson Imaging 2000, 11:471-475.
8. Paelinck BP, de Roos A, Bax JJ, Bosmans JM, van Der Geest RJ, Dhondt D, Parizel PM, Vrints CJ, Lamb HJ: Feasibility of tissue magnetic resonance imaging: a pilot study in comparison with tissue Doppler imaging and invasive measurement. J Am Coll Cardiol 2005, 45:1109-1116.
9. Brandts A, van Elderen SG, Westenberg JJ, van der Grond J, van Buchem MA, Huisman MV, Kroft LJ, Tamsma JT, de Roos A: Association of aortic arch pulse wave velocity with left ventricular mass and lacunar brain infarcts in hypertensive patients: assessment with MR imaging. Radiology 2009, 253:681-688.
10. Hartiala JJ, Mostbeck GH, Foster E, Fujita N, Dulce MC, Chazouilleres AF, Higgins CB: Velocity-encoded cine MRI in the evaluation of left ventricular diastolic function: measurement of mitral valve and pulmonary vein flow velocities and flow volume across the mitral valve. Am Heart J 1993, 125:1054-1066.
11. Marsan NA, Westenberg JJ, Tops LF, Ypenburg C, Holman ER, Reiber JH, de Roos A, van der Wall EE, Schalij MJ, Roelandt JR, Bax JJ: Comparison between tissue Doppler imaging and velocity-encoded magnetic
resonance imaging for measurement of myocardial velocities, assessment of left ventricular dyssynchrony, and estimation of left ventricular filling pressures in patients with ischemic cardiomyopathy. Am J Cardiol 2008, 102:1366-1372.
12. Paelinck BP, Lamb HJ, Bax JJ, van der Wall EE, de Roos A: MR flow mapping of dobutamine-induced changes in diastolic heart function. J Magn Reson Imaging 2004, 19:176-181.
13. Paelinck BP, Vrints CJ, Bax JJ, Bosmans JM, de Roos A, Lamb HJ: Tissue cardiovascular magnetic resonance demonstrates regional diastolic dysfunction in remote tissue early after inferior myocardial infarction. J Cardiovasc Magn Reson 2007, 9:877-882.
14. Rathi VK, Doyle M, Yamrozik J, Williams RB, Caruppannan K, Truman C, Vido D, Biederman RW: Routine evaluation of left ventricular diastolic function by cardiovascular magnetic resonance: a practical approach. J Cardiovasc Magn Reson 2008, 10:36.
15. Rubinshtein R, Glockner JF, Feng D, Araoz PA, Kirsch J, Syed IS, Oh JK: Comparison of magnetic resonance imaging versus Doppler
echocardiography for the evaluation of left ventricular diastolic function in patients with cardiac amyloidosis. Am J Cardiol 2009, 103:718-723. 16. Bruch C, Stypmann J, Grude M, Gradaus R, Breithardt G, Wichter T: Tissue
Doppler imaging in patients with moderate to severe aortic valve stenosis: clinical usefulness and diagnostic accuracy. Am Heart J 2004, 148:696-702.
17. Grotenhuis HB, Westenberg JJ, Steendijk P, van der Geest RJ, Ottenkamp J, Bax JJ, Jukema JW, de Roos A: Validation and reproducibility of aortic pulse wave velocity as assessed with velocity-encoded MRI. J Magn Reson Imaging 2009, 30:521-526.
18. Hartigan J, Wong M: k-means clustering algorithm. Applied Statistics 1979, 28:100-108.
19. Cerqueira MD, Weissman NJ, Dilsizian V, Jacobs AK, Kaul S, Laskey WK, Pennell DJ, Rumberger JA, Ryan T, Verani MS: Standardized myocardial segmentation and nomenclature for tomographic imaging of the heart: a statement for healthcare professionals from the Cardiac Imaging Committee of the Council on Clinical Cardiology of the American Heart Association. Circulation 2002, 105:539-542.
20. Sechtem U, Pflugfelder PW, Gould RG, Cassidy MM, Higgins CB:
Measurement of right and left ventricular volumes in healthy individuals with cine MR imaging. Radiology 1987, 163:697-702.
21. Thiele H, Paetsch I, Schnackenburg B, Bornstedt A, Grebe O, Wellnhofer E, Schuler G, Fleck E, Nagel E: Improved accuracy of quantitative assessment of left ventricular volume and ejection fraction by geometric models with steady-state free precession. J Cardiovasc Magn Reson 2002, 4:327-339.
22. Gerber BL, Garot J, Bluemke DA, Wu KC, Lima JA: Accuracy of contrast-enhanced magnetic resonance imaging in predicting improvement of regional myocardial function in patients after acute myocardial infarction. Circulation 2002, 106:1083-1089.
23. Gerber BL, Lima JA, Garot J, Bluemke DA: Magnetic resonance imaging of myocardial infarct. Top Magn Reson Imaging 2000, 11:372-382.
24. Cohen GI, Pietrolungo JF, Thomas JD, Klein AL: A practical guide to assessment of ventricular diastolic function using Doppler echocardiography. J Am Coll Cardiol 1996, 27:1753-1760.
25. Nagueh SF, Middleton KJ, Kopelen HA, Zoghbi WA, Quinones MA: Doppler tissue imaging: a noninvasive technique for evaluation of left ventricular relaxation and estimation of filling pressures. J Am Coll Cardiol 1997, 30:1527-1533.
26. Hoff FL, Turner DA, Wang JZ, Barron JT, Chutuape MD, Liebson PR: Semiautomatic evaluation of left ventricular diastolic function with cine magnetic resonance imaging. Acad Radiol 1994, 1:237-242.
27. Kawaji K, Codella NC, Prince MR, Chu CW, Shakoor A, LaBounty TM, Min JK, Swaminathan RV, Devereux RB, Wang Y, Weinsaft JW: Automated segmentation of routine clinical cardiac magnetic resonance imaging for assessment of left ventricular diastolic dysfunction. Circ Cardiovasc Imaging 2009, 2:476-484.
28. Kudelka AM, Turner DA, Liebson PR, Macioch JE, Wang JZ, Barron JT: Comparison of cine magnetic resonance imaging and Doppler echocardiography for evaluation of left ventricular diastolic function. Am J Cardiol 1997, 80:384-386.
29. Sechtem U, Pflugfelder PW, White RD, Gould RG, Holt W, Lipton MJ, Higgins CB: Cine MR imaging: potential for the evaluation of cardiovascular function. AJR Am J Roentgenol 1987, 148:239-246.
30. Westenberg JJ, Roes SD, Ajmone Marsan N, Binnendijk NM, Doornbos J, Bax JJ, Reiber JH, de Roos A, van der Geest RJ: Mitral valve and tricuspid valve blood flow: accurate quantification with 3D velocity-encoded MR imaging with retrospective valve tracking. Radiology 2008, 249:792-800. 31. Westenberg JJ, Lamb HJ, van der Geest RJ, Bleeker GB, Holman ER,
Schalij MJ, de Roos A, van der Wall EE, Reiber JH, Bax JJ: Assessment of left ventricular dyssynchrony in patients with conduction delay and idiopathic dilated cardiomyopathy: head-to-head comparison between tissue doppler imaging and velocity-encoded magnetic resonance imaging. J Am Coll Cardiol 2006, 47:2042-2048.
32. Fast J, Van Dam I, Heringa A, De Boo T, Alsters J, Hopman J, Daniels O, Van den Merkhof L: Limits of reproducibility of mitral pulsed Doppler spectra. Am J Cardiol 1988, 61:891-894.
33. Chernobelsky A, Shubayev O, Comeau CR, Wolff SD: Baseline correction of phase contrast images improves quantification of blood flow in the great vessels. J Cardiovasc Magn Reson 2007, 9:681-685.
34. Gatehouse PD, Rolf MP, Graves MJ, Hofman MB, Totman J, Werner B, Quest RA, Liu Y, von Spiczak J, Dieringer M, et al: Flow measurement by cardiovascular magnetic resonance: a multi-centre multi-vendor study of background phase offset errors that can compromise the accuracy of derived regurgitant or shunt flow measurements. J Cardiovasc Magn Reson 2010, 12:5.
35. Holland BJ, Printz BF, Lai WW: Baseline correction of phase-contrast images in congenital cardiovascular magnetic resonance. J Cardiovasc Magn Reson 2010, 12:11.
doi:10.1186/1532-429X-12-63
Cite this article as: Bollache et al.: Automated left ventricular diastolic function evaluation from phase-contrast cardiovascular magnetic resonance and comparison with Doppler echocardiography. Journal of Cardiovascular Magnetic Resonance 2010 12:63.
Submit your next manuscript to BioMed Central and take full advantage of:
• Convenient online submission
• Thorough peer review
• No space constraints or color figure charges
• Immediate publication on acceptance
• Inclusion in PubMed, CAS, Scopus and Google Scholar
• Research which is freely available for redistribution
Submit your manuscript at www.biomedcentral.com/submit