Publisher’s version / Version de l'éditeur:
Vous avez des questions? Nous pouvons vous aider. Pour communiquer directement avec un auteur, consultez la
première page de la revue dans laquelle son article a été publié afin de trouver ses coordonnées. Si vous n’arrivez pas à les repérer, communiquez avec nous à [email protected].
Questions? Contact the NRC Publications Archive team at
[email protected]. If you wish to email the authors directly, please see the first page of the publication for their contact information.
https://publications-cnrc.canada.ca/fra/droits
L’accès à ce site Web et l’utilisation de son contenu sont assujettis aux conditions présentées dans le site LISEZ CES CONDITIONS ATTENTIVEMENT AVANT D’UTILISER CE SITE WEB.
The 9th International Work-Conference on Artificial Neural Networks
(IWANN'2007) (Computational and Ambient Intelligence) [Proceedings], 2007
READ THESE TERMS AND CONDITIONS CAREFULLY BEFORE USING THIS WEBSITE.
https://nrc-publications.canada.ca/eng/copyright
NRC Publications Archive Record / Notice des Archives des publications du CNRC :
https://nrc-publications.canada.ca/eng/view/object/?id=528b1786-1a7a-47b0-9d02-d7fbf1744e60
https://publications-cnrc.canada.ca/fra/voir/objet/?id=528b1786-1a7a-47b0-9d02-d7fbf1744e60
NRC Publications Archive
Archives des publications du CNRC
This publication could be one of several versions: author’s original, accepted manuscript or the publisher’s version. / La version de cette publication peut être l’une des suivantes : la version prépublication de l’auteur, la version acceptée du manuscrit ou la version de l’éditeur.
Access and use of this website and the material on it are subject to the Terms and Conditions set forth at
Neural Network Based Virtual Reality Spaces for Visual Data Mining of
Cancer Data: An Unsupervised Perspective
Neural Network Based Virtual Reality
Spaces for Visual Data Mining of Cancer
Data: An Unsupervised Perspective*
Romero, E., Valdés, J., and Barton, A.
2007
* Proceedings: IWANN 2007. Lecture Notes in Computer Science. 2007. NRC 49299.
Copyright 2007 by
National Research Council of Canada
Permission is granted to quote short excerpts and to reproduce figures and tables from this report, provided that the source of such material is fully acknowledged.
Neural Network Based Virtual Reality Spaces
for Visual Data Mining of Cancer Data: An
Unsupervised Perspective
Enrique Romero1, Julio J. Vald´es2, and Alan J. Barton31
Dept. of Languages and Information Systems, Polytechnic University of Catalonia c/ Jordi Girona, 1-3, 08034 Barcelona, Spain
2
National Research Council Canada
M50 1200 Montreal Rd, Ottawa, ON K1A 0R6, Canada, [email protected],
3
National Research Council Canada
M50 1200 Montreal Rd, Ottawa, ON K1A 0R6, Canada, [email protected],
Abstract. Three microarray gene expression cancer databases are rep-resented using neural networks and visual data mining with virtual real-ity spaces. The databases contains dats from cancerous and noncancer-ous tissues. In order to understand the structure of the data, structure-preserving virtual spaces are constructed using Samann neural networks. High quality visual representations are obtained. For the databases un-der study, the vitual spaces are clearly polarized with two distribution modes, each one corresponding to a different class.
1
Introduction
????? — Pendiente
2
Neural Networks for the Construction of Virtual
Reality Spaces
Virtual reality spaces for the visual representation of information systems [1, 2] were introduced in [3]. The typical desiderata for the visual representation of data and knowledge can be formulated in terms of minimizing information loss, maximizing structure preservation, maximizing class separability, or their combination, which leads to single or multi-objective optimization problems. In many cases, these concepts can be expressed deterministically using continuous functions with well defined partial derivatives. This is the realm of classical optimization where there is a plethora of methods with well known properties. In the case of heterogeneous information the situation is more complex and other techniques are required [4].
In the unsupervised case, the function f mapping the original space to the virtual reality (geometric) space m can be constructed as to maximize some
metric/non-metric structure preservation criteria as is typical in multidimen-sional scaling [5], or minimize some error measure of information loss [6]. A typical error measure is:
Sammon Error =P 1 i<jδij P i<j (δij−ζij)2 δij (1)
where δij is a dissimilarity measure between any two objects i, j in the
origi-nal space, and ζivjv is another dissimilarity measure defined on objects iv, jv of
the virtual reality space (the images of i, j under f ). Usually, the mappings f obtained using approaches of this kind are implicit because the images of the objects in the new space are computed directly. However, a functional represen-tation of f can be obtained with neural networks: the Samann network. This is a feedforward network and its architecture consists of an input layer with as many neurons as descriptor attributes, an output layer with as many neurons as the dimension of the virtual reality space and one or more hidden layers. The classical way of training the Samann network is described in [7].
3
Cancer Data Sets Description
We selected three microarray gene expression cancer databases related to three of the leading causes of cancer death in the world.
3.1 Gastric Cancer Data
A study of genes that are differentially expressed in cancerous and noncancerous human gastric tissues was performed in [8]. The original database contained 30 samples (22 tumor, 8 normal) that were analyzed by oligonucleotide microarray, obtaining the expression profiles for 6936 genes (7129 attributes). Using the 6272 genes that passed a prefilter procedure, cancerous and noncancerous tissues were successfully distinguihed with a two-dimensional hierarchical clustering using Pearson’s correlation. However, the clustering results used most of the genes on the array. To identify the genes that were differentially expressed between cancer and noncancerous tissues, a Mann-Whitney’s U test was applied to the data. As a results of this analysis, 162 and 129 genes showed a higher expression in cancerous and noncancerous tissues, respectively. In addition, several genes associated with lymph node metastasis and histological classification (intestinal, diffuse) were identified.
3.2 Lung Cancer Data
Gene expressions were compared in [9] for severely emphysematous lung tissue (from smokers at lung volume reduction surgery) and normal or mildly emphyse-matous lung tissue (from smokers undergoing resection of pulmonary nodules).
The original database contained 30 samples (18 severe emphysema, 12 mild or no emphysema), with 22283 attributes. Genes with large detection P -vales were filtered out, leading to a data set with 9336 genes, that were used for the sub-sequent analysis. Nine classification algorithms were used to identify a group of genes whose expression in the lung distinguished severe emphysema from mild or no emphysema. First, model selection was performed for every algorithm by leave-one-out cross-validation, and the gene list corresponding to the best model was saved. The 102 genes reported by at least four classification algorithms were chosen for further analysis. With these genes, a two-dimensional hierarchical clustering using Pearson’s correlation was performed that distinguished between severe emphysema and mild or no emphysema. Other genes were also identified that may be causally involved in the pathogenesis of the emphysema.
3.3 Liver Cancer Data
Zebrafish liver tumors were analyzed and compared with human liver tumors in [10]. First, liver tumors in zebrafish were generated by treating them with car-cinogens. Then, the expression profiles of zebrafish liver tumors were compared with those of zebrafish normal liver tissues using a Wilcoxon rank-sum test. The original database had 20 samples (10 normal, 10 tumor) and 16512 attributes. As a result of this comparison, a zebrafish liver tumor differentially expressed gene set consisting of 2315 gene features was obtained. This data set was used for the comparison with human tumors. The results suggest that the molecular similar-ities between zebrafish and human liver tumors are greater than the molecular similarities between other types of tumors (gastric, lung and prostate).
4
Experiments
4.1 Experimental Setting
Data sets. We tested the aforementioned original microarray gene expression databases for gastric [8] (7129 attributes, 22 tumor and 8 normal samples), lung [9] (22283 attributes, 18 severe emphysema and 12 mild or no emphysema sam-ples) and liver cancer [10] (16512 attributes, 10 normal and 10 tumor samsam-ples). These databases can be found at ???no se si son publicas???.
Data preprocessing.For gastric and lung data, each gene was scaled to mean zero and standard deviation one (original data were not normalized). For liver data, no transformation was performed (original data were log2ratios).
Model training. For every data set, Samann networks were constructed to map the original data to a 3-D virtual reality space. The activation functions used were sinusoidal for the first hidden layer and hyperbolic tangent for the rest. A collection of models was obtained by varying some of the network con-trolling parameters (number of units and weights range in the first hidden layer,
Sammon Error
Data Set Minimum Maximum Mean Std.Dev. Gastric Cancer 0.062950 0.077452 0.072862 0.003346 Lung Cancer 0.079242 0.107842 0.094693 0.006978 Liver Cancer 0.039905 0.055640 0.049857 0.003621 Table 1.Statistics of the best 1000 Samann networks obtained.
learning rates, momentum, number of iterations, random seeds), for a total of 1944 Samann networks for every data set.
Computing environment.All of the experiments were conducted on a Condor pool (http://www.cs.wisc.edu/condor/) located at the Institute for Informa-tion Technology, NaInforma-tional Research Council Canada.
4.2 Results
The distributions of the Sammon error showed a good behavior, since it was skewed towards the smallest errors and fluctuating within a narrow range. In table 1 some statistics of the experiments can be found: minimum, maximum, mean and standard deviation for the best (i.e., with smallest Sammon error) 1000 networks.
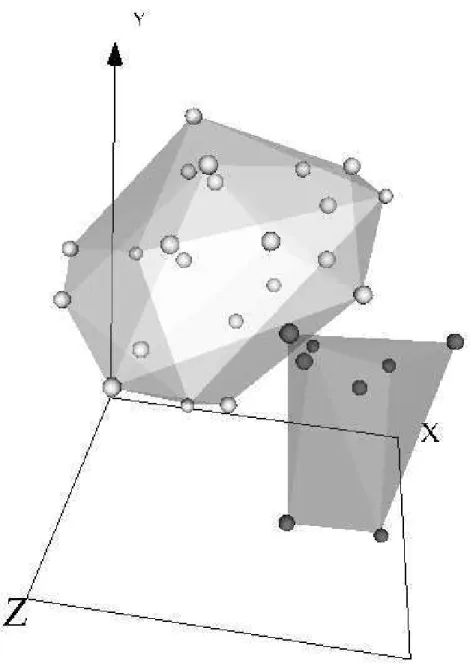
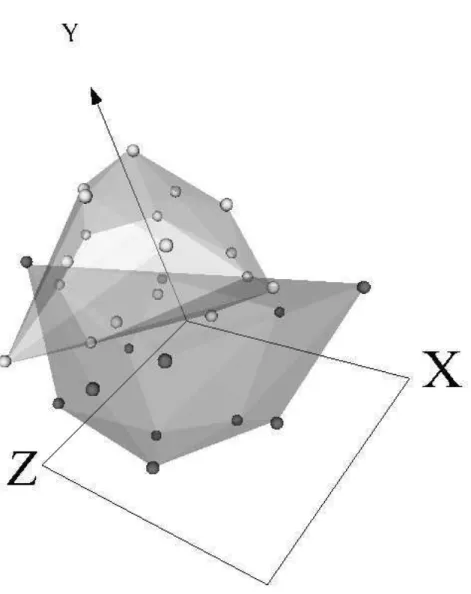
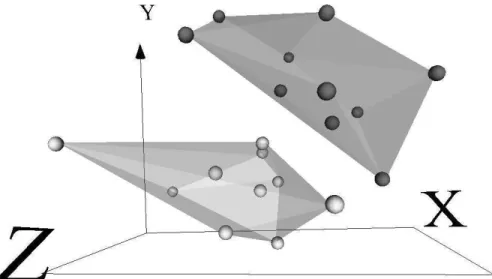
Clearly, it is impossible to represent a virtual reality space on printed me-dia (navigation, interaction, and world changes are all lost). Therefore, only snapshots can be presented. Figures 1, 2 and 3 show the virtual reality spaces corresponding to the best networks for the gastric, lung and liver cancer data sets respectively. Although the mapping was generated from an unsupervised perspective (i.e., without looking at the class labels), points of every class were labelled a posteriori. Transparent membranes wrap the corresponding classes.
The low value of the Sammon error indicates that the spaces preserved most of the distance structure of the data, therefore, giving a good idea about the distribution in the original spaces. The three vitual spaces are clearly polarized with two distribution modes, each one corresponding to a different class. Note, however, that classes are more crearly differentiated for the liver and gastric data sets than for the lung data set, where a certain level of overlapping exists. In this case, data seems to be placed in a spherical surface, with classes roughly separated by a hyperplane (in the virtual space).
The advantage of using Samann networks is that, since the mapping f be-tween the original and the virtual space is explicit, a new sample can be easily transformed and visualized in the virtual space. Since the distance between any two objects is an indication of their dissimilarity, the new point is more likely to belong to the same class of its nearest neighbors. This helps ???la toma de decisiones??? and avoids numerical computations from scratch (clustering or classification procedures, see section 3)
5
Conclusions
????? — Pendiente
Acknowledgments
This work was partially supported by the Consejo Interministerial de Ciencia y Tecnolog´ıa (CICYT), under projects CGL2004-04702-C02-02 and TIN2006-08114.
References
1. Pawlak, Z.: Rough Sets: Theoretical Aspects of Reasoning About Data. Kluwer Academic Publishers (1991)
2. Vald´es, J.J.: Similarity-based Heterogeneous Neurons in the Context of General Observational Models. Neural Network World 12(5) (2002) 499–508
3. Vald´es, J.J.: Virtual Reality Representation of Information Systems and Deci-sion Rules: An Exploratory Tool for Understanding Data and Knowledge. In: International Conference on Rough Sets, Fuzzy Sets, Data Mining and Granular Computing (LNAI 2639). (2003) 615–618
4. Vald´es, J.J.: Building Virtual Reality Spaces for Visual Data Mining with Hybrid Evolutionary-classical Optimization: Application to Microarray Gene Expression Data. In: IASTED International Joint Conference on Artificial Intelligence and Soft Computing. (2004) 161–166
5. Borg, I., Lingoes, J.: Multidimensional Similarity Structure Analysis. Springer-Verlag (1987)
6. Sammon, J.W.: A Non-linear Mapping for Data Structure Analysis. IEEE Trans-actions on Computers C-18 (1969) 401–408
7. Mao, J., Jain, A.K.: Artificial Neural Networks for Feature Extraction and Multi-variate Data Projection. IEEE Transactions on Neural Networks 6 (1995) 296–317 8. Hippo, Y., Taniguchi, H., Tsutsumi, S., Machida, N., Chong, J.M., Fukayama, M., Kodama, T., Aburatani, H.: Global Gene Expression Analysis of Gastric Cancer by Oligonucleotide Microarrays. Cancer Research 62(1) (2002) 233–240
9. Spira, A., Beane, J., Pinto-Plata, V., Kadar, A., Liu, G., Shah, V., Celli, B., Brody, J.S.: Gene Expression Profiling of Human Lung Tissue from Smokers with Severe Emphysema. American Journal of Respiratory Cell and Molecular Biology 31 (2004) 601–610
10. Lam, S.H., Wu, Y.L., Vega, V.B., Miller, L.D., Spitsbergen, J., Tong, Y., Zhan, H., Govindarajan, K.R., Lee, S., Mathavan, S., Murthy, K.R.K., Buhler, D.R., Liu, E.T., Gong, Z.: Conservation of Gene Expression Signatures between Zebrafish and Human Tumors and Tumor Progression. Nature Biotechnology 24(1) (2006) 73–75
Fig. 1.Virtual reality space of the gastric cancer data set (Sammon error = 0.063). Dark and light spheres are noncancerous and cancerous samples, respectively. Trans-parent membranes wrap the corresponding classes.
Fig. 2. Virtual reality space of the lung cancer data set (Sammon error = 0.079). Dark and light spheres are severe emphysema and no or mild emphysema, respectively. Transparent membranes wrap the corresponding classes.
Fig. 3.Virtual reality space of the liver cancer data set (Sammon error = 0.040). Dark and light spheres are normal and tumor samples, respectively. Transparent membranes wrap the corresponding classes.