Publisher’s version / Version de l'éditeur:
Analytical Chemistry, 90, 6, pp. 4112-4118, 2018-03-01
READ THESE TERMS AND CONDITIONS CAREFULLY BEFORE USING THIS WEBSITE. https://nrc-publications.canada.ca/eng/copyright
Vous avez des questions? Nous pouvons vous aider. Pour communiquer directement avec un auteur, consultez la
première page de la revue dans laquelle son article a été publié afin de trouver ses coordonnées. Si vous n’arrivez pas à les repérer, communiquez avec nous à PublicationsArchive-ArchivesPublications@nrc-cnrc.gc.ca.
Questions? Contact the NRC Publications Archive team at
PublicationsArchive-ArchivesPublications@nrc-cnrc.gc.ca. If you wish to email the authors directly, please see the first page of the publication for their contact information.
NRC Publications Archive
Archives des publications du CNRC
This publication could be one of several versions: author’s original, accepted manuscript or the publisher’s version. / La version de cette publication peut être l’une des suivantes : la version prépublication de l’auteur, la version acceptée du manuscrit ou la version de l’éditeur.
For the publisher’s version, please access the DOI link below./ Pour consulter la version de l’éditeur, utilisez le lien DOI ci-dessous.
https://doi.org/10.1021/acs.analchem.8b00035
Access and use of this website and the material on it are subject to the Terms and Conditions set forth at
Copper ion assisted photochemical vapor generation of chlorine for its
sensitive determination by sector field inductively coupled plasma
mass spectrometry
Hu, Jing; Sturgeon, Ralph E.; Nadeau, Kenny; Hou, Xiandeng; Zheng,
Chengbin; Yang, Lu
https://publications-cnrc.canada.ca/fra/droits
L’accès à ce site Web et l’utilisation de son contenu sont assujettis aux conditions présentées dans le site LISEZ CES CONDITIONS ATTENTIVEMENT AVANT D’UTILISER CE SITE WEB.
NRC Publications Record / Notice d'Archives des publications de CNRC:
https://nrc-publications.canada.ca/eng/view/object/?id=ee145ae8-0fda-476f-89d3-28ac20be6438 https://publications-cnrc.canada.ca/fra/voir/objet/?id=ee145ae8-0fda-476f-89d3-28ac20be6438National Research Council Canada, 1200 Montreal Road, Ottawa, Ontario K1A 0R6, Canada
§
Key Laboratory of Green Chemistry and Technology, and MOE College of Chemistry, Sichuan University, Chengdu, Sichuan 610064, China
ABSTRACT: A novel, reliable, and sensitive approach for the determination of chlorine by sector field inductively coupled plasma mass spectrometry (SF-ICPMS) using photochemical vapor generation for sample introduction is presented. Methyl chloride is generated from different chlorine species in a flow-through photochemical reactor using a 1% solution of acetic acid containing 7.5 μg g−1 of Cu2+. The volatile product is
directed by an argon carrier gas to a gas−liquid separator and introduced into the instrument. A sample flow rate at 1.7 mL min−1 and a 45 s irradiation time provided a 74-fold
enhancement in sensitivity compared to conventional
nebulization. A blank-limited detection limit of 0.5 ng g−1for chloride, suitable for quantitation at trace levels, was achieved.
The proposed method was validated by analysis of two certified reference materials, NIST SRM 1568b rice flour and SRM 1571 orchard leaves, with satisfactory results, as well as three varieties of bottled water, achieving spike recoveries between 101% and 105%.
C
hlorine, the most abundant halogen in the Earth’s crust, is widely distributed in nature. As the most common form of chlorine, chloride is generally believed to cause no harm to the environment and living organisms, even at high levels. However, exposure to high concentrations of Cl− can causesevere corrosion of metallic pipes and increase the levels of metals in water.1Hence, chloride monitoring in environmental samples remains indispensable for quality control and manage-ment purposes. Moreover, in some cases, it is necessary to control the presence of chloride at trace levels. For instance, a maximum allowable Cl−level of 10 μg L−1has been established
by the American Society for Testing and Materials (ASTM) for ultrapure water used in the production of devices in the electronics and semiconductor industries.2 Other types of chlorine compounds, such as toxic hypochlorite and chlor-amine, widely used in water purification and disinfection, along with a variety of organic compounds such as polycyclic aromatic hydrocarbons (PAHs) and chlorinated solvents, are strictly regulated globally.3−5
Trace levels of chlorine are commonly determined by a few techniques, such as ion chromatography (IC),6,7 neutron activation analysis (NAA),8 X-ray fluorescence spectrometry,9 inductively coupled plasma optical emission spectrometry (ICPOES),10,11 and inductively coupled plasma mass spec-trometry (ICPMS).12−15 Recently, high-resolution continuum
source graphite furnace molecular absorption spectrometry has been applied to the determination of chlorine via the formation
of diatomic molecules such as MgCl,16 InCl,17 and AlCl.18 Among these techniques, ICPMS has been often utilized for detection of chlorine.19 Unfortunately, the determination of chlorine by ICPMS suffers potential spectral interferences arising from sample matrices and typical plasma gas species (e.g.,34S1H+,19F16O+,16O18O1H+,36Ar1H+, and19F18O+), and it
provides comparatively poor detection limits due to its high ionization potential (13.01 eV). Sector field ICPMS instru-ments have been adopted to address some of these issues;14,20 interferences can be frequently eliminated, but the determi-nation of Cl remains subject to memory effects when liquid introduction via nebulization is used. The reported detection limits are no better than 3 ng g−1, even at high-resolution
mode.20
It is well-known that the sample introduction efficiency for standard pneumatic nebulization is poor, typically ranging from 1 to 3% at a sample flow rate 1.0 mL min−1. By contrast,
chemical vapor generation (CVG), which transforms analytes of interest into their gaseous species, achieves significantly higher sample-introduction efficiency and is the subject of widespread research efforts.21−24Conventional CVG schemes utilizing tetrahydroborate reductant fail for the effective vapor
Received: January 3, 2018
Accepted: February 21, 2018
generation of transition metals and nonmetals, including halogens. Recent studies on photochemical vapor generation (PVG) have demonstrated its great potential for halogens.25−31
Iodine was readily amenable to PVG, generating methyl iodide under UV irradiation of iodine in dilute acetic acid solution to yield an introduction efficiency of 94% for iodine and a 40-fold enhancement in sensitivity.26 Bromine, in contrast, was not efficiently vapor-generable unless NH4Cl was present in a dilute
solution of acetic acid.27Chlorine vapor generation appeared to be intractable under the above experimental conditions.
The aim of this study was to evaluate the feasibility of PVG of chlorine and develop a reliable, sensitive, and accurate method for its determination by a sector field ICPMS. A flow-through lamp rendering intense 185 nm UV irradiation was used for this purpose.
■
EXPERIMENTAL SECTIONInstrumentation. All measurements were made using an Element XR (Thermo Fisher Scientific, Germany) sector field inductively coupled plasma mass spectrometer (SF-ICPMS). A combined cyclonic and Scott-type spray chamber allowing for simultaneous introduction of vapor-generated species and liquid nebulization was employed. A perfluoroalkoxy alkane (PFA) self-aspirating nebulizer (Elemental Scientific, Omaha, NE, U.S.A.) was used, operating at 230 μL min−1.
A schematic diagram of the UV-PVG system hyphenated to SF-ICPMS is depicted in Figure 1. Sample solution was delivered at a nominal flow rate of 1.7 mL min−1to the PVG
reactor using a Gilson Minipuls 2 peristaltic pump (Mandel Scientific, Villiers, Le Bel, France), which was also used to evacuate waste from the photochemical reaction. The PVG reactor comprised a 19 W low-pressure mercury discharge lamp (Beijing Titan instrument Co, Beijing, China), having a synthetic quartz central channel of ∼700 μL volume. In this way, the sample solution was subjected to uniform and intense deep UV radiation while flowing through the photoreactor. The effluent was directed to a homemade gas−liquid separator (GLS, ∼2 mL internal volume) supplied with a flow of argon gas via a Brooks model 5871-B mass flow controller (Emerson Electric Co., Hatfield, PA, U.S.A.). Volatile chlorine species from the GLS were then introduced to the inlet of the spray chamber for detection by SF-ICPMS.
UV−vis spectra of sample solutions were recorded with a Thermo Scientific Evolution 220 UV−visible spectrophotom-eter. A 5975C GC-MS from Agilent Technologies (Mississauga, ON, Canada) was used for identification of PVG products.
Reagents and Materials.Nitric acid was purified in-house by sub-boiling distillation of reagent-grade feedstock in a quartz
still. ACS-grade sodium chloride and chloramine T, analytical-grade potassium chlorate, and 10−15% sodium hypochlorite solution were sourced from Fisher Scientific (Nepean, ON, Canada), BDH Chemicals, Ltd., (Poole, England), and Sigma-Aldrich Canada, Ltd. (Oakville, ON, Canada), respectively. High-purity ACS-grade glacial acetic, formic, and propionic acids were purchased from Fisher Scientific (Nepean, ON, Canada) and Sigma-Aldrich Canada, Ltd. (Oakville, ON, Canada). All solutions were prepared using high-purity deionized water (DIW) from a NanoPure mixed-bed ion-exchange system fed with reverse osmosis domestic feedwater (Barnstead/Thermolyne Corp, Dubuque, IA, U.S.A.). A solution of 10 000 μg g−1of Cu(II) was prepared by dissolving
ultrahigh-purity copper wire (99.999%, ESPI Metals, Ashland, OR, U.S.A.) in a few mL of double-distilled nitric acid and diluting with DIW. Anhydrous sodium carbonate (analytical grade, >99.9%) and zinc oxide (99.9%, 200-mesh powder) were obtained from BDH Chemicals Ltd. (Poole, England) and Alfa Aesar (Ward Hill, MA, U.S.A.), respectively. Analytical-grade phosphoric acid (Anachemia Chemicals) and a 1 M solution of sodium hydroxide (ACS grade, Fisher Scientific) were used for pH adjustment of test solutions prior to PVG. A 5% NH3·H2O
(v/v) rinse solution was prepared and used between samples to minimize memory effects via liquid nebulization.
Two certified reference materials, NIST 1568b rice flour and 1571 orchard leaves, were used for method validation. The accuracy of the methodology was also verified based on spike recovery tests from three suppliers of bottled water purchased from a local supermarket.
Sample Preparation and Analytical Procedure. For NIST 1568b rice flour and 1571 orchard leaves, a sintering sample-preparation method was adopted following the procedure of Österlund et al.14Sintering reagent was prepared by mixing 45 g of Na2CO3and 30 g of ZnO. Nominal 0.3 g
subsamples were weighed into precleaned ceramic crucibles and completely covered by 0.75 g of sintering reagent, followed by sintering in a muffle furnace at 560 °C for 2 h. After cooling down, the residue was transferred to clean screw-capped polypropylene bottles and dissolved in 30 g of DIW. The solutions were allowed to stand overnight at room temperature to ensure maximum dissolution. A subsample of the super-natant was diluted 50-fold with 1% (v/v) solution of acetic acid spiked to contain 7.5 μg g−1Cu(II) for analysis by the method
of additions when using PVG sample introduction. Subsamples of 10 g were spiked to result in approximately 0.5-, 1.0-, 2.0-, and 3.0-fold increases in the concentration of chloride in the prepared samples. Dry weights of all samples were corrected for
Figure 1.Schematic diagram of the UV-PVG system hyphenated to sector field ICPMS for vapor introduction of volatile chlorine species.
Analytical Chemistry Article
DOI:10.1021/acs.analchem.8b00035
Anal. Chem. 2018, 90, 4112−4118
Optimization of the SF-ICPMS instrument was undertaken daily using nebulization of a 1 ppb (ng g−1) multielement
tuning solution in the absence of PVG sample introduction. When PVG was in use, nebulization of DIW was continued and the Ar carrier gas flow was optimized for maximum sensitivity for35Cl in a 100 ng g−1solution of chloride in 1% acetic acid
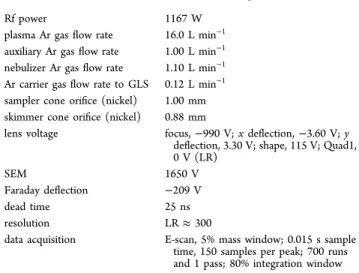
containing 10 μg g−1of Cu(II). Typical operating conditions
are summarized inTable 1. The35Cl isotope was monitored in
analog mode after steady-state signals were achieved using PVG sample introduction over the course of 180 s of sample uptake time. Unless otherwise specified, all measurements were undertaken at low-resolution mode with a total 85 s measurement time.
Relative response from PVG of different chlorine species, including chloride, hypochlorite, chlorate, and chloramine T, was studied based on 2 μg g−1working solutions of each of
these compounds. Concentrations of hypochlorite, chlorate, and chloramine T were calibrated against the chloride standard solution, assuming that nebulization of solutions of all chlorine compounds provided equivalent response.
To identify the gaseous product of PVG of Cl, volatile chlorine species from the photochemical reaction were collected using the method described by Sturgeon et al.27 The gas phase was directed by a stream of Ar from the outlet of the GLS to a clean, Ar-flushed 500 mL glass cylinder fitted with stopcocks at both ends and a septum port in the center. A 1000 μg g−1solution of chloride in 1% acetic acid containing 7.5 μg
g−1Cu(II) was continually pumped through the photoreactor,
allowing the volatile chlorine species to flush and fill the gas sampling bulb. After several minutes, the stopcocks were closed. A 500 μL aliquot of the product was taken with a gas sampling
■
RESULTS AND DISCUSSIONOptimization of UV-PVG. Despite successful PVG of iodine26and bromine27in acetic acid or acetic acid containing NH4Cl, use of similar conditions was unsuccessful for the PVG
of chlorine. Studies by Bakač32and Carraher et al.33suggested that halide ions greatly accelerate the photochemical reaction between transition metal ions and alkyl radicals to generate volatile alkyl halides. A preliminary attempt demonstrated that PVG of Cl−was achievable in the presence of a few hundred
ppm (μg g−1) of Fe3+or several ppm of Cu2+. The significance
of this observation will be discussed later (Transition Metal Ion Assisted UV-PVG section). As Cu(II) was found to be more efficient in assisting PVG of Cl−, it was selected for further
study and optimization.
Under optimal instrumental conditions, a suite of exper-imental parameters affecting PVG of Cl− was further
investigated to yield maximum response, including low-molecular-weight organic acid type and concentration, pH of the generation solution, sample flow rate (irradiation time), and concentration of Cu2+. The influence of sample pH was
examined first. Standard solutions of 50 ng g−1of Cl−, prepared
in 1% acetic acid containing 10 μg g−1of Cu and adjusted over
a pH range 1.7−3.7 using H3PO4or NaOH, were investigated.
For these experiments, an arbitrary sample flow rate to the photoreactor of 1.2 mL min−1and the optimized Ar carrier flow
rate of 0.12 L min−1to the GLS were used. As evident inFigure 2A, high and constant responses were obtained when the sample pH was between 1.8 and 2.3, whereas decreased response was observed at both lower and higher pH values. Note that the pH of 1% (v/v) acetic acid is 2.2.
Similarly, the effect of acetic acid concentration was evaluated with use of a sample flow rate of 1.7 mL min−1 to the
photoreactor and an Ar carrier gas flow rate of 0.12 L min−1.
The concentration of Cu2+in the sample was fixed at 10 μg g−1.
As shown in Figure 2B, 1% (v/v) acetic acid generated the highest response. For simplicity, as the pH of 1% (v/v) acetic acid is ∼2.2, no further pH adjustment was used for all subsequent experiments.
Only PVG of Cl−in formic and propionic acid media was
investigated as well. It was found that the presence of even 0.1% formic acid in the 1% acetic acid solution led to an almost 60% decrease in35Cl intensity. In the presence of 1% propionic acid,
the resultant35Cl response was merely 0.4% of that from pure
1% acetic acid. In accordance with the generally accepted free radical mechanism of PVG,34it is speculated that formic acid may generate water-soluble HCl, which remains in the solution, whereas propionic acid may produce ethyl chloride having much lower volatility. When acetic acid was used, the PVG-generated species was found to be methyl chloride, as confirmed by GC-MS analysis of the collected product, as shown inFigure 3.
Table 1. SF-ICPMS ElementXR Operating Conditions
Rf power 1167 W
plasma Ar gas flow rate 16.0 L min−1
auxiliary Ar gas flow rate 1.00 L min−1
nebulizer Ar gas flow rate 1.10 L min−1
Ar carrier gas flow rate to GLS 0.12 L min−1
sampler cone orifice (nickel) 1.00 mm skimmer cone orifice (nickel) 0.88 mm
lens voltage focus, −990 V; x deflection, −3.60 V; y deflection, 3.30 V; shape, 115 V; Quad1, 0 V (LR)
SEM 1650 V
Faraday deflection −209 V
dead time 25 ns
resolution LR ≈ 300
data acquisition E-scan, 5% mass window; 0.015 s sample time, 150 samples per peak; 700 runs and 1 pass; 80% integration window
Sample delivery rate determines both the amount of analyte supplied to the PVG reactor and the irradiation time. The effect of sample delivery rate was studied over a wide range, from 0.2−6.4 mL min−1. As shown inFigure 4, a near linear increase
in 35Cl intensity is observed for sample delivery rates in the
range of 0.2−1.0 mL min−1, indicating that the efficiency of the
generation and transport system is constant under these conditions. Optimal response was achieved at a delivery rate of 1.4−2.2 mL min−1and then decreased at higher transport flow
rates, likely due to either insufficient irradiation time or compromised performance of the GLS device. A sample delivery rate of 1.7 mL min−1, corresponding to ∼45 s
irradiation time, was selected for all subsequent measurements. Transition Metal Ion Assisted UV-PVG. As reported in recent studies, the presence of several metal ions28,35or specific reagents27 may serve as sensitizers that significantly enhance PVG efficiency for a number of analytes. Studies by Bakač32
and Carraher et al.33suggest that halide ions greatly accelerate the photochemical reaction between transition metal ions and alkyl radicals for the generation of volatile alkyl halides. Correspondingly, transition metal ions such as Fe(III) and Cu(II) may enhance the efficiency of photochemical production of chloride species. To confirm this, standard solutions of Cl−prepared in 1% HAc solution were spiked with
varying amounts of ultrapure solutions of these potential “sensitizers”, including Ni(II), Co(II), Mn(II), Zn(II), Fe(III), Cu(II), and NH4Ac. It was found that Ni(II), Co(II), Mn(II),
and Zn(II), even at as high as 150 μg g−1level, and up to 2000
μg g−1 NH
4Ac, were incapable of inducing PVG of Cl−.
However, a few hundred μg g−1of Fe(III) slightly enhanced the
PVG whereas Cu(II) was found to be the most effective for improving the signal. As shown in Figure 5, chloride was not
vapor-generable in the absence of Cu(II). PVG response from a 50 ng g−1 Cl standard increased remarkably as Cu(II)
concentration increased from 0 to 5 μg g−1, remained constant
up to 10 μg g−1, and thereafter slightly decreased at higher
values. Consequently, 7.5 μg g−1of Cu(II) was selected for all
subsequent measurements in consideration of maximum response being achieved at minimum concentration.36
As noted earlier, the photochemically generated species of Cl−was confirmed to be CH
3Cl by GC-MS detection (Figure 3). This observation is consistent with the ligand-to-metal charge transfer (LMCT) model discussed by Sturgeon in recent reviews on mechanisms of PVG34,36and the radical-mediated
Figure 2.Effect of (A) pH of sample solution and (B) concentration of acetic acid on relative responses from 50 ng g−1of Cl−standard
solutions containing 10 μg g−1 of Cu2+ in 1% acetic acid (A) and
various amount of acetic acid (B), respectively, using PVG sample introduction.
Figure 3. GC-MS spectrum of the headspace gas containing the reaction products from photochemical vapor generation of a 1000 μg g−1chloride solution in 1% (v/v) acetic acid containing 7.5 μg g−1of
Cu2+.
Figure 4.Impact of sample delivery rate on relative response from a 50 ng g−1of Cl−using PVG sample introduction.
Figure 5.Effect of Cu(II) concentration on relative response from 50 ng g−1Cl−solutions in 1% acetic acid using PVG sample introduction.
Analytical Chemistry Article
DOI:10.1021/acs.analchem.8b00035
Anal. Chem. 2018, 90, 4112−4118
noticeable variations in the photoabsorption spectrum of the sample solutions measured by a UV−visible spectrophotometer emerged as well, as evident inFigure 6. Specifically, addition of
Cu(II) to 1% (v/v) acetic acid solution resulted in the appearance of new LMCT bands starting from low energy around 325 nm. The presence of chloride, however, led to an obvious shift of the onset of this band to 280 nm but still differed from that of 1% acetic acid solution (250 nm). Presumably, Cu(II) served as a “sensitizer” for the photo-reaction via accelerated decarboxylation of the acetic acid33as a result of enhanced absorption evident at the principal discharge line of 254 nm emanating from the low-pressure Hg lamp comprising the photoreactor.
Influence of Transition Metals and HNO3 on the PVG
of Cl. Transition metals and NO3−often have adverse effects
on the PVG of many analytes;30their effects on the responses from Cl were also investigated. Results are summarized in
Table 2. It is evident that none of the transition metals of interest (Mn2+, Zn2+, Ni2+, Co2+, Fe3+, and CrVI) displayed
significant improvement or suppression of signals, except a 10 μg g−1 Zn2+ spiked solution showed a slight enhancement.
Although a few hundred μg g−1of Fe(III) alone was found to
facilitate PVG of Cl, as demonstrated above, the addition of 1− 10 μg g−1Fe(III) to the generation solution containing 7.5 μg
g−1Cu(II) could not yield higher response, either because the
amount of spiked Fe(III) was inadequate to induce a synergistic enhancement or because the PVG condition used was optimal for Cu(II) modifier but was not the best for Fe(III). Furthermore, as reported in previous studies, nitrate ions were detrimental to the PVG efficiency. Not surprisingly, the presence of 15 mM NO3−led to a remarkable 40% decrease in
the response of PVG of Cl−. However, a merely 8% decrease
was noted with 7.5 mM NO3−, suggesting that PVG of Cl−
should be tolerant to nitrate ions to some extent and should suffer negligible impact from nitrate after the addition of 0−20 μL Cu(II) modifier from 10 000 μg g−1Cu(II) stock (prepared
from dissolution of copper wire in 5% HNO3) to the sample
solution.
Analytical Performance. Steady-state PVG signals could be generated over the course of a 85 s sample introduction period, which were then used for quantitation or comparison of relative analytical performance throughout this work. PVG responses from different forms of chlorine, including chloride, hypochlorite, chloramine T, and chlorate, were compared under optimized experimental conditions. As presented in
Figure 7, the relative response from these chlorine species differ, suggesting varied kinetics or mechanisms of the reactions. UV−vis spectra of the various solutions tested were not acquired. Vapor generation efficiencies follow the order chloride > chloramine T > chlorate > hypochlorite.
Using chloride as an example, analytical figures of merit are summarized inTable 3, which highlight the advantages of PVG
Figure 6.UV−vis spectra of various test solutions: the concentrations of Cl− and Cu(II) in the test solutions were 10 and 20 μg g−1,
respectively. 5 1.08 10 1.10 Cr(VI) 5 1.08 10 1.10 NO3− (7.5) 0.92 (15) 0.59 a
Ratio of response obtained from 0.050 μg g−1standard solutions of
Cl−in 1% HAc and 7.5 μg g−1Cu2+with addition of various amounts
of interference ions to the response from a pure 0.050 μg g−1standard
solution of Cl−in 1% HAc and 7.5 μg g−1Cu2+.
Figure 7.PVG response from individual standard solutions of Cl−,
sample introduction over direct solution nebulization. Under optimized experimental conditions, a 74-fold enhancement in sensitivity is realized using PVG. In addition, the severe memory effect encountered during pneumatic nebulization was completely eliminated with PVG sample introduction to the ICPMS. Unfortunately, a relatively high blank of ∼4 ng g−1was
inevitably encountered even when ultrapure DIW and reagents were used. As a result, the limit of detection (LOD) of the proposed PVG method is compromised and values of 0.46 and 0.45 ng g−1 were obtained at low and high resolution,
respectively, based on three times the standard deviation of method blanks using external calibration. Despite this draw-back, a 15-fold improvement in LOD was obtained. A precision of <2% RSD for replicate measurements of 50 ng g−1chloride
was obtained using PVG sampling. The 74-fold increase in sensitivity with PVG suggests that the overall efficiency (generation, phase separation, and transport) compared to pneumatic nebulization (assumed to be nominally 8%37 and accounting for the 1.7 mL/min PVG sample flow rate vs 0.23 mL min−1 for nebulization) is 80%. The linear range of the
proposed method runs from 2 to 500 ng g−1 Cl with R2 of
0.999, as summarized inTable 3.
Method Validation and Applications to Water Samples. Standard additions calibration was employed for quantitation under optimized experimental conditions to achieve final accurate results. As a result of PVG sample introduction, potential spectral interferences arising from sample matrices (e.g., 34S1H+, 19F16O+, and 19F18O+) are minimized. The high blank encountered arises mainly from DIW and not from spectral interferences, because similar values of blank were obtained at low and high resolution, respectively. Because analytical performance is similar between low and high resolution, for simplicity, low resolution was used for the final quantitation of chlorine. By sintering the two reference materials, all forms of chlorine were converted to HCl(g) and quantitatively trapped by Na2CO3in the sintering agent,14and
thus were present as chloride in the prepared sample solutions:
+ → + + 2HCl(g) Na CO (s) 2NaCl(s) H O(g) CO (g) 2 3 2 2 (1)
Appropriate amounts of Cl−standard solution were added to
prepare test samples so as to result in 1-, 2-, and 4-fold increases in the expected concentrations of chloride. The Cu(II) sensitizer was added to all solutions (7.5 μg g−1 of Cu) to
enhance the response. Method blanks arising from the sintering agents were quantitated in the same way, and their content was subtracted from total concentrations measured in the reference materials. Analytical results obtained from three replicate measurements of each reference material are summarized in
Table 4. The determined total Cl concentrations in the two reference materials are in agreement with the certified (for
NIST 1568b) or reference (for NIST 1571) values, demonstrating the accuracy and reliability of the proposed method.
Three bottled waters were analyzed and spike-recovery tests were performed at the analyte concentration levels determined in each sample, assuming that the major chlorine species in each bottled water was chloride.38 As evident from Table 4, spike recoveries of 101%−105% were achieved. Demineralized waters that underwent multistep purification (sample nos. 1 and 2) contain significantly lower Cl than naturally sourced spring water (sample no. 3). Applications to other water matrices were not attempted because responses from different chlorine species are significantly different. Such applications were deemed beyond the scope of the present study. Nevertheless, it is evident that speciation could be readily achieved by coupling sample processing with ion chromatog-raphy for initial species separation and directing the effluent to the PVG reactor for quantitation after online addition of acetic acid and Cu(II) sensitizer. A multispecies calibration standard, similarly treated, would resolve this issue satisfactorily.
■
CONCLUSIONSA novel, reliable, and sensitive approach for the determination of chlorine was developed using PVG for sample introduction and SF-ICPMS for detection. Under optimized experimental conditions, a blank-limited detection limit of 0.5 ng g−1 as
chloride and a 74-fold enhancement in sensitivity compared to that with pneumatic nebulization were obtained as a consequence of an estimated 80% overall introduction efficiency. Featuring simplicity, low consumption of reagents, and lower memory effect, the proposed methodology has potential for monitoring trace-level chloride, such as in ultrapure water used in the electronics and semiconductor industries, and confirmation of the stoichiometry of chlorinated organic compounds.
Table 3. Figures of Merit
low resolution high resolution
PVG sampling nebulization PVG sampling nebulization
precision, % RSD @ 50 ng g−1 1.7 4.9 1.9 6.8
LODa, ng g−1 0.46 6.8 0.45 6.7
blankb, ng g−1 4.3 3.8
PVG efficiencyc 80
linear range, ng g−1 2−500 with R2of 0.999 2−500 with R2of 0.999 a
On the basis of 3 times the standard deviation of the method blank (n = 7).bFor35Cl, based on standard additions analysis of the generation
medium comprising 1% acetic acid in deionized water containing 7.5 μg g−1of Cu(II).cOn the basis of response from PVG sampling of Cl−relative
to that from solution nebulization, assuming the introduction efficiency of the latter at 0.23 mL/min sample uptake rate was 8%.37
Table 4. Analytical Results
sample determined (reference) valuecertified recovery (%)spike no. 1 bottled water
(ng g−1)
56.2 101
no. 2 bottled water
(ng g−1) 120 105
no. 3 bottled water (μg g−1)
21.3 100
NIST 1568b (μg g−1) 301.9 ± 11.4 301.1 ± 3.8
NIST 1571 (μg g−1) 644.9 ± 14.2 (690)
Analytical Chemistry Article
DOI:10.1021/acs.analchem.8b00035
Anal. Chem. 2018, 90, 4112−4118
■
AUTHOR INFORMATION Corresponding Authors *houxd@scu.edu.cn. *Lu.yang@nrc-cnrc.gc.ca. ORCID Lu Yang:0000-0002-6896-8603 NotesThe authors declare no competing financial interest.
■
ACKNOWLEDGMENTSThe National Natural Science Foundation of China (Grant no. 21529501), Ministry of Education of China through the 111 Project (B17030), and China Scholarship Council for financial support of J.H. during the study are gratefully acknowledged.
■
REFERENCES(1) Yakoh, A.; Rattanarat, P.; Siangproh, W.; Chailapakul, O. Talanta 2018, 178, 134−140.
(2) ASTM D5127-13. Standard Guide for Ultra-Pure Water Used in the Electronics and Semiconductor Industries; ASTM International: West Conshohocken, PA, 2013; DOI:10.1520/D5127-13.
(3) Richardson, S. D.; Ternes, T. A. Anal. Chem. 2014, 86, 2813− 2848.
(4) Postigo, C.; Richardson, S. D. J. Hazard. Mater. 2014, 279, 461− 475.
(5) Moran, M. J.; Zogorski, J. S.; Squillace, P. J. Environ. Sci. Technol. 2007, 41, 74−81.
(6) Noguchi, Y.; Zhang, L.; Maruta, T.; Yamane, T.; Kiba, N. Anal. Chim. Acta 2009, 640, 106−109.
(7) Colaruotolo, J. F.; Eddy, R. S. Anal. Chem. 1977, 49, 884−885. (8) Chang, H. P.; Meric, I.; Sudac, D.; Nad, K.; Obhod̵as, J.; Gardner, R. P. Fuel 2017, 209, 643−649.
(9) Vander Hoogerstraete, T.; Jamar, S.; Wellens, S.; Binnemans, K. Anal. Chem. 2014, 86, 3931−3938.
(10) Nunes, T. S.; Muller, C. C.; Balestrin, P.; Muller, A. L. H.; Mesko, M. F.; Mello, P. d. A.; Muller, E. I. Anal. Methods 2015, 7, 2129−2134.
(11) Nakata, K.; Hashimoto, B.; Uchihara, H.; Okamoto, Y.; Ishizaka, S.; Fujiwara, T. Talanta 2015, 138, 279−284.
(12) Balcone-Boissard, H.; Michel, A.; Villemant, B. Geostand. Geoanal. Res. 2009, 33, 477−485.
(13) Date, A. R.; Stuart, M. E. J. Anal. At. Spectrom. 1988, 3, 659− 665.
(14) Österlund, H.; Rodushkin, I.; Ylinenjärvi, K.; Baxter, D. C. Waste Manage. (Oxford, U. K.) 2009, 29, 1258−1264.
(15) de Gois, J. S.; Pereira, É. R.; Welz, B.; Borges, D. L. G. Anal. Chim. Acta 2014, 852, 82−87.
(16) Medeiros, R. L. d. S.; Souza, S. O.; Araújo, R. G. O.; da Silva, D. R.; Maranhão, T. d. A. Talanta 2018, 176, 227−233.
(17) Machyňák, L.; Čacho, F.; Němeček, M.; Beinrohr, E. Spectrochim. Acta, Part B 2016, 125, 140−145.
(18) Fechetia, M.; Tognon, A. L.; da Veiga, M. A. M. S. Spectrochim. Acta, Part B 2012, 71−72, 98−101.
508−514.
(27) Sturgeon, R. E. Anal. Chem. 2015, 87, 3072−3079.
(28) Gao, Y.; Xu, M.; Sturgeon, R. E.; Mester, Z.; Shi, Z.; Galea, R.; Saull, P.; Yang, L. Anal. Chem. 2015, 87, 4495−4502.
(29) Gao, Y.; Li, S.; He, H.; Li, T.; Yu, T.; Liu, R.; Ni, S.; Shi, Z. Microchem. J. 2017, 130, 281−286.
(30) Zheng, C.; Sturgeon, R. E.; Brophy, C. S.; He, S.; Hou, X. Anal. Chem. 2010, 82, 2996−3001.
(31) Gao, Y.; Sturgeon, R. E.; Mester, Z.; Pagliano, E.; Galea, R.; Saull, P.; Hou, X.; Yang, L. Microchem. J. 2016, 124, 344−349.
(32) Bakač, A. Croat. Chem. Acta 2001, 74, 633−640.
(33) Carraher, J. M.; Pestovsky, O.; Bakac, A. Dalton Trans. 2012, 41, 5974−5980.
(34) Sturgeon, R. E. J. Anal. At. Spectrom. 2017, 32, 2319−2340. (35) Wang, Y.; Lin, L.; Liu, J.; Mao, X.; Wang, J.; Qin, D. Analyst 2016, 141, 1530−1536.
(36) Sturgeon, R. E.; Grinberg, P. J. Anal. At. Spectrom. 2012, 27, 222−231.
(37) Olesik, J. W. Inductively Coupled Plasma Mass Spectrometers. In Treatise on Geochemistry, 2nd ed.; Turekian, K. K., Ed.; Elsevier: Oxford, U.K., 2014; pp 309−336.