Applying Tradespace Exploration Methods for
the Design of Value-Robust Microgrids
MASSACHUSETTS INSTITUTE
by OF TECHNOLOGY
Ke Wei Joel Ong
MAR 3 0
2017
B.Eng. Mechanical Engineering
LIBRARIES
National University of Singapore, 2009
LBA E
SUBMITTED TO THE SYSTEM DESIGN AND MANAGEMENT PROGRAM IN PARTIAL FULFILLMENT OF THE REQUIREMENTS FOR THE DEGREE OF
MASTER OF SCIENCE IN ENGINEERING AND MANAGEMENT AT THE
MASSACHUSETTS INSTITUTE OF TECHNOLOGY FEBRUARY 2017
2017 Ke Wei Joel Ong. All rights reserved.
The author hereby grants to MIT permission to reproduce and to distribute publicly paper and electronic copies of this thesis document
in whole or in part in any medium now known or hereafter created.
Signature redacted
Signature of Author:
System Design and Management Program January 20, 2017
Certified by:
Signature redacted
Principal Research Scientist Sociotechnical Systems Researyh Center
Signature redacted
Accepted by:Warren S/ering Weber-Shaughness Professor of Mechanical Engineering
77 Massachusetts Avenue Cambridge, MA 02139
M
IT~ibranes
http://libraries.mit.edu/askDISCLAIMER NOTICE
Due to the condition of the original material, there are unavoidable
flaws in this reproduction. We have made every effort possible to
provide you with the best copy available.
Thank you.
The images contained in this document are of the
best quality available.
Applying Tradespace Exploration Methods for the Design of Value-Robust Microgrids
by
Ke Wei Joel Ong
Submitted to the Department of System Design and Management Program on January 20, 2017 in Partial Fulfillment of the Requirements for the Degree of Master of Science in Engineering and Management
Abstract
Microgrids enhance resilience in power distribution by providing the capability to be islanded from the utility grid and sustain electricity delivery using distributed energy resources. Microgrids are also able to accommodate a higher mix of renewable energy sources that bring about reduced carbon emissions. However, the increasing complexities that come with decentralizing power generation and the integration of cyber elements pose new challenges in making design decisions.
In this thesis, two tradespace based methods are proposed for choosing value-robust microgrid designs during the conceptual design stage. A value-robust design is one that is able to sustain delivery of perceived value to stakeholders, even when subjected to changes in contexts and needs. Multi-Attribute Tradespace Exploration (MATE) enables decision makers to evaluate a large number of design alternatives against utility and expense metrics that capture the stakeholder-perceived value. A full tradespace exploration avoids premature fixation on local point solutions and provides a more in-depth appreciation of the design space.
Epoch-Era Analysis (EEA) provides a dynamic perspective of the system to enable the evaluation of value robustness across time periods with changing contexts and value expectations. The value robustness of a design can be quantified by analyzing tradespaces across different value-centric time periods or epochs. Designs that are found to exhibit high value robustness can
be identified as candidates for detailed design.
A constructed case study of a military microgrid is presented to demonstrate the use of MATE and EEA to find highly value-robust designs. While traditional design approaches tend to limit decision-making to a choice among given alternatives, MATE and EEA focus on the fundamental values of decision makers, allowing them to generate alternatives and discover high value designs.
Thesis Supervisor: Donna H. Rhodes
Acknowledgements
I would like to thank my advisor, Dr. Donna Rhodes, for her guidance and encouragement throughout this process. Thank you for enabling me to explore a research topic that I'm
interested in, and for helping me accomplish this goal.
I would also like to thank the Defence Science and Technology Agency for giving me this opportunity to pursue a postgraduate education here at MIT.
To everyone in SDM and SEAri whom I have had the privilege of knowing, thank you for enriching my time here with your friendship and for the chance to learn from you. I wish you the best in all that you choose to do, and I look forward to hearing about all the amazing things you are about to accomplish.
To my family, i'm grateful for your support and for keeping us in prayer from halfway across the world.
To my wife, Keryn, thank you for your sacrifices, for believing in me and for being a great partner along this journey. All this would not have been possible without your support. As this experience comes to an end, I look forward to the adventures ahead of us.
Table of Contents
Abstract ... 3
A cknow ledgem ents... 5
Table of Contents... 6 List of Figures ... 9 List of Tables ... I 1 1. Introduction... 13 1.1 Background... 13 1.2 M otivation ... 15
1.2.1 Tools for Conceptual Design... 15
1.2.2 Creating Value ... 17
1.2.3 Uncertainty and Risk... 18
1.3 Research Questions and Thesis Overview ... 19
2 Designing System s for Value Robustness... 21
2.1 Creating Value...2 1 2.2 Value-Centric Approaches in Engineering and Management ... 21
2.3 Value Robustness ... 24
2.3.1 Passive Value Robustness... 24
2.3.2 Active Value Robustness ... 25
2.4 e p ... 26
2.4.1 Tradespace Exploration ... 26
2.4.2 M ulti-Attribute Tradespace Exploration... 2 8 2.5 M tlti-Epoch Analysis... .30
2.6 Q uantification of Value Robustness ... 32
3 Case Study of a M ilitary M icrogrid ... 35
3.1 Background of M ilitary M icrogrids ... 35
3.1.1 Energy N eeds for the M ilitary ... . 35
3.1.2 M icrogrids for Installation Energy... 36
3.2 Case Study O verview ... 37
3.3 Stakeholders... 37
3.4 A ssum ptions and Constraints ... 39
3.4.1 Operational Requirem ents ... .39
3.4.2 Existing Infrastructure ... 40
3.4.3 Distributed Energy Resources... 41
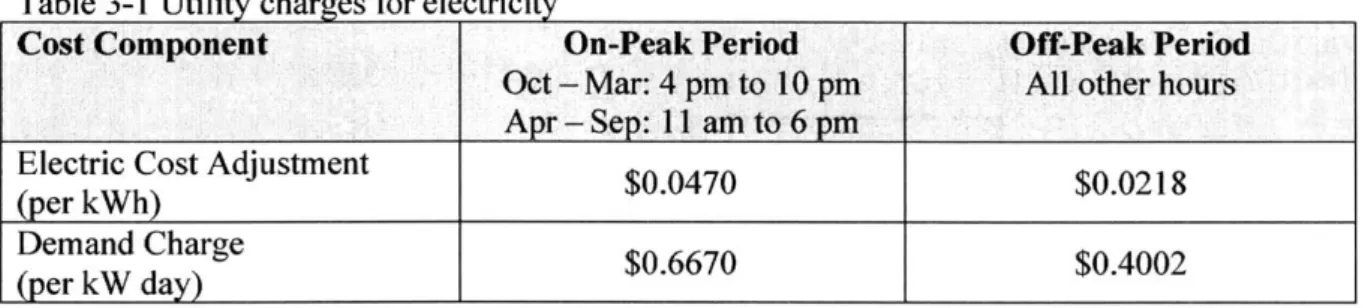
3.4.4 Concept of Operations ... 41 3.4.5 Grid Interconnection ... 43 3.4.6 Utility Tariffs ... 44 3.5 Value Attributes... 45 3.5.1 Utility Attributes ... 45 3.5.2 Expense Attributes ... 47
3.5.3 Utility and Expense Functions... 48
3.6 Design Variables... 51
3.7 Design-Value M apping... 52
3.8 Tradespace Exploration ... 55
3.8.1 Calculations of Utility Attributes... 58
3.8.3 Tradespace Generation... 61
3.8.4 Exploring the Tradespace ... 63
3.9 Epoch Characterization... 73
3.10 M ulti-Epoch Analysis for Value-Robustness... 75
3.10.1 Tradespace Yield ... 79
3.10.2 Identifying Value-Robust Designs ... 80
3.11 Sum m ary of Findings ... 81
4 Discussion ... 84
4.1 Discussion on the Application of MATE and EEA to Microgrid Design... 85
4.1.1 Capturing Stakeholder N eeds and Preferences ... 85
4.1.2 Providing an A dded Perspective on Uncertainty ... 86
4.1.3 Facilitating Communication between Designers and Stakeholders... 87
4.2 Future W ork... 87
4.2.1 Full Era A nalysis w ith N et Present Cost Calculations... 87
4.2.2 Strategy Formulation for Designs with Active Value Robustness ... 88
4.3 Concluding Rem arks ... 89
List of Figures
Figure 1-1 Commitment, system-specific knowledge, cost incurred and ease of change over the
system lifecycle (Blanchard & Fabrycky, 2006) ... 16
Figure 2-1 Potential savings from implementation of VE across different project stages (Cullen, 2 0 16) ... 2 2 Figure 2-2 Storing generated energy for use on demand ... 25
Figure 2-3 Classes of trades: 1) local points, 2) frontier points, 3) frontier sets and 4) full tradespace exploration (Ross & Hastings, 2005)... 27
Figure 2-4 Typical tradespace representation (Ross & Hastings, 2005) ... 30
Figure 2-5 Needs and expectations across epochs of the system era (Ross & Rhodes, 2008b)... 31
Figure 3-1 Stakeholders and beneficiaries (Crawley, Cameron & Selva, 2015)... 39
Figure 3-2 Modeled load profile for microgrid... 41
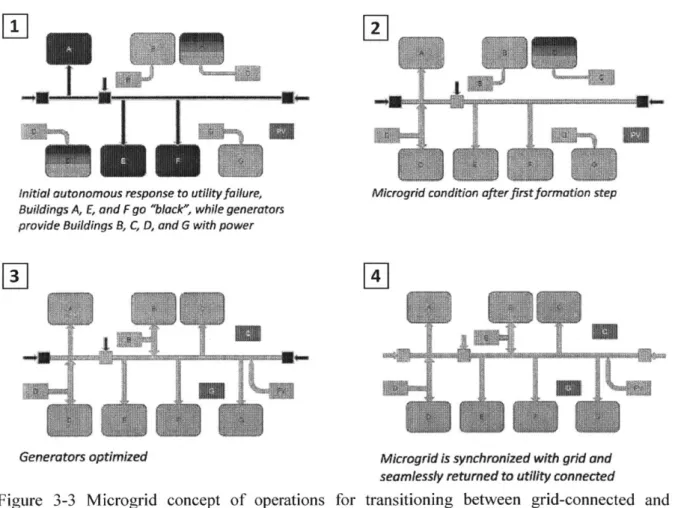
Figure 3-3 Microgrid concept of operations for transitioning between grid-connected and islanded modes (adapted from NAVFAC, 2015) ... 42
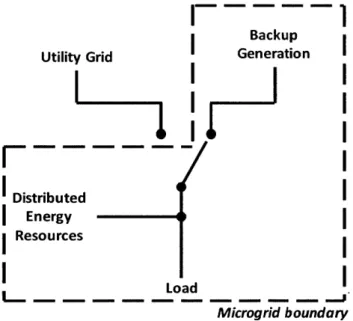
Figure 3-4 Schematic of microgrid architecture (adapted from Van Broekhoven et al., 2012) ... 43
Figure 3-5 Single attribute utility functions... 50
Figure 3-6 Single attribute expense functions ... 50
Figure 3-7 Power production and demand during grid-connected operation on a day in January for D esign #86 [500, 500, 500, 1]... 57
Figure 3-8 Power mix for Design #86 [500, 500, 500, 1]... 58
Figure 3-9 Fuel consumption curve for I MW diesel generator... 59
Figure 3-10 Tradespace for baseline epoch with Pareto set colored red ... 62
Figure 3-1 1 Identifying good designs along Pareto front ... 64
Figure 3-13 Impact of gas generator capacity on designs... 67
Figure 3-14 Impact of wind turbine capacity on designs... 68
Figure 3-15 Impact of solar PV capacity on designs ... 69
Figure 3-16 Utility attribute values of 112 designs in baseline tradespace ... 70
Figure 3-17 Expense attribute values of 112 designs in baseline tradespace ... 71
Figure 3-18 Utility attribute and SAU values for reduced solution set ... 72
Figure 3-19 Expense attribute and SAE values for reduced solution set... 72
Figure 3-20 Tradespaces for Epochs 1 to 4 ... 76
Figure 3-21 Tradespaces for Epochs 5 to 8 ... 77
Figure 3-22 Tradespaces for Epochs 9 to 12 ... 78
Figure 3-23 Tradespace yields for 12 epochs ... 79
List of Tables
Table 3-1 Utility charges for electricity... 44
Table 3-2 List of attributes, units, ranges and weighting factor ... 49
Table 3-3 Design variables and variable levels ... 51
Table 3-4 Design-value m apping... 54
Table 3-5 Capital cost for distributed energy resources ... 60
Table 3-6 Annual O&M cost for distributed energy resources... 61
Table 3-7 Land requirement for solar PV and wind turbine generation capacity... 61
Table 3-8 Pareto optimal designs in baseline tradespace... 63
Table 3-9 Epoch variables and variable levels ... 73
1. Introduction
1.1 Background
In October 2012, Hurricane Sandy hit the East Coast of the United States, taking lives and caused billions of dollars in damage. The storm destroyed power infrastructure, leaving millions of people cut off from electricity for months before power was eventually restored. This came less than a decade after the Northeast blackout of 2003, during which cascading failures across the Eastern Interconnection brought down 256 power plants in the region and caused 50 million people to lose power for up to two days. There has also been rising concerns of malicious cyberattack that can bring down the power grid and other critical infrastructure, a scenario that has been likened to a "cyber Pearl Harbor" (Bumiller & Shanker, 2012). With the ever-growing demand for electrical services and the trend towards the electrification of transportation, society is becoming more dependent than ever on the power grid. These events have brought to public attention the vulnerabilities of the power grid and the need for infrastructure modernization efforts to improve the grid's reliability and resilience.
There are also other issues to be addressed in the context of global sustainability. The impact of climate change and pollution have called for a shift towards renewable energy sources (RES) as a sustainable means to meet the needs of growing economies. Such environmental and economic considerations have resulted in increasing adoption of distributed generation (DG) in place of conventional model of centralized power generation. Distributed energy resources (DERs) such as solar photovoltaic (PV) panels, wind turbines and energy storage devices can be installed close to the customers to meet their energy needs, thereby reducing the demand for traditional capacity expansion and greenhouse gas emissions. The close proximity between generation and demand can also contribute to reduced line losses and improved power quality and reliability. Another benefit of DG is that it provides geographically isolated regions access to electricity without building large-scale transmission and distribution networks, therefore providing developing economies with clean and affordable energy.
The penetration of DG, however, is not without its challenges. Connecting a large number of DERs to the power distribution grid can cause significant challenges for the system operator in maintaining stable frequency and voltage levels. New protection schemes are also required, since DERs can also introduce bi-directional power flows in a system where power normally flows uni-directionally from a higher voltage grid to a lower voltage one.
These challenges can be partly addressed using microgrids. A microgrid is defined by the U.S. Department of Energy (DOE) as "a group of interconnected loads and distributed energy resources within clearly defined as a single controllable entity with respect to the grid. A microgrid can connect and disconnect from the grid to enable it to operate in both grid-connected or island-mode" (Ton & Smith, 2012). From the perspective of the larger grid, a microgrid is seen as a single entity connects to it via a point of common coupling. The microgrid controller takes on operational control and coordination of the DERs, thus relieving that burden from the grid, which sees the microgrid as a single load or producer. Some microgrids are also able to participate in the local ancillary services market, providing services such as voltage and frequency control support to improve the reliability and power quality of the transmission and distribution system. For these and other reasons, the microgrid has often been called a fundamental building block for the smart grid.
The ability to island or disconnect itself the grid makes the microgrid a solution in adding resilience to the power infrastructure. During the power outage caused by Hurricane Sandy, New York University, Princeton University and the Federal Drug Administration's White Oak research facility relied on their microgrids to continue operations in island-mode. The islanding capability makes microgrids an attractive and robust solution for users that require continuous operations, such as the military and hospitals.
Microgrid installation capacity has been growing across the world, and deployment costs are expected to continue to drop with falling costs in RERs such as solar PV panels and batteries. Rebates and financing schemes are also being offered by governments and energy service companies to support the adoption of distributed RES. With such trends, facility owners and
other stakeholders are expected to be encouraged to consider microgrids as a solution to their local energy needs.
1.2 Motivation
Power systems engineering is a mature field that has been established over more than a hundred years, with the National Academy of Engineering naming "electrification" the greatest engineering achievement of the 20th century (Constable & Somerville, 2003). However, the increasing complexities that come with decentralizing power generation and the integration of cyber elements also pose new challenges for designers and decision-makers. In fact, the DOE recognized that existing design tools have their limitations and are not able to keep pace with the increasing complexity that comes with its efforts in modernizing the grid for the 21st century.
1.2.1 Tools for Conceptual Design
In most life cycle models, design activities start in the conceptual or preliminary design stage ("Concept Stage" in ISO/IEC/IEEE 15288:2015) during the early phases of the project. This stage typically comprises of activities that involve exploring alternative concepts and shortlisting feasible designs that are able to meet stakeholder needs. Major engineering and management decisions are made during this stage, locking in commitments to technology selection, cost and schedule projections (Blanchard & Fabrycky, 2006). The early activity of conceptual/preliminary design is crucial for developing a clear definition of the problem space and for a good understanding of the trades among available technical alternatives.
Commitment to Technology,
Configuration, Performance, Cost, etc.
N Conceptual/ Detail Construction
E Preliminary Design and andior System Use SuPpt,
Design Development Production Phase-out, and Disposal
Figure 1-1 Commitment, system-specific knowledge, cost incurred and ease of change over the
system lifecycle (Blanchard & Fabrycky, 2006)
Conceptual design is not unfamiliar to the power system engineering industry. Conceptual
studies have long been advocated as a means to achieve long-term performance and cost
effectiveness of power systems (Dunki-Jacobs & Davis, 1994). The architecture, engineering and
construction (AEC) industry has also understood that the conceptual design phase provides the
greatest opportunity to influence the outcome of the project (Abdul-Kadir & Price, 1995).
That being said, performing conceptual design for microgrids can be faced with new technical
and managerial challenges. One of the most obvious challenges is that each microgrid is unique
and project-specific. Its design will depend on the load profile that is being served, existing
legacy infrastructure, the local site conditions and other user requirements that need to be met.
The number of design variables and parameters to consider increases significantly when it comes
to deciding the power generation mix
-
designers not only have to decide the capacity of
generation, but also the combination of various types of DERs in the microgrid. The problem is
exacerbated when we consider that the microgrid is expected to meet the (often conflicting)
needs of various stakeholders, each with their own set of goals and preferences.
Furthermore, insufficient resources may be allocated for front-end conceptual design activities in actual project environments and designers may also face extraneous constraints that come from user requirements that are not solution-neutral. Coupled with schedule and cost pressures, designers can be prematurely fixated on baseline solutions that have worked well in the past. When faced with an overwhelming number of alternatives to consider, designers tend to only identify a limited number of locally optimized point designs, missing out on opportunities to make dramatic improvements (Walden, Roedler, Forsberg, Hamelin & Shortell, 2015). An effective conceptual design process should help the microgrid designer generate alternative concepts, evaluate them, and to choose the best concept to be developed further through detailed design.
1.2.2 Creating Value
Delays and cost overruns are known to plague large complex infrastructure projects across the world (Beckers et al., 2013). Power infrastructure projects are of no exception, as a survey of 401 projects indicated power generation, transmission and distribution projects are also prone to being late and expensive (Sovacool, Nugent & Gilbert, 2014). A common challenge is that of scope changes and the propagation of change requests that lead to costly and time-consuming negotiations between the client and contractor (Siemiatycki, 2015).
Similar challenges present in the aerospace and defense industries have led to a recent movement towards using "value" as a driver of design decisions for complex engineering systems. The value-driven design framework is proposed mainly as a response to the increasing occurrences of schedule delays, cost overruns and performance shortfall in aerospace and defense projects (Ross, O'Neill, Hastings & Rhodes, 2010). Proponents of value-driven design believe that as engineering systems become increasingly complex, the traditional approach of using requirements-based engineering processes have become inadequate and "simply do not work" (Collopy & Hollingsworth, 2011).
While a requirements-driven design approach seeks to choose the "best" or optimal solution given a set of constraints, a value-driven one seeks to define what "best" means by exploring the system value as derived and perceived by its stakeholders. By focusing on creating value, rather
than meeting requirements, the microgrid designers are able to come to a deeper understanding of the user's needs and preferences. A value-centric approach allows the designer to generating new alternatives and a more expansive solution space during the conceptual design stage.
Decision-makers are often faced with the problem of attaching a dollar value to non-monetary benefits and costs such as environmental effects. Industry experts agree that customers also tend to overestimate the monetary value of reliability (Wood, 2016). A structured method for capturing stakeholder value preferences will enable designers to better understand and communicate the value that can be derived from each design alternative.
An example of a value-centric design methodology is Multi-Attribute Tradespace Exploration (MATE), developed at MIT for exploring many design options in the early design phase (Ross,
2003). It allows designer and decision makers to explore the tradespace of possible design
alternatives, instead of prematurely settling on single point designs. Initially developed for designing aerospace systems, MATE has since been applied in other domains including weapon systems (JDAM and small-diameter bomb), transportation systems (Nickel, 2010) and others.
1.2.3 Uncertainty and Risk
Uncertainty also poses another challenge in designing microgrids. There may be uncertainty in the identification of stakeholder preferences, which may change under different environmental states. For that matter, even the stakeholders themselves are subject to change when new building users or regulators are introduced throughout the lifecycle of the microgrid. In the face of imminent and rapid changes in the technological, economic and regulatory conditions, designers ought to design systems (such as value-robust microgrids) that are able to deliver value to its stakeholders across changing contexts and needs (Ross & Rhodes, 2008a).
Traditional design approaches optimize the system under assumptions that are specific to a defined context. Designers are guided by static stakeholder needs to derive requirements and an objective function, with the aim of finding the optimal solution. But with changes in needs and operating contexts, the selected design is not guaranteed to prevail as the "best" solution.
A dynamic system perspective is needed to understand how value is influenced as the system transits across a continuity of changing states (Ross & Rhodes, 2008b). Building upon the visual tradespace exploration capabilities used in MATE, Epoch-Era Analysis (EEA) was developed as an approach to conceptualize how delivered value changes across time periods bounded by defined contexts and expectations. EEA provides designers with insights on the system's ability to continue delivering value to its stakeholders across changing contexts.
A value-centric design approach is compatible with risk management, a process commonly used to address uncertainty in power systems design and the management of complex infrastructure projects. Kaplan and Garrick (1981) provide a definition of risk that includes three aspects: scenario description, the probability of that scenario and the consequence or evaluation measure of that scenario. The stakeholders' definition or perception of risk is determined by the scenarios or outcomes that they value. In other words, risk entails a chance of losing something of value and the act of defining risk requires decision-makers to exercise value-focused thinking when they reflect on outcomes that matter (Fischhoff & Kadvany, 2011).
1.3 Research Questions and Thesis Overview
The above challenges provide the motivation behind the aim of this thesis, which is to investigate the usefulness of a value-centric approach for performing conceptual design of microgrids, with the goal of identifying design alternatives that are value-robust under the uncertainty given changing needs and contexts. The research in this thesis is guided by the following questions:
1. What is value robustness as applied to microgrids?
2. What insights can be gained by applying Multi-Attribute Tradespace Exploration to microgrid conceptual design?
3. How can value-robust microgrid designs be identified using the Epoch-Era Analysis approach?
These questions will be explored through a literature review and a case-study, in which the applicability of MATE and EEA for microgrid design will be explored. Chapter 2 introduces the
two value-centric methods, namely MATE and EEA that are used for identifying value-robust designs. In Chapter 3, a case study is presented to demonstrate how MATE and EEA can be applied to the conceptual design for a military microgrid. Finally, a conclusion is given in Chapter 4 to discuss the insights from this study and recommendations for future work.
2 Designing Systems for Value Robustness
2.1 Creating Value
"Value" is a ubiquitous concept that carries with it various meanings and nuances in different fields. Ross et al. (2010) provided an exploration of these multifaceted definitions, highlighting the different ideologies behind interpretations of "value" in economics and philosophy, and how they shape the notion of "value creation" in engineering and design.
A closer look at the engineering design process can help to shed light on certain aspects of value. Engineering design can be defined as "a human process of synthesis and integration of technical knowledge... whose aim is to meet human needs by creating actual artifacts (as well as algorithms, processes, and systems) that meet those needs" (de Weck, Roos & Magee, 2011). The end goal of systems design and development-meeting human needs and wants-is closely linked to the idea to creating value. An important aspect of value is the satisfaction or utility that is derived by the individual or entities whose needs are met by the system. Cost is another aspect that goes into defining value, since resources are required as necessary inputs to the systems design and development process. The inherent subjective quality of value is apparent when we think of engineering design as a socio-technical process performed by value-creating entities to meet the needs of value-consuming entities. Taking these aspects into consideration, we will define value simply as the "perceived benefit net of cost" (Ross, 2003).
2.2 Value-Centric Approaches in Engineering and Management
Keeney emphasizes the importance of "values" in decision making, advocating the approach of "value-focused thinking" as opposed to "'alternatives-focused thinking" (Keeney, 1993). Alternatives-focused thinking is the more prevalent problem-solving approach that limits decision makers to making choices among offered alternatives. He argues that values should be the fundamental driver for decisions and that value-focused thinking allows decision makers to uncover hidden objectives, evaluate existing alternatives and to generate new ones. A value-centric approach therefore frees decision makers from the constraints of a pre-defined decision problem, rather enabling them to identify new decision opportunities and avenues to create value.
There have also been various methods and frameworks that have been implemented in the
industry to bring about a more deliberate approach towards value creation and delivery. Value
Engineering (VE) is an approach for achieving optimum value for initial and long-term
investment by seeking to satisfy the required function and quality while eliminating unnecessary
cost (Cullen, 2016). VE was first introduced during World War I at General Electric, and has
since been widely used in the AEC industry and adopted by the U.S. Department of Defense
(DoD, 2016a). For applications in the AEC industry, VE activities can be carried out anytime in
the project lifecycle (from planning to design and even during construction), even though the
potential for cost savings are the greatest in the initial stages of the project. The activities are
carried out in the form of workshops that can involve the VE team, the design team, the users or
the client. For example, a VE team in a workshop during the planning stage may seek to obtain
the owner's definition of value, define the objectives for the project and to review options in the
master plan. In the construction stage, VE is mainly used as a change management tool, to
involve the client and the project team in assessing the impact of change proposals that promise
enhanced value to the user.
LL
Figure 2-1 Potential savings from implementation of VE across different project stages (Cullen,
2016)
Earned Value Management (EVM) is a framework used for project planning and performance
tracking in commercial and defense sectors. The DoD fully embraces EVM for its acquisition
programs, using it to provide contractors and various stakeholders with a unified view of
complex projects and the ability to track project performance in terms of meeting scope,
schedule and cost targets (Ernst, 2006). EVM is useful as a reporting tool and as a method for performance projection, allowing for effective oversight and decision making at the strategic, operational and tactical levels.
The idea of a "value chain" was popularized by Porter (1985), who introduced it as a process view of a firm comprising of activities to "design, produce, market, deliver, and support its product". In this concept, value is created and delivered to the customers in the form of products and services. At an implementation level, we observe that the value chain framework also serves to create and deliver value to the finn and its shareholders, since it is designed to facilitate strategic thinking for the firm to attain an advantage in a competitive market.
Efforts towards incorporating value-based approaches into engineering design and management have been effective in helping organizations achieve success in meeting project goals. For example, the DoD reports that cost avoidances of approximately $1 billion per year have been consistently achieved with the implementation of VE (DoD, 2016). Engagement with stakeholders in the planning stage enables key criteria and objectives to be defined, contributing to fewer changes in scope and rework later in the project.
However, it is important to be aware that needs are not static, and that engineering change is a fundamental part of the design and development process. Regulations and legislations, supply chain disruptions and competition are some sources of change that are common to different industries (Eckert, Clarkson, de Weck & Keller, 2009). Because needs are context dependent and will be affected by such exogenous influences, changes in the value perception of stakeholders are inevitable; we can expect people to change their minds. Decision makers change their perception of utility that can be derived from the system, often leading to changes in requirements. In order to design systems that can successfully create and deliver value to its stakeholders over time, it is crucial to appreciate the dynamic nature of the system and to recognize that value perceptions will change under different contexts.
2.3
Value Robustness
Value robustness is defined as "the ability of a system to continue to deliver stakeholder value in the face of changing contexts and needs" (Ross & Rhodes, 2008a). Ross (2006) describes a value-robust system as "one that has no change in perceived value, in spite of changes in components or context." The stakeholders of a value-robust system continue to receive value from it, even if their perception of value changes over time.
Designing systems for value robustness requires the incorporation of a dynamic perspective to provide a temporal view of the system (Ross & Rhodes, 2008b). Traditional design methods adopt a static system perspective because it provides useful simplifications of the design approach with fixed constraints and well-defined objectives. A static perspective is limited, however, in enabling designers to explore how value delivery can vary over time. For similar reasons, a requirements-based approach is inadequate for thinking about value robustness because requirements -which serve to provide a mapping of needs to specifications- are often based on the assumption of static needs. In reality this assumption breaks down readily, as the perception of value is a malleable construct that can be easily changed under the influence of changing contexts.
2.3.1 Passive Value Robustness
Ross (2006) suggests two strategies for achieving two corresponding types of value robustness. The first strategy is to achieve passive value robustness by choosing good or "clever" designs that does not need to change. This can be accomplished by incorporating excess capabilities into the system to improve its stability against perturbations in changing contexts and value expectations.
As an example of realizing passive value robustness, microgrids can be designed with excess power generation capacity to meet anticipated growths in local demand. In the event when the load is increased due to an increase in user population or building expansion, the existing microgrid will be able to provide adequate electricity supply without the need for upgrading its generation capacity.
Redundancy is another means of achieving passive value robustness. Electric power systems are
designed with the duplication of critical components to mitigate the risks of component failure.
In the event of a component failure, the redundant components help to ensure continuous
operation and uninterrupted system availability.
A diverse power mix comprising of various renewable energy sources provide value robustness
by ensuring that sufficient power generation is achieved, despite the changing seasonal
availability of wind and solar energy throughout the year. For day-to-day operations, Figure 2-2
shows that the integration of energy storage with coordinated charging and discharging cycles
enables solar PV energy to be stored and utilized at night. Value is delivered to the users in the
form of lower carbon emissions and lower dependency on electricity from the grid.
1 2 3 4 5 88 9910 11 12 1314 15 1811 18 192i1 2223
- DEMAND PV SUPPLY
Figure 2-2 Storing generated energy for use on demand
2.3.2 Active Value Robustness
The second strategy is to achieve active value robustness by designing a system for changeability,
so that it be may altered over time along transition paths to deliver value across its lifecycle. A
value-robust system can exhibit various aspects of changeability, including flexibility, adaptability, scalability and modifiability.
In response to uncertainties, infrastructure systems are sometimes developed using a phased-development approach to reduce initial cost and minimize downside risk (de Neufville & Scholtes, 2011). Value-robust microgrids can be developed by provisioning for transition pathways that lead to new designs with a modified set of attributes. For example, the choice of architecture and control scheme can be made in anticipation of future potential connections with other microgrids to enable coordinated energy management at a regional level.
The advanced sensing and control capabilities of a microgrid allow it to detect fault conditions and perform timely power rerouting operations. This is sometimes being referred to as a "self-healing" capability, and is an example of adaptability without the need for an external change agent.
The islanding capabilities of a microgrid is also an example of active value robustness through flexibility. Fricke & Schulz (2005) characterized flexibility as "a system's ability to be changed easily," adding that the change is implemented by an external agent to cope with changing environments. When facing an anticipated disruption from the utility, such as in the event of an imminent storm, the microgrid user can easily disconnect from the utility grid. Transitioning into islanded mode changes various aspects of the microgrid, including its operations and generation mix. The operator can just as easily re-establish connection with the grid when another context change occurs.
2.4 Design Tradespace Evaluation
Two methods used for supporting design for value robustness, Multi-Attribute Tradespace Exploration (MATE) and Epoch-Era Analysis (EEA) are described in the following sections.
2.4.1 Tradespace Exploration
Tradespace exploration is a model-based technique that allows for numerous design alternatives to be evaluated, providing the designer with insights into the tradeoffs associated with changing
different design variables. A tradespace is a representation of a set of all possible design options
that are generated by a given set of design variables, and each point on the tradespace refers to a
specific architecture or design option. The Pareto Frontier represents the set of points that show
good tradeoffs between the metrics
-
they are the best in a given metric with all the other
metrics held constant. The Pareto Frontier also represents the set of non-dominated architectures,
while the other points below the front are said to be dominated. However, dominated solutions
need not necessarily be bad choices, since they might perform better than non-dominated
solutions when considering metrics or constraints that are not initially captured.
Tradespace exploration allows for the efficient evaluation of hundreds to thousands of concepts.
To appreciate the advantages of tradespace exploration over other methods that may be used for
conceptual design, we can consider the four classes of trade studies shown in Figure 2-3.
CC
00
4)
0
cost
Figure 2-3 Classes of trades: 1) local points, 2) frontier points, 3) frontier sets and 4) full
tradespace exploration (Ross & Hastings, 2005)
An approach with the least effort would be to focus on a local point solution. That is to say, to
scrutinize a single design solution instead of considering other designs in the tradespace. It is
common for designers to rely on the comparison of a small number of preferred point solutions,
which results in the inability to identify better solutions that may be able to deliver better value,
and significantly reducing the number of available choices.
Moving beyond point solution comparisons, studying the Pareto Frontier subset solutions allow designers to start understanding the key value tradeoffs in the tradespace. To explicitly identify the benefit-cost tradeoffs among design options, the designer will need to consider the complete Pareto Frontier. With the complete frontier, new designs options can be assessed by considering their distance from the "optimal" tradeoff curve.
A complete tradespace exploration considers not only the Pareto Frontier but also the dominated point solutions. As mentioned earlier, some dominated solutions may actually outperform non-dominated ones, since there may be certain value metrics that are not captured in the analysis. Considering all the design options allows for more detailed analysis of the tradespace structure, allowing the designer to consider the significance of features such as clusters or strata. Dynamic analysis can also be performed to investigate the sensitivity to certain metrics or constraints and to understand the robustness of certain solutions to perturbations.
2.4.2 Multi-Attribute Tradespace Exploration
An architecture tradespace typically represented plotting individual design points against two axes - benefit versus cost. The simplicity of representing design options on a two-dimensional space allows designers and analysts to easily comprehend the tradespace and make intuitive tradeoffs between the two axes. To achieve such a concise benefit-cost representation will require a way to aggregate and condense the various preferences and key decision metrics of the stakcholders.
In the design and evaluation of engineering systems, the benefits derived from the system are often referred to as "value" that is delivered to its stakeholders. Ross et al. (2010) noted a shift towards value-driven design in industry, government and academia, as compared to the more traditional approach of relying on requirements and cost-related characteristics in engineering system design. This trend has led to the emergence of value-centric design methodologies (VCDMs), which are used in the early concept generation and evaluation phases to provide decision makers with insights for design selection based on derived system value as a criterion.
Ross et al. surveyed several VCDMs and noted that each method is unique in its interpretation and quantification of value. The ideal VCDM for a design process should be one that interprets
and quantifies value in a way that aligns with the stakeholders' own interpretation and perspectives of value. The inherent assumptions of the VCDM should also be acceptable to the stakeholders such that the quantification of value can be deemed credible.
One of the VCDMs reviewed by Ross et al. (2009) is MATE, which makes use of multiple attribute utility theory (MAUT) to numerically quantify the value of an engineering system. Expected utility theory is widely used method in economics and decision analysis, and when applied to the context of system design, is useftil for quantifying the benefits of a particular design decision. Each of these benefits is represented as an attribute, defined as a metric that measures the degree to which an elucidated objective is met. Considering the uncertainty of possible outcomes, the individual decision maker's preferences for an attribute is then expressed
in terms of a dimensionless utility metric. The possible range of the single attribute utility is scaled between the extreme bounds of 0, which corresponds to the lowest acceptable value of the attribute, and 1, which corresponds to the best acceptable case.
In the design of engineering systems, decision makers are concerned with a set of attributes. Keeney and Raiffa (1993) extended the theory to allow for consideration of multiple attributes. Through a multi-attribute utility analysis (MAUA), numerous single attribute utility functions can be aggregated to give a single multiple attribute utility function, which represents the overall
utility of a set of attributes for a stakeholder. The multi attribute utility function is given as
N
KU(X) + 1 = J[KkiU1(Xi) + 1]
i=1
where K = [lG1 (Kki + 1) - 1, a normalization constant that quantifies the utility function on a
from zero to one. U,(X) is the utility function for a single attribute X and U(X) is the multi-attribute utility function that aggregates n number of attributes. k is the multi-attribute utility value for attribute X, acting as a weighting factor to that attribute that indicates its relative
Single Sal Case; New Utilities; 9930 archs
*
~
, p..A42 44 46 48 50 52 54
Total Lifecycle Cost
($M2002)
Typical tradespace representation
56 58 60
(Ross & Hastings, 2005)
The motivation of using MAUT for tradespace exploration lies in its ability to qualitatively represent not just monetary but also non-monetary benefits, thus overcoming the difficulty of assigning dollar figures to stakeholder perceived value. The ability to aggregate multiple attributes also supports the designer's need to simultaneously consider multiple objectives under uncertainty.
2.5
Multi-Epoch Analysis
As part of a dynamic approach to performing MATE over time, Ross & Rhodes (2008b) introduce Epoch-Era Analysis (EEA), wherein the temporal constructs of epochs and eras are used to define system change scenarios. These are value centric timescales, defined by the context and value expectations. Rather than using traditional system timelines that are characterized by milestones or lifecycle phases, the use of value centric timescales can enable understanding of system value delivery across its lifespan.
0.7~ 0.6 05 0.41 024 41 Figure 2-4
0
The context and expectations are fixed within an epoch, and each epoch can be characterized by
static constraints, available design concepts, available technology and articulated attributes.
Multiple epochs can be strung together to form the system era, which describes the entire
lifespan of the system. While a full EEA can be performed for analyzing the value-delivery of a
system across its entire system lifecycle, the same techniques can also be used to generate
insights for performance across multiple sequential epochs without constructing the entire
system era (Fitzgerald & Ross, 2012).
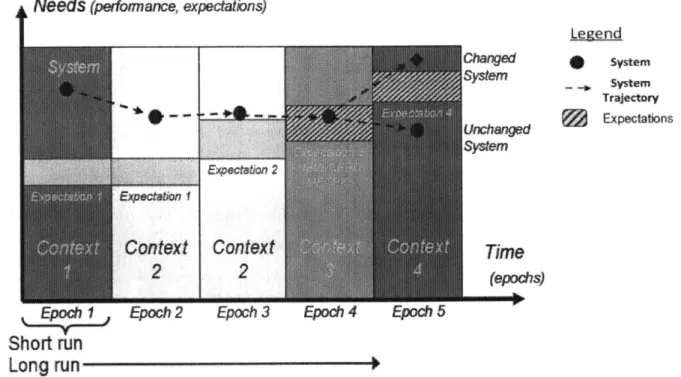
As contexts and expectations change, the system undergoes a temporal evolution in order to meet
or exceed the needs identified for the new epoch. The system shown in Figure 2-5 exhibits
passive value robustness across the first 4 epochs, since it is able to successfully maintain value
delivery (even though its value is degraded with the context change in Epoch 2) while remaining
unchanged in spite of changes in context and expectations. In Epoch 5 however, an unchanged
system will not be able to remain successful with the change in context and expectations. The
system exhibits active value robustness if it is capable of changing to meet the needs in Epoch 5.
Needs
(pewfomance, expectations)
JegeQd
ctkiged System
Sys Syste
Trajectory
E oExpectations
Context Context
Time
2
2
(epocs)
Short run
Long run
Figure 2-5 Needs and expectations across epochs of the system era (Ross & Rhodes, 2008b)
To extend the use of MATE to multi-epoch analysis, it is useful to consider a dynamic perspective of the system as a movie made up of a series of static frames run in succession. Static analysis techniques can be applied in each frame, while the continuity of states across the boundary of the frames provides a coherent stringing of the static snapshots. This perspective allows for decision making in a value-centric framework, and provides insights on how value may be shaped by the unique factors that define the context in each period.
For each epoch, models can be used to populate a static tradespace, outputting the attributes and cost of each design for evaluation using MATE. The performance and cost of the design solution can then be assessed across multiple tradespaces and epochs, allowing for the identification of potentially value-robust designs that can remain successful through the system lifespan. It should be noted that since the MAU and MAE values are only well defined within the given context, they cannot be compared across different epochs.
Parameters called epoch variables are used to characterize an epoch for analysis. The epoch variables, which represent the possible future needs and contexts for the system, can be categorized under exogenous sources of uncertainty such as strategy, policy, technology and resources. Enumerating across the range of epoch variables gives the possible number of epochs (and corresponding tradespaces) to be analyzed, each defined by a unique set of contexts and needs.
2.6 Quantification of Value Robustness
A multi-epoch analysis allows designers and decision makers to observe the impact of each epoch variable on the tradespace and on design solutions of interest. For a more analytical approach, the metric of Pareto Trace can be used to identify passive value-robust designs across multiple tradespaces. The Pareto Trace of a design alternative is defined as "the number of Pareto Sets containing that design" (Ross, Rhodes & Hastings, 2009). Pareto Tracing provides a quantifiable measure of passive value robustness; designs with a high Pareto Trace are those that appear in the Pareto Sets across different epochs. In other words, they can be identified as "good" designs in spite of changes in contexts and needs. A more detailed study of these designs can provide insights on design variables that have a significant impact on achieving passive value
robustness. Recognizing that the Pareto Trace of a design is dependent on the size of the epoch space, the Pareto Trace is normalized by the number of epochs considered to give Normalized Pareto Trace (NPT), which is bounded in the range of 0 to 1.
Active value robustness or changeability can be assessed by representing a tradespace as a tradespace network. Design alternatives are represented as nodes and the transition paths that a baseline design can take to transition to a goal design are represented as edges in the network. Transition rules are needed to determine the possibility of a transition path between two designs. The number of possible transitions is calculated for each design is calculated as its "outdegree". To account for the acceptability of transitions to the decision maker, a cost filter is applied to screen out transition paths that are costlier than the threshold defined by the decision maker. This leaves us with the "filtered outdegree" metric, which is used to quantify the changeability of a given design.
3 Case Study of a Military Microgrid
3.1 Background of Military Microgrids
A constructed case study of a hypothetical military microgrid is presented in this chapter to demonstrate how MATE and EEA can be used in microgrid conceptual design. Various rnicrogrid features, such as improved resilience via islanding and the capability to reduce carbon emissions and energy consumption with distributed generation will be considered in the design alternatives. Stakeholder preferences will be captured using MAUT, providing us with the means to evaluate the alternatives through tradespace exploration.
Choosing a grid-connected microgrid provides the opportunity to explore interesting trades among various performance attributes during both grid-tied and islanded operations. It is also a deliberate choice to study a single-user microgrid, rather than a microgrid serving multiple users or a community. This is to avoid the complexity associated with the need to consider multiple stakeholders, preference sets and value flows among various parties. Actual multi-user or community energy microgrid projects also have more complicated financing schemes and relationships between users and utility companies.
3.1.1 Energy Needs for the Military
Military microgrids are often designed to meet a demanding set of requirements, to meet the needs for energy security, environmental sustainability and cost reduction. This diverse set of objectives provides an avenue to approach this system design problem using multiple value attributes to capture stakeholder needs.
Energy security is defined as having "assured access to reliable supplies of energy and the ability to protect and deliver sufficient energy to meet operational needs" (U.S. Army, 2015). In the event of catastrophic disasters or attacks, there is a need to ensure continuity of mission-critical operations in military installations. Since U.S. Department of Defense (DoD) installations depend on electricity from the grid for 99% of their electricity needs, it is essential to build up a
security portfolio to enhance resilience against disruptions in electricity supply (Samaras & Willis, 2013).
While energy security is the DoD's first priority, it is also concerned with environmental sustainability and lowering its energy costs. Executive Order 13693 requires federal agencies to reduce greenhouse gas emissions by 40% by 2025, relative to a 2008 baseline (The White House, 2015). The DoD has been the federal government's largest energy consumer, although its energy initiatives has been successful in reducing consumption to record low levels in recent decades (EIA, 2015). About 210,000 billion BTU of installation energy was used in 2014, amounting to around 30% of the DoD's energy usage.
3.1.2 Microgrids for Installation Energy
The DoD has identified microgrids as one of its solutions for long-tenn energy security, calling it "wa more robust and cost-effective approach to ensuring installation energy resilience than the traditional approach of backup generators" (DoD, 2016b). The U.S. Army's Energy Security and Sustainability Strategy cites the deployment of microgrids as a means to "maximize flexibility in system design and use"', so as to achieve assured energy access for base operations (U.S. Army, 2015). The proposition of building microgrids is also attractive for its ability to reduce installation costs through load balancing and demand response, and to facilitate the integration of renewable energy resources.
Smart Power Infrastructure Demonstration for Energy Reliability and Security (SPIDERS) is a technology demonstration program that was done in collaboration with the DOE and the Department of Homeland Security (NAVFAC, 2015). The aim of the program is to demonstrate an architecture for cyber-secure microgrids with the ability to maintain resilient power generation and distribution in island mode for extended periods of time. The program was executed in three phases, involving three microgrids in different installations, each with an added level of complexity. The microgrid architecture was based on Sandia National Laboratories' Energy Surety Microgrid (ESM) design methodology, which incorporates a risk management approach for cyber security and has a strong focus on improving reliability when integrating renewable energy sources during island mode (Veitch, Henry, Richardson & Hart, 2013).
3.2 Case Study Overview
In this case study, MATE and EEA will be used for the conceptual design of a hypothetical military microgrid in Fort Carson, with a focus on determining the generation mix and sizing for the microgrid. Fort Carson is a 137,000-acre Army installation located in El Paso County, CO, near Colorado Springs. It was the location for Phase 2 of the SPIDERS program, during which a microgrid was built to connect a cluster of seven buildings. SPIDERS Phase 2 was successfully completed with an operational demonstration of the microgrid operating in island mode for 74.8 hours (Barr & Hadley, 2014). Fort Carson was also the subject of a 2011 study by NREL, which assessed the effectiveness of energy efficiency measures, renewable energy and electric vehicle integration to establish it as a prototypical net zero energy installation for the DoD (Anderson et al., 2011). Information published in various reports under the SPIDERS and NZEI programs, including baseline load profiles and site conditions at the base, is used in this case study.
Fort Carson was also chosen for this case study because of its geographical location, where the availability of wind and solar energy presents the opportunity to consider different renewable energy resource options for the power generation mix of a microgrid. Colorado is one of the more aggressive states when it comes to supporting the penetration of renewable energy, with state policies that mandate utilities to generate at least 30% of their energy from renewable sources by 2020 (State of Colorado, 2016). The regulated electricity market conditions in Colorado also make Fort Carson a favorable choice for this study. The relationship between the base and utilities is simplified since Fort Carson only purchases its electricity from a single vertically-integrated company, Colorado Springs Utilities (CSU).
3.3 Stakeholders
Give the hypothetical nature of this case, a narrative depicting the constitution of stakeholders for the development of a microgrid in Fort Carson will be helpful for exploring the applicability of value-focused design methods. It is important to flesh out this case with identifiable stakeholders and decision makers, since value is perceived differently by different people, and their needs and preferences will directly shape the design decisions. These assumptions are purely speculative, made to illustrate their involvement in the MATE process.
It is assumed that the Army has identified Fort Carson as a suitable installation for a new microgrid development, establishing a Project Steering Committee (PSC) to provide oversight and control for the project. Comprising the PSC are commanders from the main resident units such as the 4th Infantry Division, as well as commanders overseeing the operations of buildings
that appear on the list of mission-critical loads to be served by the microgrid. The PSC is the authority for approving the project charter, design reviews, scope changes, and the acceptance of deliverables. The PSC is also able to grant funding approval within budgetary limits designated by the Army. A Project Team reporting directly to the PSC will be responsible for planning and executing the project. The work will be tendered to a defense contractor with experience in microgrid development will be engaged for the work as a design-build project. The initial stage of the project will involve a problem definition and needs identification phase, in which the designers will engage.
Each member of the PSC is a decision maker who has an interest in ensuring that the microgrid will serve the needs and enhance the mission capabilities of his or her unit. Unit commanders in the PSC have an interest in ensuring that the microgrid will serve the needs and enhance the mission capabilities of their units. They will ensure that new microgrid-related functions and processes will be incorporated into the operational strategy and concept of operations for their units. Operators on the ground are the end-users who will perform tasks such as health-monitoring, performing inspections and initiating transitions between grid-tied and island mode operations. Some members of the PSC are also involved in the command and management of Fort Carson at an installation-wide level, and will be responsible for meeting the budgetary and energy goals of the installation. The collective interest of the PSC is therefore aligned with the needs and mission of Fort Carson.
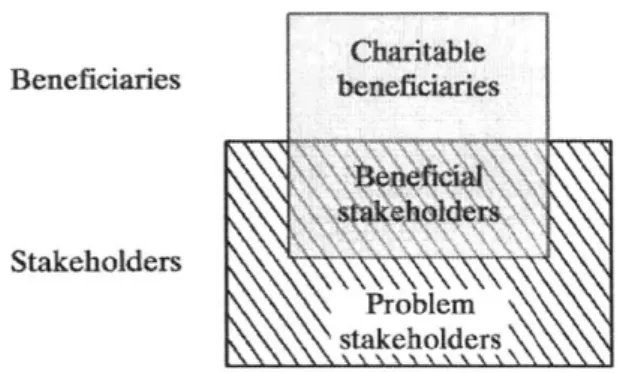
We can think of the decision makers as beneficial stakeholders, who are both the beneficiaries of the derived valued outputs from the system and stakeholders who provide valued inputs for the project (Crawley, Cameron & Selva, 2015). Driven by their needs and preferences, they will seek to make decisions that deliver greater value. Value can be expressed in terms of the utility that is obtained (maximizing the valued outputs), or in terms of the expenses that are reduced (minimizing the valued inputs).
Charitable Beneficiaries beneficiaries
Stakeholders
Problem
stakeholders
Figure 3-1 Stakeholders and beneficiaries (Crawley, Cameron & Selva, 2015)
3.4 Assumptions and Constraints
This case study will explore a hypothetical scenario that involves the development of a microgrid to serve a cluster of buildings with mission-critical loads in Fort Carson. The main purpose of the microgrid is to supply electricity to the mission-critical loads when grid power is unavailable. In addition, distributed generation resources may be added to for other secondary purposes that include improving reliability, lowering energy consumption and reducing carbon emissions. In this section, we will establish assumptions and constraints to better define the scope of this study.
3.4.1 Operational Requirements
DoD installations can typically sustain mission-critical operations for three to seven days with the use of backup diesel generators and onsite fuel storage (Stockton, 2011). For example, the Marine Corps Air Ground Combat Center Twentynine Palms has a requirement for seven days of backup diesel storage on the base (Van Broekhoven, Judson, Nguyen & Ross, 2012). Following the MIT Lincoln Laboratory microgrid study, we will assume that Fort Carson has the fuel storage capacity to allow operation of its critical facilities for a minimum of seven days. The duration of microgrid operation in island mode can be potentially extended beyond seven days by integrating distributed energy resources to reduce the load and fuel consumption on the backup generators.