HAL Id: hal-01302913
https://hal.archives-ouvertes.fr/hal-01302913
Submitted on 15 Apr 2016HAL is a multi-disciplinary open access archive for the deposit and dissemination of sci-entific research documents, whether they are pub-lished or not. The documents may come from teaching and research institutions in France or abroad, or from public or private research centers.
L’archive ouverte pluridisciplinaire HAL, est destinée au dépôt et à la diffusion de documents scientifiques de niveau recherche, publiés ou non, émanant des établissements d’enseignement et de recherche français ou étrangers, des laboratoires publics ou privés.
How transpressive is the northern Caribbean plate
boundary?
Jordane Corbeau, Frédérique Rolandone, Sylvie Leroy, Bertrand Meyer,
Bernard Mercier de Lépinay, Nadine Ellouz-Zimmermann, Roberte Momplaisir
To cite this version:
Jordane Corbeau, Frédérique Rolandone, Sylvie Leroy, Bertrand Meyer, Bernard Mercier de Lépinay, et al.. How transpressive is the northern Caribbean plate boundary?. Tectonics, American Geophysical Union (AGU), 2016, 35 (4), pp.1032-1046 �10.1002/2015TC003996�. �hal-01302913�
How transpressive is the northern Caribbean plate boundary?
Corbeau J.1, Rolandone F.1, Leroy S.1, Meyer B.1, Mercier de Lépinay B2, Ellouz-Zimmermann N.3 and Momplaisir R.4
1 Sorbonne Universités, UPMC Univ Paris 06, CNRS, Institut des Sciences de la Terre de Paris (iSTeP), 4 place Jussieu 75005 Paris, France
2
Géoazur, CNRS, Univ. Sophia-Antipolis, Valbonne, France
3
IFPEnergies Nouvelles, Rueil-Malmaison, France
4
Université d’Etat d’Haiti, Port au Prince, Haiti
Corresponding author: J. Corbeau, Sorbonne Universités, UPMC Univ Paris 06, CNRS UMR 7193, ISTEP, F-75005,
Paris, France ([email protected]).
Key points
Transpressive deformation at the northern Caribbean plate boundary is imaged The offshore Enriquillo Plantain Garden Fault Zone has a primary strike-slip motion A very small compressional component is imaged compared to short-term shortening
1
2
3
4
5 67
8
9
10 11 12 1314
15 16 17 18 19 20 21 22 23 24 25 26 27Abstract
Transpressive deformation at the northern Caribbean plate boundary is accommodated mostly by two major strike-slip faults, but the amount and location of accommodation of the compressional component of deformation is still debated. We collected marine geophysical data including multi-beam bathymetry and multichannel seismic reflection profiles along this plate boundary around Hispaniola, in the Jamaica Passage and in the Gulf of Gonâve. The data set allows us to image the offshore active strike-slip faults as well as the compressional structures. We confirm that the Enriquillo-Plantain-Garden Fault Zone (EPGFZ) in the Jamaica Passage has a primary strike-slip motion, as indicated by active left-lateral strike-slip-related structures, i.e.: restraining bend, asymmetrical basin, en echelon pressures ridges and horsetail splay. Based on topographic cross-sections across the EPGFZ, we image a very limited compressional component, if any, for at least the western part of the Jamaica Passage. Toward the east of the Jamaica Passage, the fault trace becomes more complex and we identify adjacent compressional structures. In the Gulf of Gonâve, distributed folding and thrust faulting of the most recent sediments indicate active pervasive compressional tectonics. Estimates of shortening in the Jamaica Passage and in the Gulf of Gonâve indicate an increase of the compressional component of deformation towards the east, which nonetheless remains very small compared to that inferred from block modelling based on GPS measurements.
Keywords: Caribbean plate boundary, strike-slip, transpression, shortening rate
28 29
30
31
32
33
34
35
36
37
38
39
40
41
42 43 44 451- Introduction
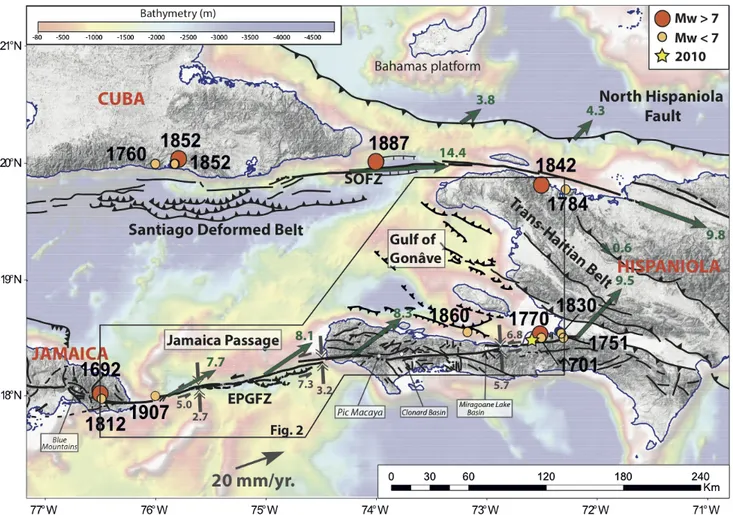
A fundamental objective at an obliquely convergent plate boundary is to understand the partitioning of deformation in both the short and long term using offshore and onshore datasets. The relative motion of the Caribbean plate with respect to the North American plate is oblique to the plate boundary, which implies both transpression and partitioning [ Heubeck et al., 1991; Mann et al., 1991; Calais and Mercier de Lépinay, 1995; Calais et al., 1998, 2016; Mann et al., 1998]. The plate motion appears to be partitioned and accommodated in the Hispaniola region along two left-lateral strike-slip structures, the Septentrional-Oriente fault zone (SOFZ) in the north and the Enriquillo-Plantain Garden fault zone (EPGFZ) in the south, and across a fold-and-thrust belt, the Trans-Haitian Belt (Fig. 1). Most of the N070°- trending relative motion between the Caribbean and North America plates, occurring at a rate of ∼20 mm/yr, is thought to be accounted for by these two strike-slip fault systems [Calais et al., 2002; DeMets and Wiggins-Grandison, 2007; Manaker et al., 2008; Hayes et al., 2010]. However, the 2010 Mw 7.0 Haiti earthquake showed that the deformation in southwest Haiti cannot be accounted for solely by the EPGFZ, and appears to involve nearby compressional structures [Calais et al., 2010; Mercier de Lépinay et al., 2011;
Nettles & Hjorleifsdottir, 2010]. Moreover, for the EPGFZ, block modelling of GPS velocities [Benford et al., 2012]
predicts fault-normal convergence of about the same magnitude as fault-parallel strike-slip, suggesting significant transpression across the plate boundary. It remains to identify the structures that account for the present-day transpression onshore and offshore and then evaluate the respective strike-slip and compressional components over time scales longer than those accessible with GPS.
The aim of this study is to identify in detail the active structures in the Jamaica Passage and in the Gulf of Gonave and therefore to improve our understanding of how the transpressive plate motion between the Caribbean and North American plates is accommodated offshore. The data collected during the Haiti-SIS cruise (R/V L'Atalante, December 2012) include full multibeam coverage of the area and seismic reflection profiles crossing the active tectonic structures (Fig. 2). Based on these new data, we can precisely map and characterize the geometry of this major strike-slip fault system and its associated features, as well as the compressional structures, in the context of transpressive tectonics.
2- Tectonic setting, historical seismicity and kinematics
Numerous reports on seismic activity and the damage caused by historical earthquakes along the north-east Caribbean plate boundary over the past 500 years allow researchers to identify the major historical seismic events and estimate their presumed locations (Fig.1) [Scherer, 1912; Taber, 1920; Dolan and Wald, 1998; Doser et al., 2005; McCann,
46 47
48
49
50
51
52
53
54
55
56
57
58
59
60
61
62
6364
65
66
67
68
69 70 7172
73
2006]. However, it remains difficult to confirm the location estimates of historical events and, in particular, to determine the causative fault structures. Here, we focus on seismic events on or near the EPGFZ. Bakun et al. [2012] estimated the intensity magnitudes and locations of certain historical earthquakes on Hispaniola. They proposed to relate the earthquakes of 1701 (MI 6.6), 21 November 1751 (MI 6.6) and 3 June 1770 (MI 7.5) to the EPGFZ, as well as possibly the MI 7.4–7.5
earthquake of 18 October 1751. By contrast, the MI 6.3 event of 18 April 1860 might have occurred offshore on a secondary
structure (Fig. 1). Bakun et al. [2012] further suggested that historical events on or near the EPGFZ might be complicated, involving unknown thrust or normal faults, as revealed by the complexity of the Mw 7.0 earthquake in 2010. This destructive earthquake involved significant slip on one or several blind thrusts adjacent to the EPGFZ [Calais et al., 2010;
Hayes et al., 2010; Mercier de Lépinay et al., 2011], with no observed surface rupture [Prentice et al., 2010]. In the case of
Jamaica, Koehler et al. [2013] claim that the 1692 and 1907 earthquakes were not associated with surface rupture along the main EPGFZ. They concluded that these historical earthquakes might have occurred either on the main EPGFZ without surface rupture, along blind structures associated with the EPGFZ, or along other on-land or offshore faults. Owing to the difficulty of conducing paleoseismic studies in a wet tropical environment, the sources of historical earthquakes remains very uncertain, especially since the regional seismicity and tectonic geomorphology suggest that plate-boundary deformation is partitioned across multiple structures that together accommodate transpressive plate motion in the northern Caribbean.
Several geological and geodetic studies have provided estimates of the slip rates along the major structures of the northern Caribbean plate boundary. The strike-slip component is mostly accommodated along the SOFZ in the north and along the EPGFZ in the south (Fig. 1). The Holocene strike-slip rate on the SOFZ has been estimated at 6-12 mm/yr [Prentice et al., 2003]. On the EPGFZ, the poorly constrained Holocene strike-slip rate is about 4 mm/yr in Jamaica [Burke et al., 1980] and about 8 mm/yr in Haiti, based on cumulative left-lateral offsets [ Mocquet and Aggarwal, 1983]. The slip-rates of active faults are also estimated using GPS measurements and block modelling, by assuming geometries and block boundary locations that are compatible as far as possible with the fault network. These models predict slip-rates not only on faults close to the GPS measurement sites but also along the offshore segments of the faults. Manaker et al. [2008] estimated a purely strike-slip velocity of 8 +/- 5 mm/yr for the SOFZ and 7 +/- 2 mm/yr for the EPGFZ, while Calais et al. [2010] estimated 12 +/- 3 mm/yr and 6 +/- 2 mm/yr respectively. The compressional component of the transpression is mostly accommodated by the North Hispaniola Fault and the Trans-Haitian belt (Fig. 1). Although there are no geological estimates of the shortening rate, several geodetic estimates are available. The north Hispaniola reverse fault accommodates
74
75
76
77
78
79
80
81
82
83
84
85
86
87
88
89
9091
92
93
94
95
96
97
98
99
100
101
2 to 6 mm/yr, while about 4 mm/yr of shortening is accommodated across the southern half of western Hispaniola in the Trans-Haitian belt [Calais et al., 2010]. A recent block modelling study based on a larger GPS data set [Benford et al., 2012] shows that the movement is currently transpressive on the EPGFZ, with a major compressional component, while mainly purely strike-slip movement occurs on the SOFZ. This model predicts 6.8 mm/yr of left-lateral slip and 5.7 mm/yr of compression onshore along the EPGFZ. Offshore in the Jamaica passage, the same model predicts 5.0 mm/yr of left-lateral slip and 2.7 mm/yr of compression in the west, with 7.3 mm/yr and 3.2 mm/yr, respectively, in the east (Fig. 1). Most authors [Mann et al., 1995; Pubellier et al., 2000; Calais et al., 2010; Benford et al. 2012] favour a diffuse zone of deformation that encompasses the Haiti fold-and-thrust belt onshore and part of the Gulf of Gonâve offshore, covering an area where the compression may be accommodated along oblique thrust faults.
3- Data collection and analysis
In December 2012, the cruise HAITI-SIS onboard the R/V L'Atalante of IFREMER carried out mapping of the offshore Haitian area including acquisition of high-resolution multibeam bathymetry data and multichannel seismic reflection profiles [Leroy et al., 2015]. In this paper, we focus on the Gulf of Gonâve and the Jamaica Passage where we obtain a total of 190 seismic profiles. The seismic reflection shot records were collected using a source comprising two GI air guns (2.46 L, 150 in3) and with a streamer with 24 traces (600 m long) operated at approximately 9.7 knots (rapid seismic system). Processing of the multichannel seismic reflection data used classical steps including CDP gathering (fold 6), binning at 25m, detailed velocity analysis, stack and post-stack time migration. All the profiles presented here are time migrated and with a vertical exaggeration of 5. High-resolution swath bathymetry data were jointly acquired along the same profiles, providing a 25-m resolution bathymetric map with almost a full coverage (Fig 2).
3.1- Imaging of the Jamaica Passage: identification of the EPGFZ
The Jamaica Passage is 200 km long between the southeastern tip of Jamaica and the Southern Peninsula of Haiti (Fig. 2). The bathymetry data allow a detailed analysis of the geomorphic domains of the Jamaica Passage. The prominent structures of the Jamaica Passage comprise the Morant, Navassa and Matley basins, as well as the Navassa Ridge in the prolongation of the Southern Peninsula of Haiti. The Morant Basin is situated between longitudes 75°55'W and 75°38'W, extending over a length of 24 km and a width of 15 km with a mean depth of 2 725 m. The Morant Basin is almost circular in shape, bordered to the west by the Holmes Bank, with a slope of about 7°, and to the south by the Morant Ridge, with an
102
103
104
105
106
107
108
109
110
111 112 113114
115
116
117
118
119
120
121
122 123 124125
126
127
128
129
abrupt slope of 23°. To the north and east of the basin, the slopes are more gentle (about 6°). The Navassa Basin, situated between longitudes 75°21’W and 75°06’W, has a rectangular shape with a length of 30 km and a width of 6 km. The mean depth is 3070 m in the west and 2975 m in the east. The Navassa Basin is separated from the Navassa Ridge to the north by a 15° slope, while the southern part of the basin is characterized by a gentle slope of about 5°. The Matley Basin, situated between longitudes 74°59'W and 74°48'W, is a circular-shaped basin 18 km long by 10 km wide. The mean water depth of 2900 m is about the same as in the eastern part of the Navassa Basin. The Matley Basin is bordered to the north by the Navassa Ridge with a slope of 11°. To the south, the basin is bounded by the Matley Ridge with a slope of 8°. The Navassa Ridge forms an offshore prolongation of the Southern Peninsula of Haiti as far as 75°32'W. The ridge is about 25 km wide and 100 km long, including Navassa Island, and shows an average seafloor depth of 1 000 m.
Linear scarps across the seafloor are revealed by the high-resolution swath bathymetry map (Figs. 2 and 3). These scarps, interpreted as the superficial expression of cumulative seafloor ruptures along the EPGFZ, extend from Jamaica to Hispaniola, crossing the southern border of the Morant Basin and passing along the northern edge of the Navassa and Matley basins. Along most of its 200-km-length, the fault is bathymetrically well expressed in the seafloor. In the Jamaica Passage, we define three distinct overlapping segments of the EPGFZ on the basis of structural discontinuities and specific morphologies [Leroy et al., 2015]. These three fault segments are distinguished by changes in fault orientation and fault trace complexity (Fig. 2). The western and eastern segments trend about N85°, while the central segment, between the Morant and Navassa basins, trends about N76°. The fault trace is unique in the western part of the western segment, whereas it becomes more complex towards the east with the occurrence of thrusts splaying off the strike-slip fault along the central and eastern segments.
Figure 3 presents details of the scarps associated with each segment. Along the western EPGFZ segment (Fig. 3a), the bathymetric close-up view shows a single fault with restraining bend structures on both sides. The main restraining bend structure is described in detail in section 3.2. The seismic reflection profile H12-038 reveals the seafloor fault scarp as well as the vertical dip of the fault plane, with the sediments being slightly deformed close to the fault. We identify a secondary fault plane, not reaching the surface that may correspond to the prolongation of the southern edge of an incipient restraining bend structure. Along the central EPGFZ segment (Fig. 3b), the close-up bathymetry and seismic reflection profile H12-032 show two very steep fault planes. The sediments are horizontal and slightly deformed near the fault traces. The southern fault expresses mainly strike-slip motion, since there is no topographic difference or offset of seismic layers on either side of the fault. By contrast, the northern fault shows evidence of thrusting, with horizontal seismic layers abutting against the
130
131
132
133
134
135
136
137
138
139140
141
142
143
144
145
146
147
148
149150
151
152
153
154
155
156
157
fault, forming a topographic step, which indicates a significant vertical offset. Along the eastern EPGFZ segment (Fig. 3c), the morphology becomes more complex and we identified several fault scarps. On the close-up bathymetry, several faults are highlighted in a deformed area involving folds and south-verging thrusts. On seismic reflection profile H12-176, we identify two steep fault planes with significant vertical offset within the deformed and folded sediments. Farther to the north, other fault traces observed in the bathymetry were not imaged by the seismic data due to steeper slopes, more strongly dipping layers and the occurrence of lateral echoes.
Our analysis of the bathymetry and seismic profiles (Figs. 2 and 3) reveals that the EPGFZ, represented by a single main fault near Jamaica, splits into several parallel fault strands towards the east, where a compressional component of deformation is expressed in the bathymetry in the eastern part of the Jamaica Passage.
3.2- Evidence for active left-lateral strike-slip motion of the EPGFZ
The current EPGFZ trace shows several indications of active left-lateral strike-slip motion along the western and central segments of the Jamaica Passage, as identified by Leroy et al. [2015], i.e.: presence of pressure ridges, restraining bend and horsetail splay. Here, we study these structures in detail (Figs. 4 and 5).
A horsetail splay, a feature characteristic of strike-slip faults, marks the western end of the western segment at about 75°58’W (Fig. 2). This feature is due to a left step-over between the western EPGFZ and eastern Jamaican segments. Here, the deformation is distributed through the horsetail, which is about 12 km long, 5 km wide, and is composed of several branching, curved normal faults, regularly spaced about 1 km apart.
Within the Morant Basin, we identified a compressional step-over in the EPGFZ trace at about 75°47'W and 18°02'N (Fig. 4a), that we interpret as a double restraining bend about 4.8 km long and 1.7 km in width. Its northern edge is characterized by a slope of 12° and a difference in seafloor depth of 170 m, while, on its southern border, the difference is 165 m and the slope is 18°. The presence of such a compressional step-over, though displaying an apparent right-lateral offset, is however associated with left-lateral motion as illustrated in the evolutionary sketch on Fig. 4b. Such features are extensively described along other gentle bends of main strike-slip systems [Bayasgalan et al., 1999; Cunningham, 2007]. The local bend along the EPGFZ is now bypassed by the main strike-slip fault in agreement with its primary strike-slip motion at depth (Fig. 4a). The main strike-slip fault bypasses the bend by connecting the two branches entering the step over and forms a 50 m wide strike-slip furrow through the apex of the restraining bend. This elevated topographic structure is a fault-related geomorphic feature providing evidence of active left-lateral strike-slip motion of the EPGFZ. Similar
158
159
160
161
162
163
164165
166
167 168 169170
171
172173
174
175
176177
178
179
180
181
182
183
184
185
structures, but at different scales, such as the Pic Macaya in Haiti and the Blue Mountains in Jamaica are associated with the EPGFZ onshore (Fig. 1; Mann and Burke, 1984; Mann et al., 1985; 1995; Abbott et al., 2013). The Pic Macaya culminates at 2347 m, representing the highest point in Haiti. This feature has been interpreted by Mann et al. [1995] as a restraining bend indicative of active left-lateral strike-slip faulting. The Blue Mountains restraining bend is also expressed by elevated relief (> 2250 m), with the onset of uplift being estimated as late Miocene in age [Mann et al., 1985; Mitchell, 2006; Abbott et al. 2013].
A set of three en echelon folds is visible in the eastern Morant Basin, at the western end of the central EPGFZ segment (Fig. 4c). From west to east, the folds have wavelengths of 1.3 km, 1.7 km and 1.5 km. The total structure length is 4.3 km. This set of en echelon folds trends roughly E-W, is at an angle of about 15° to the main strike-slip fault strike, and is located about 1 500 m south of the major strike-slip fault segment. The southern edge of the en echelon fold structure has a slope of 15° and an elevation above the seafloor of 80 m. Similar en echelon fold structures have been identified, for example, on the Dead Sea transform fault [Weinberger et al. 2014]. The formation of such folds is commonly attributed to the premature stages of strike-slip deformation [Sylvester, 1988]. The trend of this set of folds is related to the southern strand of the EPGFZ, clearly visible on the bathymetry farther east (Fig. 2). It marks the western tip of the central segment. This EPGFZ segment may currently extend farther to the west at depth, inducing the folding.
In this study, we present several topographic cross-sections along the western segment of the EPGFZ and the overlapping central segment in the Morant Basin (Fig. 5), in a zone where we identified en echelon folds and restraining bend structures. From west to east, the EPGFZ is represented on 7 cross-sections labeled A to G. The cross-sections A, D and G show that the seafloor on the northern side is elevated by about 8 to 20 m. Conversely, on cross-sections B and C, the southern side is elevated by about 10 to 20 m. Together with the observation that cross-sections E and F do not show any marked difference in elevation, the observations on the other cross-sections lead to the conclusion that there is no systematic vertical offset of the seafloor across the EPGFZ. The vertical offset of the seafloor varies along strike and in places is up to the south or up to the north, with an average difference in level of about 10 m. This is typical of a strike-slip fault, and rules out a significant thrust component, which would produce uplift consistently on one side of the fault and more constant elevation of the seafloor step.
Further evidence of active left-lateral strike-slip motion is provided by the Navassa Basin (Fig. 2), which has been identified as an asymmetrical strike-slip related basin based on seismic stratigraphy analysis [Corbeau et al., 2016]. This basin, in the middle of the Jamaica Passage, was previously interpreted by Mann et al. [1995] as a pull-apart basin bounded
186
187
188
189
190
191
192193
194
195
196
197
198
199
200
201202
203
204
205
206
207
208
209
210
211212
213
to the north and south by offset segments of the EPGFZ. However, as discussed in Corbeau et al. [2016] and seen in Fig. 2, there is no clear step of the fault trace at the edges of the basin. The trace of the EPGFZ is single and located along the northern edge of the Navassa Basin, meaning that it is an asymmetrical rather than a pull-apart basin. Pull-aparts have nonetheless been identified onshore in Haiti along the EPGFZ, e.g.: small basins near Tiburon, the Clonard Basin and the Miragoane Lakes Basin (Fig.1) [Mann et al., 1995].
3.3- Evidence for a compressional component in the Jamaica Passage and Gulf of Gonâve
Even though corresponding to a primary left-lateral motion, several structures in the Jamaica Passage are induced by the transpressive regime in the Morant and Matley basins. These basins are considered to represent pre-existing half-graben basins resulting from the rifting of the Paleocene Cayman trough, which were crosscut by the EPGFZ and subsequently folded and deformed [Corbeau et al., 2016]. In the Morant Basin, profile H12-036 (Fig. 6) shows the EPGFZ and the deformed sediments. Between CMP 1500 and 1300, north of the EPGFZ, the sediments are uplifted and blind faults can be identified. These blind faults are interpreted as branching into the main EPGFZ vertical plane at depth. This structure defines a positive flower structure. Fewer blind faults were able to develop in the southern part of the flower structure, probably due to the normal fault escarpment inherited from the half-graben. In the Matley Basin, we observed a similar structure in profile H12-057 (Fig. 7). As in the Morant Basin, the sediments are uplifted and folded near the main fault, but the deformation here is slightly larger and mostly restricted to the southeastern side of the EPGFZ between CMP 800 and 1000. Blind reverse faults are here again interpreted to branch into the main EPGFZ vertical plane at depth. Only the southeastern side of this positive flower structure is developed, possibly due to the presence of the Navassa Ridge on the northwestern side that might have inhibited the formation of reverse faults. Such positive flower structures are characteristic of a transpression regime. The compressive deformation seems to be slightly higher in the eastern part of the Jamaica Passage, as shown by the thrusting structures cutting the sea bottom south of the EPGFZ on the bathymetric map (Fig. 2, 3c and 4d). Several north‐dipping reverse faults parallel to the main trace of the EPGFZ may partially accommodate the compression in the eastern Jamaica Passage.
We use the method of line length balancing [e.g. Namson and Davis, 1988; Scharer et al., 2004] to provide shortening estimates, assuming that the folding process does not change the original bed length. In the Morant and Matley basins, the aim is to capture the shortening of the youngest pre-growth deposits affected by folding. Based on seismic stratigraphic analysis, Corbeau et al. [2016] showed that the uppermost sedimentary unit in the basins, deposited in
214
215
216
217
218
219 220 221222
223
224
225
226
227
228
229
230
231
232
233
234
235
236
237
238239
240
241
unconformity on the older units, is a syn-tectonic sequence deposited during the activity of the EPGFZ. The horizons marking the base of the uppermost folded sedimentary unit are highlighted by the black bold lines on Figs. 6 and 7. The fivefold vertical exaggeration is taken into account in the calculations. In the Morant Basin, we estimate the line length shortening as 228 m (2.1 %). In the Matley Basin, the line length shortening is almost the same (276 m, i.e. 2.1 %).
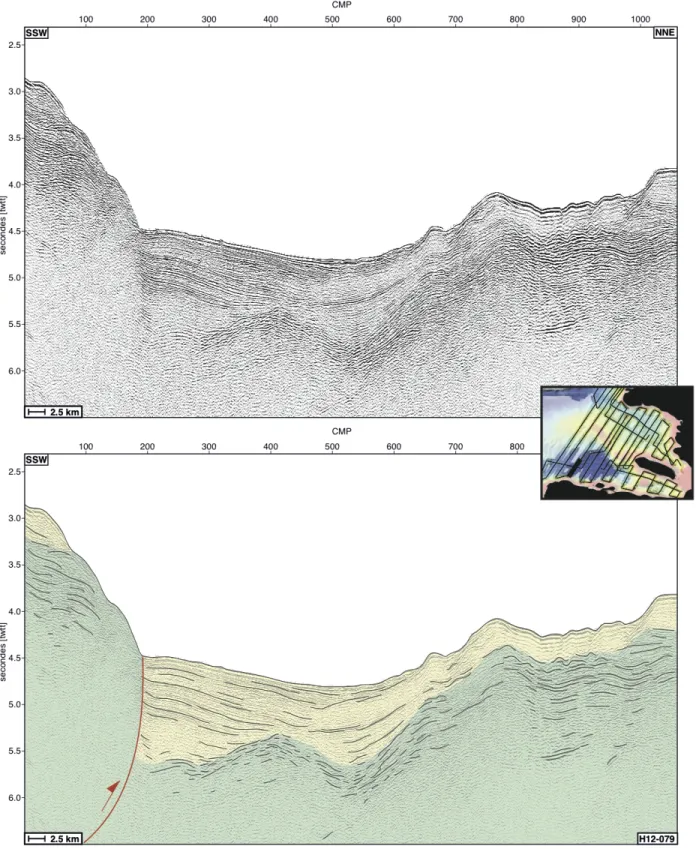
Evidence for compression is also visible in the Gulf of Gonâve, and is clearly identified in the bathymetric and seismic data (Fig. 2). The Gulf of Gonâve is a 140 km wide embayment situated between the Northwestern and the Southern peninsulas of Haiti. The most prominent features of the Gulf of Gonâve are the Jérémie Basin, Gonâve Island and the Gonâve Rise. The Jérémie Basin (shown on Figure 2) is a triangular basin 65 km in length and 25 km in width, with a water depth of about 3 600 m. It is situated between the western end of the Gulf of Gonâve and Gonâve Island. This basin is delimited by thrusts along its southern and northeastern edges that seem to pinch it. These thrusts are discernible on the bathymetric and seismic data. Figure 8 shows a typical example of a seismic profile in the southwestern corner of the Jérémie Basin. An active reverse fault is visible near CMP 200 on the SSW side, marking the northern side of the Southern Peninsula of Haiti. Northeast of the Jérémie Basin, the Gonâve Rise and Gonâve Island are situated along a NW-SE-trending axis. The seafloor depth along this 30 km wide ridge is about 400 m near Gonâve Island and about 800 m toward the west. Between Gonâve Island and the Northwestern Peninsula, a shallow basin of about 1900 m depth corresponds to the mouth of the Artibonite, the largest river of Hispaniola.
The Gonâve Rise and Gonâve Island form a broad anticlinal structure that is interpreted to be the offshore continuity of the onland Trans-Haitian Belt, a well-known fold‐and‐thrust system on Hispaniola [Mann et al., 1995]. N120°E-trending north‐dipping active thrusts have been mapped in the Haiti fold-and-thrust belt by Pubellier et al. [2000].
Mann et al. [1995] described folds and reverse faults located onshore in Haiti and offshore in the Gulf of Gonâve. Both
authors identified regional-scale folds that correspond to present-day, anticlinal topographic mountain chains in the prolongation of offshore anticlinal ridges. In the northern Gulf of Gonâve, Mann et al. [1995] identified young folding and inferred the presence of thrust faults at depth. Our new high‐resolution bathymetry data (Fig. 2) highlight such structures and allow precise mapping of the active thrust and folds, which likely absorb the compressional component of transpression in the Gulf of Gonâve. Following the 2010 Haiti earthquake, detailed bathymetry data were collected during the HAITI-OBS cruise [Mercier de Lépinay et al., 2011] in the small Gonâve Basin, south of Gonâve Island. On the basis of the limited dataset available at the time, the northwest boundary of the Gonâve Basin was interpreted as a steep SW-NE normal fault. However, the extensive bathymetric coverage and seismic profiles now available (HAITI-SIS cruise) indicate that this fault
242
243
244
245
246247
248
249
250
251
252
253
254
255
256
257
258259
260
261
262
263
264
265
266
267
268
269
is a north-dipping thrust. Several such thrusts, either north-verging or south-verging, can be identified on the bathymetry map and seismic profiles across the whole Gulf of Gonâve (Fig. 2). The orientations of these thrusts, close to the strike of the onshore structures, indicate a SW-NE shortening. The seismic profiles (see example given in Fig. 9) show folding and thrust faulting which disrupt the most recent sediments, thus indicating active compressional tectonics. Furthermore, the uplift and asymmetric folding of the Gonâve Rise and Gonâve Island are difficult to explain without thrust faults (Fig. 9). The interpreted structures correspond to thrust-fault ramps very similar to those interpreted on onshore cross-sections [Pubellier et al., 2000]. Within the Gulf of Gonâve, the compressional deformation is accommodated on multiple folds and thrusts, and thus the compression is distributed over a wide area.
Following the same approach as applied for the Jamaica Passage, we can estimate the shortening in the Gulf of Gonâve. The slope and seismic facies of the Gonâve Rise and the Gonâve basin do not allow the identification of continuous seismic horizons. Therefore, we focus solely on the most continuous seismic horizons of the northern Gulf of Gonâve. Mann et al. [1995] interpreted the upper seismic sequence of the Gulf of Gonâve as Late-Miocene to Quaternary deposits (in yellow in Fig. 9). In the absence of stratigraphic studies, drill-holes or direct dating, the uppermost folded sequence, delimited by the solid black line at its base, is used to estimate the shortening. The estimate of line length shortening is about 885 m (2.5%).
4- Discussion
The aim of this study is to investigate the relative roles of the EPGFZ and associated faults in accommodating the transpressional plate motion offshore, in order to estimate the ratio between the strike-slip and thrusting components of motion. In the Jamaica Passage, the motion along the EPGFZ is primarily strike-slip. Towards the west, the deformation localizes onto a single fault trace. The deformation becomes more distributed towards the east, with an increasing component of shortening taken up by several parallel thrusts splaying off the main strike-slip trace. While the strike-slip-related Navassa Basin, the restraining bend at a compressional right-hand step-over, the presence of horsetail splay and en
echelon structures are all consistent with primary left-lateral strike-slip motion, the shear component of the transpression
remains unknown. Indeed, strike-slip offsets along the EPGFZ are lacking because passive markers may have been masked by sedimentation or destroyed by erosion after being offset.
Nevertheless, we can calculate line length shortening to provide some estimates of the shortening in the Morant and Matley basins, using the base of the uppermost folded sedimentary unit. The estimated values are small, being 228 and
270
271
272
273
274
275
276
277
278279
280
281
282
283
284
285 286 287288
289
290
291
292
293
294
295
296297
276 m for the Morant and Matley basins, respectively (Figs. 6 and 7). In the Jamaica Passage area, no drilling data are available, making it difficult to provide an age for the uppermost folded unit, deposited during the activity of the EPGFZ [Corbeau et al., 2016]. Based on conventional field geology and the identification of local unconformities, the onset of activity of the EPGFZ is estimated to be middle Miocene to late Miocene [Draper, 1987; Mann et al., 1985, 2007;
James-Williamson et al., 2014; Dominguez-Gonzalez et al., 2015] in Jamaica, and early Miocene in Haiti [Calmus, 1983]. A
geodynamical reconstruction based on a synthesis of geological data provides a younger age of 7 Ma for the development of EPGFZ [Leroy et al., 2000]. Considering a large range of 7 to 20 Ma for the age of the EPGFZ, the calculated shortening rates in the basins are between 0.01 mm/yr and 0.04 mm/yr.
With respect to the age uncertainties of a few Ma of the sedimentary unit, we nonetheless observe that our shortening rates are considerably lower than those estimated by Benford et al. [2012] based on GPS modelling: 2.7 mm/yr in the western Jamaica Passage (Morant basin) and 3.2 mm/yr in the eastern part (Matley basin) (Fig.1). Although our estimates only account for deformation within the Morant and Matley basins, we cannot identify any other major compressional structures in the Jamaica Passage capable of accommodating a significant amount of shortening. Another possibility is that the shortening is accommodated by other structures north of the Jamaica Passage. Likely candidates are the active folds and reverse faults identified in the Santiago Deformed Belt (Fig. 1) to the south of Cuba [ Calais and
Mercier de Lépinay, 1990]. However, no long-term shortening rates have been estimated in this latter region, where the GPS
model of Benford et al. [2012] predicts 2.4 mm/yr of compression on SOFZ.
Further east, the compressional component is thought to increase. Part of the compressional component of the transpressive motion is also accommodated onshore in the Trans-Haitian belt, and offshore in the Gulf of Gonâve, encompassing the Gonâve Rise and the Gonâve basin. In the northern Gulf of Gonâve, the line length shortening is estimated as 885 m, which corresponds to only 2.5% (Fig. 9). Since all our shortening estimates are extremely small, they cannot account for the compressional component of the transpression inferred from GPS modelling. One source of bias in our calculations is that we only take into account shortening due to folding, while ignoring the component associated with decollement or thrust-faulting such as that interpreted in the Jérémie Basin and below Gonâve Island (Figs. 8 and 9). In addition, the deformation may occur on blind structures that are not yet identified. Indeed, the 2010 Mw 7.0 Haiti earthquakes revealed an unmapped blind thrust fault that could account for about 40% of the total slip by reverse dip-slip [Calais et al., 2010]. Vertical motions are also suggested by the occurrence of a tsunami linked with the 2010 earthquake, as well as nine documented tsunamis during the last 318 years in the Gulf of Gonâve and on the southern coast of Haiti
298
299
300
301
302
303
304
305
306307
308
309
310
311
312
313
314
315316
317
318
319
320
321
322
323
324
325
[Hornbach et al., 2010; Fritz et al., 2013].
In the Jamaica Passage, we see primary strike-slip deformation with very little compression compared to short-term shortening. This discrepancy may reflect differences in the long-short-term and short-short-term behaviour of this part of the plate boundary. The short-term slip-rates predicted by block modelling based on GPS measurements indicate a predominantly strike-slip motion along the EPGFZ, with a compressional component increasing toward the east. However, the magnitude of the compressional component varies according to the data set, the geometries of the blocks and the choice of location of their boundaries. The recent block model of Symithe et al. [2015] indicates a lower amount of shortening in the western part of the Jamaica Passage, but the predicted value for the eastern part of the Jamaica Passage is almost the same than in the model of Benford et al. [2012]. GPS shortening estimates are not compatible with the long-term observed morphology. We are unable to identify any significant offshore geological features capable of accommodating the rather large (2-3 mm/yr) amount of short-term shortening.
Conclusions
A marine geophysical dataset is used to illustrate the primary strike-slip motion of the EPGFZ in the western part of the Jamaica Passage, where several features are documented that express active left-lateral motion. A secondary shortening is documented which increases in magnitude towards the east of the Jamaica Passage. However, our estimated shortening rates in the basins, between 0.01 mm/yr and 0.04 mm/yr, are considerably smaller than the value inferred from GPS block modeling [Benford et al., 2012]: 2.7 mm/yr in the western Jamaica Passage (at the longitude of the Morant basin) and 3.2 mm/yr in the eastern part (at the longitude of the Matley basin). Evidence of shortening is also provided by active folds, thrusts and blind-thrusts imaged in the Gulf of Gonâve, where the estimated compressional component remains also very small (less than 3% of shortening). Our observations are in favour of a small compressional component of the regional transpression. This compressional component is accommodated on multiple folds and thrusts distributed throughout the entire plate boundary rather than partitioned on the main bordering strike-slip faults.
Acknowledgements
We thank the crew of the research vessel “L’Atalante” as well as B. Asseray and the French Embassy in Haiti. We are also grateful to the Bureau des Mines et de l'Energie, the SEMANAH, the Université d'Etat d'Haiti, and particularly C. Prépetit, D. Boisson, and J. Jadotte for their support. We thank the Associate Editor and two anonymous reviewers for
326 327
328
329
330
331
332
333
334
335
336
337 338 339340
341
342
343
344
345
346
347
348
349 350 351352
353
their constructive comments that helped improved the manuscript. Data used in this study are from the Haiti-SIS cruises (http://dx.doi.org/10.17600/12010070 and http://dx.doi.org/10.17600/13010080).
354
References
Abbott Jr, R. N., B. R. Bandy and A. Rajkumar (2013). Cenozoic burial metamorphism in eastern Jamaica.
Caribbean Journal of Earth Science, 46 :13–30.
Ali S. T., A. M. Freed, E. Calais, D. M. Manaker, and W. R. McCann (2008). Coulomb stress evolution in northeastern Caribbean over the past 250 years due to coseismic, postseismic and interseismic deformation. Geophysical
Journal International, 174(3):904–918, doi: 10.1111/j.1365-246X.2008.03634.x.
Bakun W. H., C. H. Flores, and S. Uri (2012). Significant earthquakes on the Enriquillo fault system, Hispaniola, 1500–2010: Implications for seismic hazard. Bulletin of the Seismological Society of America, 102(1):18–30, doi: 10.1785/0120110077.
Bayasgalan, A., Jackson, J., Ritz, J.F., and Carretier, S., 1999. Forebergs', flower structures, and the development of large intra- continental strike-slip faults: the Gurvan Bogd fault system in Mongolia. Journal of Structural Geology 21, 1285-1302, doi:10.1016/S0191-8141(99)00064-4.
Benford B., C. DeMets, and E. Calais (2012). GPS estimates of microplate motions, northern Caribbean: evidence for a Hispaniola microplate and implications for earthquake hazard. Geophysical Journal International, 191(2):481–490, doi: 10.1111/j.1365-246X.2012.05662.x.
Burke, K., J. Grippi, and C. Sengör (1980). Neogene structures in Jamaica and tectonic style of the northern Caribbean plate boundary zone. Journal of Geology, 88, 375-386.
Calais E., A. Freed, G. Mattioli, F. Amelung, S. Jónsson, P. Jansma, S.-H. Hong, T. Dixon, C. Prépetit, and R. Momplaisir (2010). Transpressional rupture of an unmapped fault during the 2010 Haiti earthquake. Nature Geoscience, 3(11):794–799, doi:10.1038/ngeo992.
Calais E., Y. Mazabraud, B. Mercier de Lépinay, P. Mann, G. Mattioli, and P. Jansma (2002). Strain partitioning and fault slip rates in the northeastern Caribbean from GPS measurements. Geophysical Research Letters, 29(18):3–1, doi: 10.1029/2002GL015397.
Calais E., and B. Mercier de Lépinay (1990). A Natural Model of Active Transpressional Tectonics The en Échelon Structures of the Oriente Deep, Along the Northern Caribbean Transcurrent Plate Boundary (Southern Cuban Margin). Oil
& Gas Science and Technology, 45(2), 147-160, doi:http://dx.doi.org/10.2516/ogst:1990013.
Calais E., and B. Mercier de Lépinay (1995). Strike-slip tectonic processes in the northern Caribbean between Cuba and Hispaniola (Windward Passage). Marine Geophysical Researches, 17(1) :63–95, doi:10.1007/BF01268051.
Calais, E., J. Perrot, and B. Mercier de Lépinay (1998). Strike-slip tectonics and seismicity along the northern Caribbean plate boundary from Cuba to Hispaniola, in Dolan, J. F., and Mann, P., eds., Active Strike-Slip and Collisional Tectonics of the Northern Caribbean Plate Boundary Zone: Boulder, Colorado, Geological Society of America Special
Paper, 326.
Calais, E., Symithe, S., Mercier de Lépinay, B., & Prépetit, C. (2016). Plate boundary segmentation in the northeastern Caribbean from geodetic measurements and Neogene geological observations. Comptes Rendus Geoscience, 348, 42-51, doi:10.1016/j.crte.2015.10.007.
Calmus, T. (1983). Contribution à l'étude géologique du massif de Macaya (Sud-Ouest d'Haïti, Grandes Antilles),
sa place dans l'évolution de l'orogène nord-caraïbe. PhD Thesis, Univ. Paris VI, France.
Corbeau J., F. Rolandone, S. Leroy, B. Mercier de Lépinay, B. Meyer, N. Ellouz-Zimmermann, R. Momplaisir (2016). The northern Caribbean boundary in the Jamaica Passage: structure and seismic stratigraphy. Tectonophysics, 675, 209-226, doi:10.1016/j.tecto.2016.03.022. 356 357 358 359 360 361 362 363 364 365 366 367 368 369 370 371 372 373 374 375 376 377 378 379 380 381 382 383 384 385 386 387 388 389 390 391 392 393 394 395 396 397 398 399 400 401 402 403 404 405 406 407 408 409
Cunningham, D. (2007). Structural and topographic characteristics of restraining bend mountain ranges of the Altai, Gobi Altai and easternmost Tien Shan. Geological Society, London, Special Publications, 290:219-237, doi:10.1144/SP290.7.
Cunningham, W.D., and P. Mann (2007). Tectonics of strike-slip restraining and releasing bends. Geological
Society, London, Special Publications, 290, 1-12, doi:10.1144/SP290.1.
DeMets C. and M. Wiggins-Grandison (2007). Deformation of Jamaica and motion of the Gonâve microplate from GPS and seismic data. Geophysical Journal International, 168(1):362–378, doi: 10.1111/j.1365-246X.2006.03236.x.
Dolan, J. F., and D. J. Wald (1998). The 1943–1953 north-central Caribbean earthquakes: Active tectonic setting, seismic hazards, and implications for Caribbean–North America plate motions, in Dolan, J. F., and Mann, P., eds., Active Strike-Slip and Collisional Tectonics of the Northern Caribbean Plate Boundary Zone: Boulder, Colorado, Geological
Society of America Special Paper, 326.
Domínguez-González, L., Andreani, L., Stanek, K. P., & Gloaguen, R. (2015). Geomorpho-tectonic evolution of the Jamaican restraining bend. Geomorphology, 228, 320-334, doi:10.1016/j.geomorph.2014.09.019.
Doser, D. I., C. M. Rodriguez, and C. Flores (2005). Historical earthquakes of the Puerto Rico–Virgin Islands region (1915–1963). Geological Society of America Special Papers, 385, 103-114, doi: 10.1130/0-8137-2385-X.103.
Draper, G. (1987). A revised tectonic model for the evolution of Jamaica. In Proceedings workshop on the status of
Jamaican geology, Kingston, Geological Society of Jamaica, Special Issue, 151--169.
Fritz, H. M., Hillaire, J. V., Molière, E., Wei, Y., & Mohammed, F. (2013). Twin tsunamis triggered by the 12 January 2010 Haiti earthquake. Pure and Applied Geophysics, 170(9-10), 1463-1474, doi:10.1007/s00024-012-0479-3.
Hayes G., R. Briggs, A. Sladen, E. Fielding, C. Prentice, K. Hudnut, P. Mann, F. Taylor, A. Crone, R. Gold, et al. (2010). Complex rupture during the 12 january 2010 Haiti earthquake. Nature Geoscience, 3(11):800–805, doi:10.1038/ngeo977.
Heubeck, C., P. Mann, J. Dolan et S. Monechi (1991). Diachronous uplift and recycling of sedimentary basins during cenozoic tectonic transpression, northeastern caribbean plate margin. Sedimentary geology, 70(1):1–32, doi:10.1016/0037-0738(91)90063-J.
Hornbach, M. J., Braudy, N., Briggs, R. W., Cormier, M. H., Davis, M. B., Diebold, J. B., and Templeton, J. (2010). High tsunami frequency as a result of combined strike-slip faulting and coastal landslides. Nature Geoscience, 3(11), 783-788, doi:10.1038/ngeo975.
James-Williamson, S. A., Mitchell, S. F. & Ramsook, R. (2014). Tectono-stratigraphic development of the Coastal Group of south-eastern Jamaica, Journal of South American Earth Sciences, 50, 40—47, doi:10.1016/j.jsames.2013.11.005.
Koehler R., P. Mann, C. Prentice, L. Brown, B. Benford, and M. Wiggins-Grandison (2013). Enriquillo–Plantain Garden fault zone in Jamaica: Paleoseismology and seismic hazard. Bulletin of the Seismological Society of America, 103(2A):971–983, doi: 10.1785/0120120215.
Leroy S., N. Ellouz-Zimmermann, J. Corbeau, F. Rolandone, B. Mercier de Lépinay, B. Meyer, Momplaisir, R., Granja Bruna, J. L., Battani, A., Baurion, C., Burov, E., Clouard, V., Deschamps, R., Gorini, C., Hamon, Y., Lafosse, M., Leonel, J., Le Pourhiet, L., Llanes, P., Loget, N., Lucazeau, F., Pillot, D., Poort, J., Tankoo, K., Cuevas, J.-L., Alcaide, J. F., Jean Poix, C., Munoz-Martin, A., Mitton, S., Rodriguez, Y., Schmitz, J., Seeber, L., Carbo-Gorosabel, A. and Munoz S. (2015). Segmentation and kinematics of the North America-Caribbean plate boundary offshore Hispaniola. Terra Nova
27(6), 467-478, doi:10.1111/ter.12181.
Manaker D., E. Calais, A. Freed, S. Ali, P. Przybylski, G. Mattioli, P. Jansma, C. Prépetit, and J. De Chabalier (2008). Interseismic plate coupling and strain partitioning in the northeastern Caribbean. Geophysical Journal International, 174(3):889–903, doi: 10.1111/j.1365-246X.2008.03819.x. 410 411 412 413 414 415 416 417 418 419 420 421 422 423 424 425 426 427 428 429 430 431 432 433 434 435 436 437 438 439 440 441 442 443 444 445 446 447 448 449 450 451 452 453 454 455 456 457 458 459 460 461 462 463
Mann, P. and K. Burke (1984). Neotectonics of the Caribbean. Reviews of Geophysics, 22(4) :309–362.
Mann P., G. Draper, and K. Burke (1985). Neotectonics of a strike-slip restraining bend system, Jamaica. The
Society of Economic Paleontologists and Mineralogists.
Mann, P., G. Draper et J. F. Lewis (1991). An overview of the geologic and tectonic development of Hispaniola,
Geological Society of America Special Papers, 262:1–28, doi: 10.1130/SPE262-p1.
Mann P., F. Taylor, R. L. Edwards, and T.-L. Ku (1995). Actively evolving microplate formation by oblique collision and sideways motion along strike-slip faults: An example from the northeastern Caribbean plate margin.
Tectonophysics, 246(1):1–69, doi:10.1016/0040-1951(94)00268-E.
Mann, P., C. S. Prentice, G. Burr and F. Taylor (1998). Tectonic geomorphology and paleoseismology of the Septentrional fault system, Dominican Republic. Special Papers, Geological Society of America, 63–124.
Mann, P., DeMets, C., and Wiggins-Grandison, M. (2007). Toward a better understanding of the Late Neogene strike-slip restraining bend in Jamaica: geodetic, geological, and seismic constraints. Geological Society, London, Special
Publications, 290(1), 239-253, doi: 10.1144/SP290.8.
McCann W. R. (2006). Estimating the threat of tsunamogenic earthquakes and earthquake induced landslide tsunami in the Caribbean. World Scientific Publishing, Singapore.
Mercier de Lépinay B., A. Deschamps, F. Klingelhoefer, Y. Mazabraud, B. Delouis, V. Clouard, Y. Hello, J. Crozon, B. Marcaillou, D. Graindorge, et al. (2011). The 2010 Haiti earthquake: A complex fault pattern constrained by seismologic and tectonic observations. Geophysical Research Letters, 38(22), doi:10.1029/2011GL049799.
Mitchell, S. F. (2006). Timing and implications of Late Cretaceous tectonic and sedimentary events in Jamaica.
Geologica Acta, 4(1-2), 171, doi:10.1344/105.000000363.
Mocquet A. and Y. P. Aggarwal (1983). Seismic slip rate in the Greater and Lesser Antilles: Implications for the present-day motion of the Caribbean plate relative to North America. EOS Trans. Am. Geophys. Un., 64, 832.
Namson, J., & Davis, T. (1988). Structural transect of the western Transverse Ranges, California: Implications for lithospheric kinematics and seismic risk evaluation. Geology, 16(8), 675-679.
Nettles M. and V. Hjörleifsdóttir (2010). Earthquake source parameters for the 2010 january Haiti main shock and aftershock sequence. Geophysical Journal International, 183(1):375–380, doi:10.1111/j.1365-246X.2010.04732.x.
Prentice C. S., P. Mann, A. Crone, R. Gold, K. Hudnut, R. Briggs, R. Koehler, and P. Jean (2010). Seismic hazard of the Enriquillo-Plantain Garden fault in Haiti inferred from palaeoseismology. Nature Geoscience, 3(11):789–793, doi:10.1038/ngeo991.
Prentice C. S., P. Mann, L. R. Pena, and G. Burr (2003). Slip rate and earthquake recurrence along the central Septentrional fault, north American–Caribbean plate boundary, Dominican Republic. Journal of Geophysical Research:
Solid Earth (1978–2012), 108(B3), doi:10.1029/2001JB000442.
Pubellier M., A. Mauffret, S. Leroy, J. M. Vila, and H. Amilcar (2000). Plate boundary readjustment in oblique convergence: Example of the neogene of Hispaniola, Greater Antilles. Tectonics, 19(4):630–648, doi:10.1029/2000TC900007.
Scharer, K. M., Burbank, D. W., Chen, J., Weldon, R. J., Rubin, C., Zhao, R., & Shen, J. (2004). Detachment folding in the Southwestern Tian Shan–Tarim foreland, China: shortening estimates and rates. Journal of Structural
Geology, 26(11):2119-2137, doi:10.1016/j.jsg.2004.02.016. 464 465 466 467 468 469 470 471 472 473 474 475 476 477 478 479 480 481 482 483 484 485 486 487 488 489 490 491 492 493 494 495 496 497 498 499 500 501 502 503 504 505 506 507 508 509 510 511 512 513 514 515 516 517 518
Scherer, J. (1912). Great earthquakes in the island of Haiti. Bulletin of the Seismological Society of America, 2(3):161–180.
Sylvester, A.G. (1988). Strike-slip faults. Bulletin of the Geological Society of America, 100, 1666-1703.
Symithe, S., Calais, E., Chabalier, J. B., Robertson, R., and Higgins, M. (2015). Current block motions and strain accumulation on active faults in the Caribbean. Journal of Geophysical Research: Solid Earth, 120(5):3748–3774, doi:10.1002/2014JB011779.
Taber, S. (1920). Jamaica earthquakes and the Bartlett Trough. Bulletin of the Seismological Society of America, 10, (2), 55–89.
Weinberger, R. (2014). Pleistocene Strain Partitioning During Transpression Along the Dead Sea Transform, Metulla Saddle, Northern Israel. In Dead Sea Transform Fault System: Reviews (pp. 151-182). Springer Netherlands, doi:10.1007/978-94-017-8872-4_6. 519 520 521 522 523 524 525 526 527 528 529 530 531 532 533
Figure 1: Tectonic setting of the study area. SOFZ: Septentrional-Oriente Fault Zone; EPGFZ: Enriquillo-Plantain-Garden Fault Zone. The circles with a date indicate historical earthquakes with magnitude less than 7 in yellow and greater than 7 in orange [McCann, 2006; Ali et al., 2008; Bakun et al., 2012]. The yellow star indicates the epicentre of the 12 January 2010 earthquake. The grey arrow labeled 20 mm/yr indicates the plate motion between the Caribbean and North American plates. The green arrows show geodetically inferred slip rates (in mm/yr) of active faults in the region, from the block model of
Benford et al. [2012]. Along the EPGFZ, fault-parallel and fault-normal components (in mm/yr) are specified according to
this model. Bathymetric background is from the GEBCO one-minute arc grid.
534
535
536
537
538
539
540
541
Figure 2: Main structures of the study area based on the 25-m-resolution bathymetric map of the HAITI-SIS cruise. The left part of the map shows the Jamaica Passage with the trace of the Enriquillo-Plantain-Garden Fault Zone in red. The right part shows the Gulf of Gonâve with thrusts in black. Locations of Figures 6 through 9 shown. J= Jamaica. Segmentation of the EPGFZ is from Leroy et al. (2015). Bathymetric background is the superposition of the HAITI-SIS cruise data (http://dx.doi.org/10.17600/12010070) and the GEBCO one-minute arc grid.
543
544
545
546
547
Figure 3: Structural features of the left-lateral strike-slip EPGFZ in the Jamaica Passage based on bathymetric and seismic reflection data. A-C: for each segment of the fault (western, central and eastern, Fig. 2); upper panels give details of seismic profiles and bathymetric close-up views; lower panels show the corresponding interpretations. The locations of profiles are given in the upper right panel. J= Jamaica, H=Haiti.
549
550
551
552
Figure 4: Bathymetric close-up views and elevation cross-sections highlighting different structures in the Jamaica Passage. The locations of the close-up views are given in the upper panel. (a) Double restraining bend located in the EPGFZ western segment: bathymetric view with blue line indicating location of the adjacent topographic and seismic profiles. (b) Sketch illustrating the formation of a double restraining bend. Step 1: right stepping stepover on a left-lateral strike-slip fault. Step 2: increasing strike-slip motion induces oblique shortening within the push-up and on the bounding thrusts. Step 3: bypassing of the push-up by a through-going strike-slip. The bounding thrusts merge with the through-going strike-slip fault to account for slip partitioning within the push-up. Thin black arrow figures the motion of the southern side of the fault with respect to the northern side. Red arrows figure the partitioning within the compressive step over. Thin dashed lines figure the abandoned strike-slip portions. (c) En-echelon fold structure: bathymetric view with pink line indicating location of the adjacent topographic profile, crossing two overlapping segments of the EPGFZ. We interpret the southern strand as a diffuse zone of deformation, which marks the western end of the EPGFZ central segment. No seismic profile is available in this area. (d) Thrusting structures in the south of the EPGFZ eastern segment. Due to the slopes and lateral echoes, this zone was not imaged by the seismic data.
554
555
556
557
558
559
560
561
562
563
564
565
566
Figure 5: Topographic cross-sections from west to east in the Morant basin across the western segment of the EPGFZ. The black dotted lines represent the seafloor elevation and the orange dashed lines the average elevation. North up and south up indicate that the seafloor north or south of the EPGFZ has a vertical offset with respect to the average elevation. Profiles E and F do not show a preferential up-lifted side.
568
569
570
571
Figure 6: Detail of seismic profile H12-036 crossing the Morant basin (upper panel) and its interpretation (lower panel). See inset for location and Fig. 2. The green and yellow units are the rifted basement and the sedimentary infilling, respectively. The red lines represent active faults, while the dashed black line is an inherited normal fault. The bold black horizon marks the base of the uppermost sedimentary unit, with its associated shortening estimated as 228 m.
Figure 7: Detail of seismic profile H12-057 crossing the Matley basin (upper panel) and its interpretation (lower panel). See inset for location and Fig. 2. The green and yellow units are the rifted basement and the sedimentary filling, respectively. The red lines represent active faults, while the dashed black line is an inherited normal fault. The bold black horizon marks the base of the uppermost sedimentary unit, with its associated shortening estimated as 276 m.
Figure 8: Detail of seismic profile H12-079 (upper panel) in the Jérémie Basin and its interpretation (lower panel). See inset for location and Fig. 2. The green and yellow units are the folded basement and the sedimentary infilling, respectively. The red line represents an active reverse fault.
572
573
574
Figure 9: Detail of seismic profile H12-103 (upper panel) in the Gulf of Gonâve and its interpretation (lower panel). See inset for location and Fig. 2. The green and yellow units are the folded basement and the sedimentary infilling, respectively. The red lines represent active reverse faults interpreted as branching into ramps at depth. The lower ramp inferred at depth is responsible for the uplift and the folding of Gonâve Island and the Gonâve Rise, and mapped on the bathymetric image (Fig. 2). The bold black horizon marks the youngest folded sequence, with its associated shortening estimated as 885 m.
576